THE EFFECT OF SELECTION FOR EYE FACET NUMBER I N
THE WHITE BAR-EYE RACE OF DROSOPHILA
MELA NOGASTER'
CHARLES ZELENY
University of Illinois, Urbana, Illinois
Received June 13, 1921
TABLE OF CONTENTS
INTRODUCTION . . .
Material. . . ... 4
The tabulation of f
Environmental factors. . .
Skewness. . .
Zero point.. ... . . . 18
Other examples. . . . . . 21
Application to white bar s
. . . 24
1 Contribution from the Zoological Laboratory of the UNIVERSITY OF ILLINOIS, NO. 196. I am indebted to DR. JOSEPH KRAFKA, Jr., for the greater part of the routine work of the present experiments. and to Mr. D. H. THOMPSON for help in the arrangement of the data for
publication.
2 CHARLES ZELES’Y Data (continued)
Offspring of direct-line matings.. . . 31
Distribution of frequencies in the direct lines. . . 49
Distribution of frequencies in “all matings”. . . 70
Results. . . 78
Range . . . 78
Mean . . . 87
Total divergence. . . 88
The contributions of low and high lines to the total divergence.. . . 91
The female and male means. . . 92
Standard deviation. . . . 99
Correlation between degree of selection and effectiveness of selection.. . . 107
CONCLUSION. . . 112
SUMMARY . . . 114
LITERATURE CITED . . . 115
Offspring of all matings. . . 49
INTRODUCTION
The present report is one phase of an intensive study of the germinal and environmental factors affecting eye-facet number in Drosophila.2
It gives the results of forty-two generations of selection for high facet number on the one hand and low facet number on the other. The objects in view are the determination of (1) the character of the germinal diver- sity present in the stock a t the beginning of selection, and (2) the manner of appearance of germinal changes during the course of selection. The results obtained are to be considered not only for their independent value, but also because they form a necessary link in the solution of the general problem of the explanation of the character differences. The general viewpoint of the writer has been that an analysis of a single character with a view to the correlation of the different processes involved in its production is of the greatest importance a t the present time. There is
no attempt to deny that there has been a need for the emphasis on a clear distinction between the problem of the mechanism of transmission of “genes” and the problem of the ontogenetic development of characters. On the other hand, it seems to the writer t h a t a t present there has devel- oped a greater need for the attempt to understand each of these processes in relation to the other. There can be no full understanding of the mechanism of transmission unless there is an understanding of the sort of thing that is being transmitted, and the reverse is equally true.
I n some earlier work started in 1914 (ZELENY and MATTOON 1915) it was shown that bar eye, which at that time was a recent mutation from
SELECTION IN WHITE B,4R EYE 3
full eye, possessed germinal diversity as regards the factors affecting facet number. Three successive .selections for high facet number increased the mean number from 98.0 to 139.5 and three similar selections for low facet number decreased it to 83.7. Significant progress was noted in each of the three selections in both high and low lines. While the selections were not carried on long enough to make possible a clear demonstration, the fact that regression toward the mean of the parental generation increased with successive selections made it seem probable that a limit to the progress of selection would eventually be reached. The same fact made it seem probable that the effectiveness of the selection was due to the sorting out of original differences in germinal composition.
H. G.
MAY
(1917) continued the study in this laboratory during the academic year 1915-1916. His first series, with vestigial-winged bar, died out a t the end of three generations on account of high sterility. Selection was effective for one generation but failed to produce further effects in the second and third generations. Reverse selections inlow
lines were not effective. I n a second series long-winged bar flies were used. Selection was effective for the six generations during which it was carried on, though in the low line most of the high flies were eliminated by the first three selections. Crosses between the high and low lines indicated that the hereditary factors involved in the difference between the two were not sex-linked. Outside of the selection results an important demonstration of reverse mutation of bar to full was made.
MAY’S
data on the effects of selection were not as conclusive as one might wish because of sterility and the high variability in facet number due to uncontrolled environmental factors. His results indicated the probability that temperature is an important factor in this connection. Accordingly the working out of this problem was suggested to E. W. SEY-STER in 1916. His work was incomplete a t the time he left for war service, but the results were published in 1919. I n the meantime, JOSEPH
KRAFKA,
JR., took up the problem, and his more complete analysis of thetemperature effect was published in 1920. It is clearly demonstrated by these experiments that temperature has a pronounced and definite effect upon facet number. Stated very generally, there is approximately an increase of 10 percent in facet number for each decrease of one degree centigrade in temperature except near the temperature limits, where complicating factors enter.
At the same time that these temperature experiments were begun, it was decided to carry on the other phases of the study under as accurate
4 CHARLES ZELENY
temperature control as possible. Under such conditions a series of selec- tion experiments on a red bar-eye stock, in which all individuak were derived from a single mating containing a single bar gene was started in 1916, and in 1917 a series on white bar eye. The first of these will be reported in a separate paper. The latter is the subject of the present report. *White bar was used because it was desired to duplicate an experiment which had previously been carried on by one of the students in the laboratory with results strikingly different from those in our other selection series. The data he obtained, however, have since that time not stood the test of critical analysis.
The experiments recorded in the present paper demonstrate clearly that selection, by taking advantage of the large mutations, rapidly effects an upward change to full eye and a downward change to ultra-bar. The presence of selection and its direction, however, have no effect on the character or rate of the mutations. Selection merely preserves them if they happen to be in the proper direction. Since these mutations to full eye and to ultra-bar are discussed elsewhere (ZELENY 1920 a, 1921 a) the present report will be confined to
a
discussion of other germinal differences unless the former are specifically mentioned.If
full eye and ultra-bar are set aside as they appear and attention is confined to the remaining individuals, the results demonstrate the exis- tence of distinct germinal differences in the original unselected popula- tion. The low-facet facto’rs of pronounced effect are rapidly eliminated in the high line and the high-facet factors in the low line. Factors of smaller degree are protected for a time from the action of selection by non-heritable fluctuations, but eventually they also are eliminated. Such eliminations take place in the low line following the 12th generation and in the high line following the 25th generation.A
sex-linked lethal factor affecting facet number in single dose appears in the 21st generation of the high line and persists for several generations. It causes a rise in the mean facet value of the females in these generations.Selection thus merely exercises a sorting effect and further progress after the preliminary sorting is completed is confined to new mutations whose origin is independent of selection.
MATERIAL
Full eye
SELECTION I N WHITE BAR EYE 5
facet counts of each sex in stock nunber 345 is 810.6 in the females and 849.8 in the males a t a temperature of 27” C. The data are given in table 1 under “full eye.”
TABLE 1
Eye-facet number in full-eye stock number 345 and white bar unselected stock number 133-7. FULL EYE
I
-Number of counts.
. . .
Mean of facets. ...Lowest facet number.. . . Highest facet number. . .
Mean in factorial units3.. . . Standard deviation in factorial
units. ...
Lowest individual in factorial units.. ...
Highest individual in factorial units. ...
Females
10 810.6 632 924 +26.67 f 0.24
l.llf0.17
f24.22
+28.02
Males
10 849.8 700 980 f21.15 f 0.17
1.12 f 0.17
+19.12
+22.49
W I T E BAR EYE
Females
488 58.8 21 134 O.OOfO.10
3.12k0.07
-9.68
t8.75
Males
441 111.4
35 314 0.00 f 0.13
3.91 f0.09
-
10.72t l l . 1 1
Origin
of bar eyeI n an experiment involving rudimentary- and long-winged flies and not concerned with eye characteristics,
TICE
(1914) found a single male with a reduced number of ommatidia. The eye facets were restricted to a vertical band or bar of irregular outline (figure 1 B). This male was crossed to a normal full-eyed fly, and the daughters were back-crossed to their father. From the offspring of this back-cross there were derived individuals like the original mutant male and they constitute the so-called bar-eye” race. Bar eye is a sex-linked character, and it is evident from its origin in a single male that all the future bar-eye genes are derived from the single original one. The gene is located a t 57.0 on the chromo- somal scale developed by MORGAN and his co-workers. It is spoken of as a dominant mutant in the original paper, but the heterozygotes are intermediate in facet number between bar and full eye (figure 1 Z). Using the factorial scale as applied in the present paper, the heterozygote is nearer to full eye than to bar. The facets of bar eye are divided into an upper and a lower group by a constriction slightly below the middle of the eye. It is more pronounced in low than in high bar, and in some cases the two parts of the eye are completely separated.( 6
Bar-eye stocks
A few months after the establishment of the stock, Professor MORGAN
kindly sent me some individuals which served as the basis of my stock. 3 For the meaning of factorial units see page 13 and following.
6 CHARLES ZELENY
I n September 1914, less than a year after the appearance of the original mutant, this stock was used as the starting point of the selection series described by ZELENY and MATTOON (1915). The facet counts in the un- selected stock a t this time averaged 65.06 in the females and 98.04 in the males. I n factorial units, according to the system and scale used in the present paper, these values are
+
1.50 for the females and-
0.50 for the males. The sexual dimorphism indicated in the facet counts was noted throughout the various series of experiments, but it has been shown to vary so much in degree that the method of reduction of theB
L
H
FIGURE 1.-Full and bar eyes. Females. F=full eye B =bar eye of white unselected stock number 127. Z=heterozygote of full X bar. L=selected low-bar eye. H=selected high- bar eye.
SELECTION IN WHITE BAR EYE 7
also a pronounced decrease in the dimorphism during the course of selection with inbreeding (ZELENY 1921 b).
The vestigial bar used by MAY (1917) in one of his selection series was obtained from the same stock by crossing with a vestigial-winged full- eyed race.
I n 1916 my stock was divided into parts, each of which received a dis- tinct designation. They were carried on separately with a view to determining any divergence of the mean values that might occur under the conditions. One of these stocks, number 31, was later used as the starting point of red-bar selection lines A and B, which are to be described in a separate paper. Another one, number 23, was used in producing the white bar stock which served as the basis of the experiments about to be described.
It was desired in the present selection series to duplicate as nearly as possible the material used in a previous set of experiments. Red bar, number 23, and white full-eye stocks were carried in the laboratory with- out selection or contamkation. During the summer of 1917 they were kept in a constant-temperature room a t about 25.6O
C.
Males of red bar, number 23, were mated to females of white full-eye on August 6. The F, offspring were the expected red heterozygous females and white full males. These gave in Fz the expected non-crossover and cross- over classes. The white heterozygous bar crossover females and white bar crossover males were mated in mass, and their offspring (F3) were treated as follows. The two lowest pairs, a 19-facet female and 31- facet male, and a 21-facet female and 39-facet male, and the two highest pairs, a 1.21-facet female and a 202-facet male, and a 177-facet female and a 211-facet male, were eliminated and used for a separate test. Ofthe remaining individuals a random sample was preserved for a count and the rest were mated in mass, giving the pure white bar stock (F4)
which served as the starting point of the selection series.
It is to be noted that several red bar males were used in the original cross with white full, so that several bar genes were present a t the start. This condition is to be contrasted with that in another series, described in a separate paper, in which a single bar gene was introduced.
I n MAY’S other series the bar stock was used directly.
METHOD Food
The banana was put into an Arnold sterilizer for 45 minutes, sealed Uniformity in air-tight Mason jars and inoculated with yeast as needed.
8 CHARLES ZELENY
in food conditions was by no means obtained, and some of the variability in facet number is undoubtedly due to this source. A technique making possible a better food control is highly desirable in future work of this character.
Contamination
A special effort was made to avoid contamination, because the study involved the origin of mutations as well as the effect of selection. The evidence that no contamination occurred is similar to that given by
MAY
(1917), and need not be repeated here except to state that the precautions observed were even more rigid than his, and that no case of contamination was discovered.Temperature control
I n view of the marked dependence of facet number upon temperature as demonstrated by SEYSTER (1919) and
KRAFKA
(1920), great care was taken to keep the material a t a constant temperature throughout the experiment. The departure from 27.0’ C did not exceed 0.5’ during the whole course of the selection. The details of the temperature control as given by ZELENY (1920 a, pp. 294-296) apply to the present data.Selection procedure
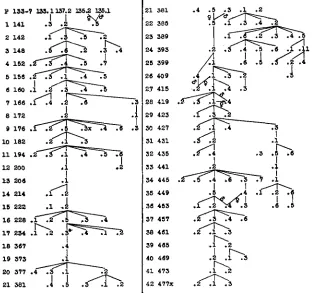
Brother-and-sister matings were made as consistently as possible. I n a few cases death or lack of fertility compelled a resort to cousin matings to insure the continuity of the experiment. Figures 2 and 3 give the pedigrees for the low- and high-selection lines respectively. The selection generations are given in the first column and the catalog numbers of individual matings in the succeeding columns. The original selections naturally came from the mass stock culture. I n the low direct line the only exceptions to brother-and-sister matings were in the first generation, which had a cousin mating, and in the fifth, which was a mass culture. I n the high direct line the only exception is in the 21st generation. Among the matings not in the direct line, one in the 20th generation of the low selection, and one each in the 27th, 28th and 36th generations of the high line are not brother-and-sister matings.
SELECTION IN WHITE BAR EYE 9
enter into the plan of the procedure as originally outlined, it did enter as an element in selection in a few places because in case the off spring of the lowest (or highest) pair were only few in number, they were more fre- quently chosen for the continuation of the line when their values were in the direction of the selection than when they were strikingly in the other direction.
P 133-7 137.2 135.2 137.1
1 1 3 8
‘y
’5.2 144 -1 e ,
I
I
.2
.l
.A
3 146
I
4 150 .3
I
5 154
d 162 +2.1
7 168
8 174
10 192
.
11 198
12 204
13 212
14 218
1
.1+2. 1 ! 3
fi . A 2 .3 .4 . I
16 224
16 230
17 236
18 366
19 369
20 375
21 379
21 379 ;3 64 .2 .1
22.383
.?
4-1 -23 38724 391
26 411 . d 4 .5?2
2a 421
.1p2
30 429
31 433
.
32 437
33 443 .3
34 447 .2
35 451
1 1
1
h
.1
36 455
.A
37 469 0 4 .1 .ll
39 467 2
-*
I
38 463 .1
40 471 .1+3 .c8
1 1
41 476 .1
42 479%
FIGURE 2.-Pedigreee in low line. The generations and culture numbers are given. The direct line is the continuous vertical one. All matings are of brothers with sisters except where male and female parents are indicated as coming from two sources.
At times the fertility was low, and it was necessary to mate as many as twelve or even more pairs to insure continuity of the lines. The offspring of the sib-matings were recorded, and the data are included in the tables labeled “all matings.” In every case, however, the “direct- line” matings are separately tabulated.
10 CHARLES ZELENY
Recording of the data
The data were recorded in notebooks paged consecutively, and entries were made in day book fashion. All the records are referred to by page number with a decimal corresponding to position on the page. For
instance, number 144.2 refers to the data recorded on page 144 in the second column from the left. The bottles of flies had the same numbers. Each bottle and each Corresponding entry in the notebook had attached to it the source of the parents, their facet numbers, date of ‘mating, food-
P 133-7 L95.1157.2 l35d 335.1
1141 a 3 - 2
2 142 2-1.
3 148 - 6 . 3 h
4 152 5-. - 7 I
6 160
.!
5-2--3
I
I
8 172 .2
I 12 260 41 13 206
14 214 . 1 4 I I
15 222 .1
“ P
16 -228 .1 4
17 234 . l h %3.
I
18 367 .4
I 19 373
20 377 .4&2
21 381
.1
.i
2*3.33 441
I 35 449
56 453
37 45.1 6-.
38 461
39 465
40 469 4 1 473 4 2 477x
FIGURE 3.--Pedigrees in high line Arrangement as in figure 2.
SELECTION I N WHITE BAR EYE 11
T h e degree o j selection
I n the low direct line the average difference between the means of the selected parents and the means of the populations of which they were a part was - 1.71 factorial units. Including the sib-matings, the average was
-
1.79.3 Due to the exigencies of the experiment, largely a matter of low viability, five of the matings in the direct line and one generation when all matings are included, were actually high selections, the means of the selected pairs being higher than the mean of the population. I n one generation, also in both direct and all matings, there was a resort to a mass selection. I n the remaining 36 generations of the direct line and 40 generations of all matings (those having a minus selection) the average degree of selection was -2.02 factorial units for the direct line, and-
1.87 for all matings. The values for the individual generations are given in tables 26 and 27 and figures 1 2 2 and 123.I n the high direct line, the average difference between averages of the grades of the selected parents and the means of the populations of which they were a part was +2.16 factorial units. Including the sibs, the average was +2.10. I n three of the generations of the direct line and in two of “all matings,” there was a minus selection. The average degree of the remaining 38 or plus generations of the direct line, was +2.41 factorial units, and of the 39 plus generations of all matings, +2.30. The values for the individual generations are given in tables 28 and 25,
and figures 124 and 125.
Synchrony between low and high lines
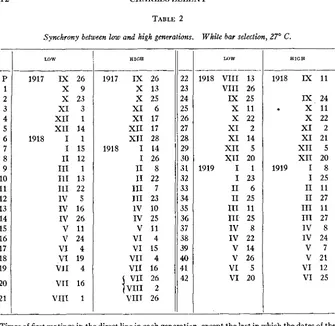
It was deemed desirable to keep the low and high lines of any genera- tion as nearly synchronous as possible. This was done with the object of aiding in the elimination of differences due to food or other factors not otherwise controllable. The degree of success of the attempt a t synchrony
is shown in table 2 which gives the dates of the matings for all the gen- erations in both low and high lines. I t will be noted that the 23rd generation of the high line is skipped in order to bring the two lines to equal dates of mating. A reference to the pedigree chart (figure 3) shows the necessity for this procedure. It was due to the loss of the prospective direct line and the substitution of a prospective sib-mating for the lost one. I n the discussion of the experiments, as well as in the tables, it seems best to call the high-selection generations beginning with the 23rd by generation numbers one higher than the actual so as to make them agree in time with the coordinate low-selection generations.
3 For the meaning of factorial units see p. 13 and following.
12 CHARLES ZELENY
TABLE 2
Synchrony between low and high generations. White bar selection, 27" C .
--
P
1 2 3 4 5
6 7 8
9 10 11 12 13 14 15 16 17 18 19
20
21
-
LOW
-
-
1917 IX 26
x 9
X 23 X I 3
XI1 1
XI1 14
1918 I 1
I 15 I1 12
111 1
Ill 13 I11 22
IV 5
1V 16
1V 26
v
11v
24V I 4
VI 19
VI1 4
VI1 16
VI11 1
1917 IX 26
X 13 X 25
XI 6
XI 17 XI1 17
XI1 28
1918 I 14
I 26 11 8
I1 22 I11 7
111 23
IV 10 I V 25
v
11V I 4 VI 15
VI1 4 VI1 16
VI1 26
VI11 2
VI11 26 22 23 24 25 26
27
28 29 30 31 32 33 34 35 36 37 38 39
40
41 42
LOW
I
H I G H1918 VI11 13
VI11 26
Ix
25x
11x
22XI 2
X I 14
XI1 5
XI1 20
1919 I 1
I 23
I1 6
I1 25 111 11
I11 25
IV 8
I V 22
V 14
V 26
V I 5
V I 20
1918
1919
Ix
11IX 24
x
11x
22XI 2
XI 21
XI1 5
XI1 20
I 8
I 25 I1 11 I1 27 111 11 I11 27 I V 8
I V 24
v 7
v
21VI 12 VI 25
Times of first matings in the direct line in each generation, except the last in which the dates of the
Average length of generation in days, low line= 12.7, high line = 12.8. Total period in days, low line =533, high line = 538.
facet counts are given.
A c c w a c y of facet counts
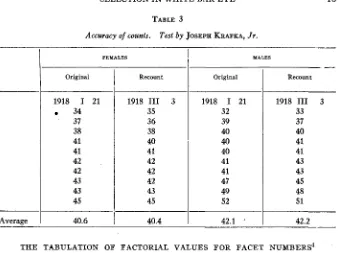
The accuracy of the facet counts was tested at various times to see if it was sufficient for the purposes of the experiment. Most of the facets are arranged in rows, and i t is easy for the eye to follow them. Some are irregular in arrangement, and occasionally one or two facets are of small size. The counts cannot, therefore, be absolutely correct under the conditions of the experiment which involved the handling of such large numbers of individuals. They are, however, of sufficient accuracy for the purpose in view, as shown in table 3, which includes an ordinary
routine count and a recount made several weeks later by JOSEPH KRAFKA,
JR., who is responsible for nearly all of the countsmade in connection with
SELECTION I N WHITE BAR EYE
TABLE 3
Accuracy of counts. Test by JOSEPH KRAFKA, Jr.
13
FEMALES
Original
1918 I 21 34 37 38 41 41 42 42 43 43 45
Recount
1918 I11 3 35 36 38 40 41 42 42 42 43 45
~ ~~
MALES
-
Original
I
Recount1918 I 21 32 39 40 40 40 41 41 47 49 52
1918 TI1 3 33 37 40 41 41 43 43 45 48 51
THE TABULATION OF FACTORIAL VALUES FOR FACET NUMBERS4
General statement
I n working up the data, it became evident that the demands of the biological analysis were not adequately met by the system of arrangement in classes with equal facet numbers. It seemed desirable in so far as is possible, to express relations directly in terms of factorial units affecting facet number rather than in facet numbers. Direct experiment with one factor, temperature, had demonstrated that its action is not one of accretion, as this system demands, but one of proportionate action. The result depends upon the amount of material acted upon as well as upon the’ temperature. Assuming that the action of other factors follows the same principle, the geometric or logarithmic mean and the dispersion of the logarithms of the facet numbers should form the basis of the biological analysis. That this is a proper procedure is further indicated by the marked positive skewness of the variation curves of facet number as plotted on the arithmetic basis and the normal form of the logarithmic curves.
The particular form which the analysis takes in the present paper was determined primarily by the need of a procedure which would enable one to ‘visualize the biological significance a t all points. The following discussion has that object in view.
4 A brief statement of this method of tabulation is given in a previous paper (ZELENY 1920 b).
14 CHARLES ZELENY
For reasons to be stated presently, in dealing with a stock averaging 30 facets as compared with one averaging 300 facets, it seemed that the unit value should not be one facet for both but rather that a change of one facet a t the mean in a 30-facet stock should be recognized as repre- senting the same factorial value as a change of ten facets a t the mean in the 300-facet stock, and a corresponding principle should apply within the range of a single stock. I n the ordinary determination of variation constants this principle is, of course, recognized in the formula for the the coefficient of variation in which C.V.= & X 100, or the standard devia- tion per unit of the mean multiplied by 100. The formula, however, makes the reduction only for the population as a whole. It does not make any provision for comparisons within the range of a single population and therefore does not meet the demands of graphic representation.
I n the tabulation with equal facet values for the different classes, the difficulties connected with the comparison of stocks with greatly different means can be met for purposes of tabulation of the data by use of the coefficient of variation as given above. I n graphic representation, the different populations can be brought to a comparable basis by using class ranges differing for the different stocks and equal for any stock to a certain definite percent of the mean of that stock. Thus for a stock with a mean of 30 facets, classes each of which has a range of 33 facets or 10 percent of the mean of that stock, might be used. Within the population of each race, however, there would still be a discrepancy between the individuals with high and those with low values, because the class range in each stock is too low for.the individuals with high facet number and too high for those with low facet number.
As given later, biological considerations in connection with eye-facet formation, and the same undoubtedly hold for many other similar organs, lead to the belief that environmental and presumably germinal factors do not act by accretion, but that the effect is upon the rudiment of the organ as a whole. A unit factorial change in a 300-facet race yields ten times as much facet change as in a 30-facet race, because it has ten times as much material to act upon.
SELECTION IN WHITE BAR EYE 15
out the whole range of variation the class ranges are comparable, and each class has the same factorial value.
The variation data are thus p u t into factorial units and not eye-facet units, and the various constants can be determined in the ordinary way. Suppose that the class facet ranges are in every case equal to ten percent of the mean class facet values, which is the amount produced by a change of one degree centigrade, and a factorial unit is one that produces a ten percent change in the facet value of a class; then, according to the hypothesis, all the factorial units have the same factorial value though their facet values vary with the means of the classes. Starting with some arbitrary point, for instance the mean facet value of the unselected stock in a selection experiment, and calling this point zero, then every facet value has a definite factorial value equal to plus or minus a cer- tain definite number of factorial units from the zero point. Five units above the mean is equal to five units below the mean, and similarly everywhere in the scale, while a departure of 3-5 or +SO facets under the ordinary system of tabulation does not have the same factorial value as - 5 or -50 facets. The standard deviation, as determined by this method, is expressed in factorial units and serves directly as a coefficient of variation strictly comparable in all cases, regardless of the mean values of the different stocks that may be cornpared.
Validity of the method
The validity of the method is, of course, dependent upon the biological assumption that eye-facet value is such a function of factorial value as is indicated. The evidence in favor of this view will now be considered.
Proportionate action wersus accretion
It is a common principle of embryology that a changed condition does not act by accretion, i.e., by the addition or subtraction of individual parts without affecting the rest. On the contrary, the action is upon all the pre-existing parts of the organ. The result then depends not only upon the strength of the new agent, but also upon the reaction capacity of these pre-existing parts. Since a new factor,
f,
acts upon the whole complex, the value of the pre-existing mechanism, m, is a factor in the result as well asf.
This general statement applies to both germinal and environmental factors. For instance, it is clear that any particular factor affecting facet number is not something which can of itself produce facets, nor is it a certain amount of substance with a capacity limited to the production of a fixed number of facets.16 CHARLES ZELENY
Ultra-bar
Low bar
Unselected
bar
=B'U
Germinal factors
As regards germinal factors, it is clear that the chromosomal mechanism distributes them equally to all the cells.of the body. Limiting the con- sideration to a single effect of a particular factor, if a t the stage a t which this factor can function there are eight cells in the reacting region in one individual and only four in another, the resultant effect is twice as great in the first as in the second. This is a crude statement of the case because the action of the different factors is no doubt to a large extent simul- taneous, but it makes clear the principle involved.
Environmental factors
T h a t the theory of proportionate action is a closer approximation for the temperature effect than the theory of action by accretion is demon- strated by the experiments of SEYSTER and of KRAFKA. SEYSTER (1919) has shown that in the bar eye, facet number decreases with increase in the temperature a t which the larvae of Drosophila are reared. This decrease follows VAN'T
HOFF'S
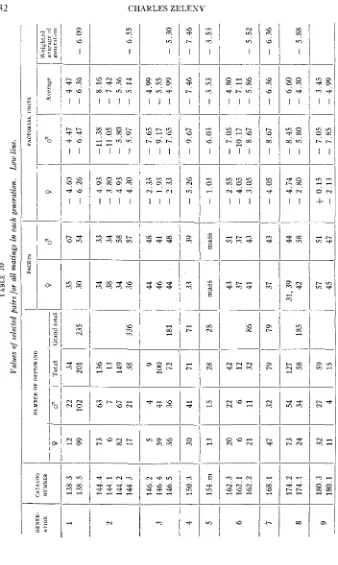
law if an inhibitor of facet number isassumed as the effective agent upon which the temperature acts. KRAFKA (1920) has demonstrated that this law applies to ultra-bar as well as to bar eye, and that for the different stocks the effect of a degree of change in temperature is roughly proportional to the mean facet value of the stock, and the same is approximately true for the effect throughout the range of a single stock. Table 4 gives the results of one of his experiments
TABLE 4
Facet values and factorial values at 15" and 25" i n ultra-bar, low bar and unselected bar.
51.5 25.2 26.3 1.0
-
0.83 189.0 74.2 114.8 4.4 +12.17269.8 120.5
1
149.3 5.7 i-15.72I
FACET VALUES
I
-7.86 +2.79
i-7.73
I-- STOCKS
1
--15"
1
25'1
Difierences1
Rat? = _.I
15'B' U
7.03 1.0 9.38 1.3
7.99 1.1
PACTORI.4L VALUES
25"
I
Differences =XI
Y:
SELECTION I N WHITE BAR EYE 17
in facet value is not a good measure of the value of the temperature factor.
On the other hand, if the facet values are reduced to factorial values, the differences between the 15' and 2S0 values are 7.03 factorial units for ultra-bar, 9 . 3 8 for low bar and 7.99 for unselected bar. The last two
values are respectively 1 . 3 and 1 . 1 times the first, while the corresponding facet values are respectively 4.4 and 5.7 times the facet difference for ultra-bar. The factorial units, therefore, give a much closer approxima- tion than the facet numbers.
A change of one facet is, therefore, not of equal factorial value a t different points in the variation scale as far as temperature is concerned.
A
plotting of the data using facets as the units does not give a uniform factorial scale. Suppose temperature to be the only factor causing variation in the facet number of a particular stock, and knowledge of the actual temperatures involved in the production of a particular population to be lacking, and i t is desired to derive the value of the temperaturQ from the facet values. Obviously the closer approximation would be obtained by the tabulation in which each class has a range equal to a definite percent of the mean of the class.KRAFKA'S
data show that even in this case the values are not exact, but certainly the error is of a much lower order than that involved in using facets as the units.Skewness
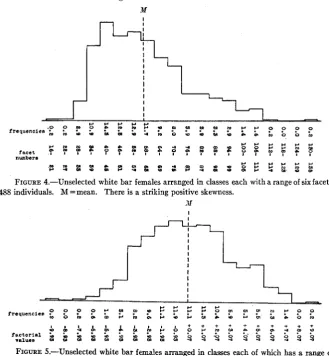
When eye-facet numbers are plotted on the basis of classes with equal facet ranges, they usually show a very distinct positive skewness, i.e., the mean is higher than the mode (figure 4). Such a skewness may be due to any one or more of a number of causes, but it is not the intention to discuss them here in detail. One evident explanation is that the facet values on that system of plotting do not correspond with factorial values. If we employ the method of factorial units, this skewness disappears in large part and the curve shown in figure 5 is obtained.
If the factorial values fluctuate evenly around the mean, the curve should be without skewness when plotted on the basis of those values, but should have a positive skewness if plotted on the basis of classes with equal facet ranges.
If this explanation applies to eye-facet numbers, i t is very probable that it applies to similar cases elsewhere. I n this connection it is inter- esting to nbte that positive skewness is very common in variation data as tabulated by the ordinary method. Some, at least, of these cases
18 CHARLES ZELENY
may be explained on the same basis as the one under discussion. Separate proof, however, is required in each case.
Zero point
The location of the point of reference or zero point in the factorial determinations a t the mean of the unselected population has the addi- tional value of being itself
in
the zone of normal factorial action. The same can not be said of zero facet number, for i t is obvious that the factorial action involved in producing a change from zero to any value above zero is of a different order from that involved in any other change whatsoever within the range of variation.M I
I
I
I
I
I
I
I
1
-
-
I- c I- l a c .
*rsquencies.K
f P a & ; ; b b L ; b ; ; L ? ? ? ?-
m I--
bl O1 I- I-’p f f
e
fF $
g ; ;
t
8 g
;
F
g
!+
b - % g % t b % g i s 2 s Q % s ~ ~ E ~ & ~ g
N O O N
c c c w
w m m
numbers
( . ’ c I - w
FIGURE 4.-Unselected white bar females arranged in classes each with a range of six facets. 488 individuals. M =mean. There is a striking positive skewness.
>If
I
I
SELECTION IN WHITE B.4R EYE 19
A
pplicatiolzto white bar selection
The scale of factorial classes with corresponding facet values as used in the white bar selection lines is given in table 5 . The first column gives the mean factorial values of the classes in the females and the third column those in the males. The middle columns give the corresponding facet ranges. The bases of reference or the zero points of the factorial scales are respectively the mean facet value of the females and of the males of the unselected population. For females this value of the zero point is 58.83.0.58 facets and for the males 111.4k1.44 facets. If the facet ratio between the sexes were a constant, it would be possible to reduce the male to the female values or wice versa, according to the method fol- lowed by ZELENY and MATTOON (1914). The great variationin the ratio in the present material, however, makes it desirable to use separate male and female scales.
Each class has a range in facet value equal approximately to 10 percent of the facet mean of its class. An exact relation of 10 percent would have involved dividing individuals with the same facet value between two classes, but the demands of the analysis are met by the approximation which allows all individuals of a single facet value to be grouped in the same class. An exception was made for individuals with 14 facets which are divided equally between two classes, as part of the procedure in making the departures of the lower classes from the mean as nearly accurate as possible.
Since on the average in the bar-eye races a decrease of one degree centigrade in temperature causes an increase of 10 percent in facet number, the factorial scale may be read as a temperature scale. I n other words its units of value are equivalent to degrees centigrade and the difference between any two points may be expressed as so many degrees of temperature. Thus the difference in facet number between ultra-bar and bar eye may be expressed as equal to approximately twelve degrees of temperature or in other words ultra-bar may be changed to the bar level by decreasing the temperature by that amount.
It will be noted that each facet value may be represented as plus or minus a definite number of factorial units from the point of reference, the mean facet value of the unselected population. The determination in factorial units of the mean, standard deviation and other constants is readily accomplished directly as in the ordinary methods. For example, the mean of the males of the 25th generation of upward selection is +4.60
kO.16 factorial units, and the corresponding mean of the males of the
20 CHARLES ZELENY
TABLE 5
Factorial scales in the white bar selection lines forfemales (jirsl column) and males (third column) using the means of the unselected population as the zero points and arranging the classes so that each will have a range approximating ten percent of its mean facet value. The corresponding facet values
of the classes are given in the middle columns.
CLASS
FEMALES FACTORIAL VALUES
-
- 16.93 -15.93
-
14.93 -13.93 - 12.93 -11.93-
10.93-
9.93-
8.93-
7.93 - 6.93-
5.93 - 4.93 - 3.93-
2.93-
1.93-
0.93+
0.07+
1.07+
2.07+
3.07+
4.07+
5.07+
6.07+
7.07+
8.07+
9.07 +10.07 $11.07 +12.07 +13.07 $14.07 +15.07 +16.07 +17.07 +18.07 +19.07 +20.07 +21.07 +22.07 +23.07 +24.07 +25.07 +26.07 +27.07 +28.07 +29.07 +30.07CLASS FACET VALUES
10 11 12 13 and 14 (part)
15 and 14 (part)
16- 17 18-19 20-21 22-23 24-26 27
-
29 30-32 33-35 36-39 40-43 44-48 49-53 54-59 60-
65 66-72 73 - 8081-88 89 - 97 98 - 107 108-118 119-131 132 - 145 146- 160 161-177 178-196 197 -2 17 218-240 241 - 265 266-293 294-324 325-358 359 - 396 397 -438 439-484 485 - 535
536-591 592 -653 654-722 723-798 799-882 883-975 976- 1078 1079-1191
CLASS FACTORIAL VALUES
MALES
-.
-23.05 -22.05 -21.05 -20.05 - 19.05
-
18.05 -17.05 - 16.05 -15.05'- 14.05
- 13.05
-
12.05 -11.05 - 10.05 - 9.05 - 8.05- 7.05 - 6.05
- 5.05
-
4.05-
3.05 - 2.05 - 1.05-
0.05+
0.95+
1.95+
2.95+
3.95+
4.95+
5.95SELECTION I N WHITE BAR EYE 21
MEAN I N FACTORIAL FACE^ ,VALUES FACTORIAL UNITS FROM U N l T S lEETEROEYGOTES MEA"I
I
25th generation of downward selection is
-
7.7 650 .1 1 . The effectiveness of the selection is represented by the difference between the t w q which is12. 36k0 .1 9. The standard deviations are 1.81 k 0 . 0 9 for the high
males and 1.77$-0.08 for the low males of this generation. They may be used directly as the coefficients of variation since no correction for mean facet values needs to be made. I n the case cited, the difference between the two standard deviations is obviously not significant. As
compared with the standard deviation of the unselected males, which is 3.91 f 0 . 0 9 factorial units, there has been a significant decrease in varia- bility.
Other examples
The advantages of the factorial basis for purposes of calculation and tabulation may be illustrated by some further examples.
The determination of a coefficient of dominance
As shown in table 6, the mean facet number of low-bar females in the twenty-fourth generation of selection is 35.1, that of full-eyed females
DOMINANCE I N PER-
CENTS TABLE 6
Doniinance qf bar and full.
Low-selec ted
bar (F24) 391.2
NUMBERS OF INDIVIDUALS
35.1 810.6 399.9 129
10 19
- 4.45 T2;:::
1
23.2+26.67 76.8
+
19.44--I
I I810.6 and that of the heterozygotes between the two, 399.9. Since the
facet values between 35.1 and 399.9 do not have the same factorial value as those between 399.9 and 810.6, the relative strengths of bar and full in determining the value of the heterozygotes cannot be obtained directly. However, by putting these facet values in terms of factorial units of equal value throughout the scale, it is possible to get such coefficients by use of the formulae
F-H F - B B - H
B - F
C.D. of bar e y e = - - - ~ 1 0 0 , and
x
100C.D. of full eye=
-
22 CHARLES ZELENY
in which B is the factorial value of bar eye,
F
of full eye andH
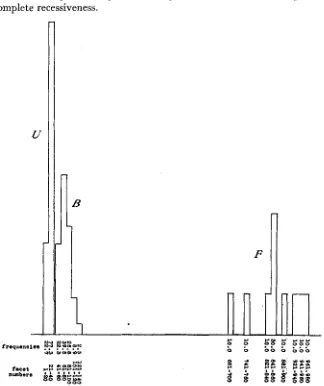
of the heterozygote. Assuming uniformity of action throughout the whole range, these determinations give a value of 2 3 . 2 percent for the dominance of low bar, and 7 6 . 8 percent for that of full eye on a scale in which 100 percent represents complete dominance and 0 . 0 percent complete recessiveness.F
lli
FIGURE 6.-Males of ultra-bar (U), low-bar of the second generation (B) and full eye (F) arranged in classes each of which has twenty facets. All raised at 2 7 O C. Compare with figure 7 which shows the same data arranged in factorial classes.
SELECTION IN WHITE BAR EYE 23
GENETICS 7: Ja 1922
10 e o
80
.o
40.0 10.0
1 0 .o
1.3
1.9
8.8 6.1 9.5 16.6 14.6 11.4 13.8 12.0
4.4 4.4 0.3
;:!I
0 . 0 2.7 11.6 26.9
24.8
1 8 - 4
9.8
4.3
0.8
0.2
0.1 .I
P) r(
0
E a
3
P) k
k
& t i
E o )
+22.96
E
E+21.95 a e
+ 20.95
+19.95 o
g
+18.95
2
2
+17.95 b
-2
+16.95 -d 1
+15.95
$
3
+14.95
:
2
@
+l3.95 $ 3
+11.95 E !$
'12.95
4
5t10.95
s
5+
9.869
g
+
8.95^^ .5
t 6.95
5
*.t 6.95 g
2
+ 4 . 9 5
;
5
+ 8.95
2 &+ 7.95
!
k
y+2.95
3
y
+
1.96 t g '+0.96
g
g-0.06 E 2
-1.05 .3 M
-2.05 & 8
-so5 5 % t i 2
-6.01
3
B-4.05 M w
a 0
-6.05
p
8-7.05 a2 8 -8.05 . 9 B
w 3
-9.05 O w
-11.05
$
d -12.05 2 2-13.05 r; g
-14.05
F
z
-16.05
b
9
-18.05 3
-2
-19.05 5 3
-20.05 %
-
-10.05 1
g
-15.05
3
2-17.05
5
3
-21.05
z
g
c;1 5 2
S I P ) $ 3 .$j
0 5 8 3 %
V d k - *
cd*
3 2
$ 3 . r (
4 0 6
2
."?
wF4
24 CHARLES ZELENY
eye (F). I n figure 6 the classes are arranged in the ordinary way so that each has the same facet range. I n figure 7 , each of the classes has a facet range equal to 10 percent of its mean facet value. The superiority of figure 7 over figure 6 as a true representation of factorial values is apparent.
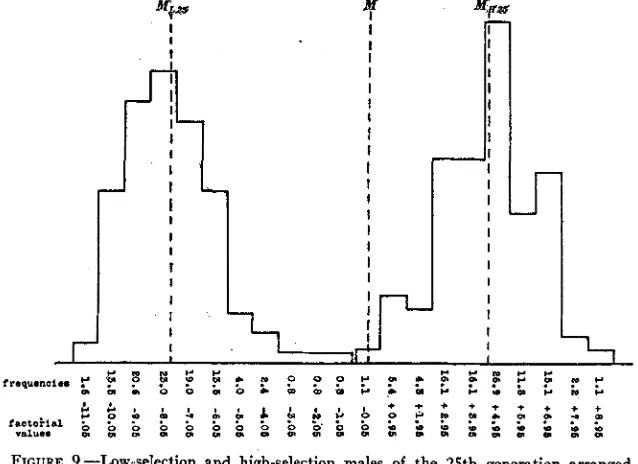
The comparison of low and high selection lines
Figures 8 and 9 represent the low and high lines of white bar eye after 25 generations of selection. Figure 8 is based on equal facet values for all the classes, and figure 9 has classes each of which has a facet range equal to 10 percent of its mean facet value. Again the superiority of the second representation is apparent.
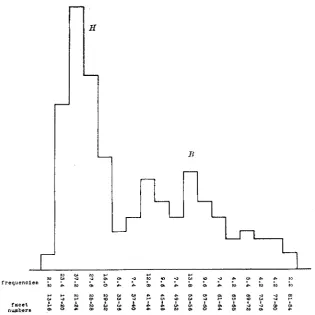
The representation of mixed populations
Figures 9 and 10 give the variability among daughters of a hete- rozygous female (from ultra-bar X bar) by a bar male. Heterozygous and bar females are expected. Other crosses show that the two classes overlap, and the same fact is indicated by the distribution in this case. Figure 10 gives the data as arranged in classes of equal facet value. Figure 11 gives them as airanged in classes of equal factorial value. The latter representation is obviously superior for purposes of biological analysis.
DATA
Original data
The importance of the manipulations to which the data are subjected has been emphasized in the last section. The original data before analy- sis should therefore be available. They have been collected for this purpose in a series of tables, of which one is published here (table 7 ) .
The complete tables are on file in the Zoological Laboratory of the UNI-
VERSITY OF ILLINOIS where they are available for study or for photographic
SELECTION I N WHITE BAR EYE 25
7: Ja 1922
1.1
0.0
0.0
L 1
6.4
4.3
6.6
6.6
5.4
11.8
11.8
lZ.9
4.3
14.0
6.6
2.5
l r l
4.5
lrl
0.8
0.8
Oi8
1.6
4.8
26.3
54.9
SO.2 m r.
0
9
2
h
*I
248- 260
236- ' e42
237 23.4
210- 826
211- 218
208- e10
196- 202
187- 194
179- 186
111- 178
168- 170
156- 162
147- 164
l.39 146
181- 138
123- 180
116- le2
107- 114
99- 106
91- 98
83- 90
76- 08
67- 74
59 66
51- 68
48- 60
86- 4P
m e$. e o
* I 5
0 s
d e
C M C ? u C
% E
LI
0
'L
$
I
;
d
6 %
L6
0
$ 3
s !
9w
2-4-
c1
L I C
0 s
D C
0
.,o
m S
2 3
0 2
C?.t;
3 8
.2 "0
- d C
$ 2
g;
5
IIY , - !
g s z
5
.g
2
2 Z - d
n E E - 2 3 " 2 %3 . 2
9
sz"0
3 a 3.e
2 d -
bD II
l
O6I
u M $
3 2 4
ys
$
2.g
29 7 2
i
.2 \o8 3
I[s s g
l $ g c6 * c j .sN \ o i
3 3
8
s
la
&$
8 - c
d B
'3 d C
m E L 6 il
C B Z
.o
2 32
B 5 o 4 4 .
26 CHARLES ZELENY
TABLE 7
Tabulation of original data. Eye-facet numbers. White bar selection. Low line. Temperature =27" C. Banana yeast food. September 12, 1917 to J d y I S , 1919. (Sample table.)
GENERATION.. . . ,
Mating . . .
.
,Parents Facets from: 0 . . .
.
. . . ..
Facets 3.. . . . . Off spring
25 26 27 28 29 30 31 32 33 34 35 36 37 38 39 40 41 42 43 44 45 46 47 48 49 50 51 52 53 54 55 56 57 58 59 60 61 62 63 64 65 66 67 Total 159.3 4 5 5 . 2
42 34, 34
? 0
-
1 1 1 1 2 2 3 2 3 2 1 1 1 1 2 2 3 1 2 1 1 1 1 3 1 1 1 4 1 2 1 1 2 1 3 2 1 1 1 2 4 1-
2 3f459. 1 4 5 5 . 1
33 34 P C
-
1 5 1 I 159.1 455.1 35 35 _. 2 < __ 1 1 1 2 1 1 1 4 2 1 3 1 1 3 1 1 1 1 1 1 1 2 1 7 1 __ 459.2 455.2 39 34-
? c-
1 2 3 1 1 2 1 1 1 3 1 1 1 1 1 _. 2 1 --
459.4 455.2 33 41 2 0-
1 1 1 1 2 1 1 1 1 5 5 - Total 0 8-
1 1 3 2 1 5 3 3 2 5 5 5 6 5 4 3 2 2 2 4 4 2 5 5 4 2 2 4 1 1 1 5 1 2 1 4 2 3 1 2 2 1 3 3 1 1 4 1 3 4 1-
3 7;
-
F 38 4 6 3 . 1 4 5 9 . 3 33 40 2 d 1 1 1 1 2 1 1 1 3 5 4 3 3 6 4 2 1 1 1 5 2 1 2 1 1 1 1 1 1 1 1 1 1 2
-
4 3c~
4 6 7 . 1 463. 35 36 P C 1 2 2 __ 1 5 4 4 5 5 3 3 2 8 4 2 3 2 1 1 3 5 2 4 1 1 1 1 1 2 1 3 4 1 2 3 1 1 1 1 1
19 4
-
__
F 39 467.2 4 6 3 . 1 43, 43 38
2 0 - 2 1 ' 1 2 1 1 1 2 1 1 4 1 4 1 2 4 2 1 2 4 1 2 2 1 1 2 1 1
-
-
1 2:_ _ Total
-
0 3 1 2 2-
1 5 4 4 2 1 5 1 5 3 5 3 9 5 4 4 3 5 2 7 1 7 6 6 1 3 1 5 2 3 2 3 1 1 3 4 2 2 2 4 1 1 1 1 1-
'0 77
SELECTION I N WHITE BAR EYE 27
the numbers of daughters and of sons from each mating for each facet count. Under each generation the first vertical column gives the mating
in the direct line. The few exceptions to
this rule are noted in the pedigree charts of tables 2 and 3.
When the mating is not of brother with sister, the fact is indicated by the presence of two catalog numbers in the third horizontal column, the upper one giving the origin of the female parent and the lower of the male parent. When more than a single male or female is included in a bottle that fact is indicated by the presence of more than one facet count under “female or male parent.”
The others are sib-matings.
II
I
I
I
I I; I
I I I I I
I
-LlJL!
Ic c , I I , * 1 , , + + + + + * + + +
“due. OI P ,o P 0 E: 0 P Ei g 8 8 t t t P t
z
f x tFIGURE 9.--Low-selection and high-selection males of the 25th generation arranged in
classes each of which has a range equal to ten percent of its mean facet value. 126 individuals in low-selection line and 93 in high. M=s=mean of low-selection line= -7.76 factorial units. MHob =mean of high-selection h e = +4.60 factorial units. M =mean of the unselected males
=O.OO.
taetotinl ? ? ? 2 n P
.r
P P.+
? ? P ? P f P P ;. ?With very few exceptions only one of the two eyes was observed, and in the few cases in which facet counts of both eyes were made, in every instance only the eye first observed is included in the record.
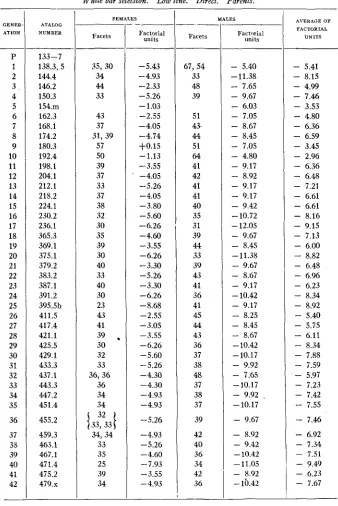
Parents of direct-line ojspring
The values of the parents in each generation of the direct line are given The vertical in table 8 for the low line and table 9 for the high line.
r a a t o w I- C
frsquencles
;
t
;
? P P 2 .N P u 0 ? 2 P P P P .Nm O * b m m + C D m * N + N N N
w~ -"~ ~t oyt ~o r;> Cw ~ * a * C c n * u * Y
nabors facet m o * E : : : : b : t R g & E : $ 2 , m p m C L I: '
+ b ~ ~ w m m m * - a m
I , , , , , , , , I
FIGURE 10.-Daughters of heterozygous female (from ultra-bar X bar) X bar male arranged
in classes each with a range equal to four facets. 188 individuals. From experiment number 740. The heterozygotes (H) and bars (E) are not as well brought out as in the other method of
tabulation.
H 13
frequencies O N
-
+- 2 r ? u, N N u, C rU N OZ b b ~ ~ ~ s . r m
. . .
w-
o. . .
W m r n.
r.
n ?- e? oPl ?r r a mfactorial " ~ ? " " P P ? f P ? 6 ? ? Y ? P L
C C V r n C C C C N W
I , , ,
C C C ~ l I l l l l , , I + + + + a
values g ~ ~ g g g g g g g g g g g s ~ ~ ~ ~
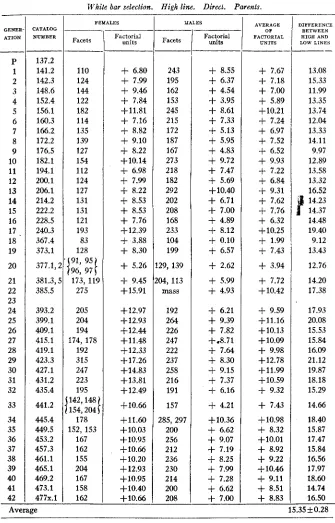
SELECTION I N WHITE BAR EYE 29 TABLE 8
White bar selection. Low line. Direct. Parents.
GENER- ATION ___ P 1 2 3 . 4 5 6 7 8 9 10 11 12 13 14 15 16 17 18 19 20 21 22 23 24 25 26 27 28 29 30 31 32 33 34 35 36 37 38 39 40 41 42 -- ATALOG NUMBER
-
133-7 138.3, 5 144.4 146.2 150.3 154.111 162.3 168.1 174.2 180.3 192.4 198.1 204.1 212.1 218.2 224.1 230.2 236.1 365.3 369.1 375.1 379.2 383.2 387.1 391.2 395.5b 411.5 417.4 421.1 425.5 429.1 433.3 437.1 443.3 447.2 45 1.4 455.2 459.3 463.1 467.1 471.4 475.2 479.x FEMALES Facets 35,30 34 44 33 43 37 31,39 57 50 39 37 33 37 38 32 30 35 39 30 40 33 40 30 23 43 41 30 32 33 36,36 36 34 3439
.
{
3?331
34,34 33 35 25 39 34 Factorial units -5.43 -4.93 -2.33 -5.26-
1.03 -2.55 -4.05 -4.74 +0.15 -1.13 -3.55' -4.05
-5.26 -4.05 -3.80 -5.60 -6.26 -4.60 -3.55 -6.26 -3.30 -5.26 -3.30 -6.26 -8.68 -2.55 -3.05 -3.55 -6.26 -5.60 -5.26 -4.30 -4.30 -4.93 -4.93 -5.26 -4.93 -5.26 -4.60
-
7.93 -3.55 -4.93 MALES Facets 67,54 33 48 39 51 4 5 44 51 64 41 42 41 41 40 35 31 39 44 33 39 43 41 36 41 45 44 43 36 37 38 48 37 38 37 39 42 40 36 34 42 36 Factorial units- 5.40 -11.38
-
7.65-
9.67-
6.03- 7.05
-
8.67- 8.45
-
7.05-
4.80- 9.17
- 8.92
- 9.17
-
9.17-
9.42-
10.72- 12.05
-
9.67-
8.45 -11.38-
9.67- 8.67
- 9.17
- 10.42
- 9.17
-
8.25- 8.45
-
8.67- 10.42 -10.17
- 9.92
- 7.65
- 10.17
-
9.92 ,-10.17
- 9.67
- 8.92
- 10.42 -11.05
- lb.42
- 9.42
- 8.92
AVERAGE O F FACTORIAL
U N I T S
-
5.41-
8.15- 4.99
-
7.46- 3.53
-
4.80-
6.36-
6.59- 3.45
-
2.96-
6.36-
6.48- 7.21
- 6.61
-
6.61-
8.16- 9.15
-
7.13- 6.00
-
8.82- 6.48
- 6.96
- 6.23
- 8.34
- 8.92
- 5.40
- 5.75
-
6.11-
8.34- 7.88
-
7.59-
5.97- 7.23
- 7.42
-
7.55-
7.46-
6.92- 7.34
- 7.51
- 9.49
- 6.23
- 7.67