DHOOT, ANUBHAV V. Hybrid online/offline optimization of application binaries (Under the direction of Assistant Professor Dr. Frank Mueller).
Biography
Anubhav Dhoot was born on 4th
Acknowledgements
Contents
List of Figures vi
List of Tables vii
1 Introduction 1
1.1 Motivation . . . 1
1.2 Hybrid Mechanism . . . 3
1.3 Outline . . . 5
1.4 My contribution . . . 5
2 Description of the Overall Architecture 7 3 Optimizing module based on VPCC/VPO 12 3.1 Background of VPCC/VPO . . . 12
3.2 Porting of VPCC/VPO to POWER architecture . . . 16
3.2.1 Front end . . . 16
3.2.2 Back End . . . 18
3.2.3 Optimizations . . . 19
3.2.4 Testing strategy . . . 19
4 PrePARC and PARC Tools 21 4.1 PrePARC . . . 21
4.2 PARC . . . 23
4.2.1 Design . . . 23
4.2.2 Issues . . . 25
5 On-the-fly Rewriting module 28 5.1 Dynamic Binary Rewriting & Dyninst . . . 28
5.2 Our Mutator program . . . 31
7 Discussion 35
8 Related Work 37
9 Conclusions and Future Work 41
List of Figures
1.1 Current Implementation status . . . 4
2.1 Overall Architecture . . . 8
2.2 Optimizations Module . . . 10
2.3 Cycle of Optimizations during execution lifetime . . . 11
3.1 VPO based Compiler Architecture . . . 13
3.2 Pseudo code for Optimizations in VPO . . . 14
3.3 File flow through a VPO Compiler . . . 15
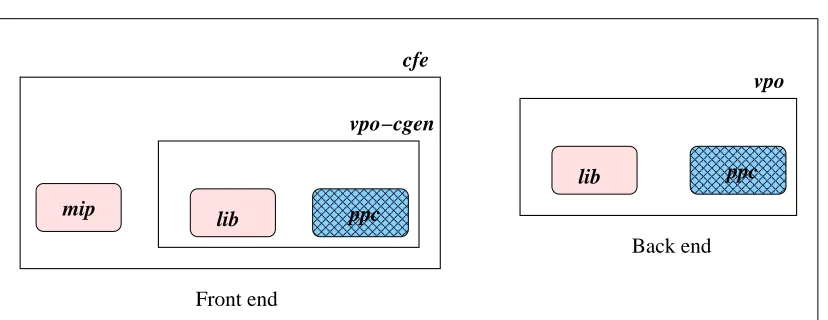
3.4 VPCC/VPO structure . . . 17
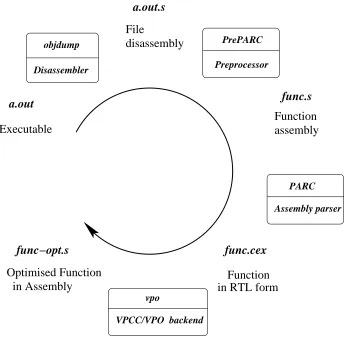
4.1 File Flow through tool chain . . . 26
5.1 Dyninst Programs Structure . . . 30
List of Tables
Chapter 1
Introduction
1.1
Motivation
Optimizations are usually applied at compile-time, link-time or post-link time. While compile time and link-time optimizations help to optimize functions consid-erably, they still leave opportunities for further improvement. This is because these optimization techniques suffer from limitations, such as lack of access to profiling data for the deployed scenario. None of these techniques can leverage current execution environment conditions. Compile-time techniques depend on availability of source code. Even though these techniques have access to a lot more information that is lost after link time, they cannot cater to code for which they do not have access to the sources, examples, pre-compiled shared libraries and mixed-language code. It is also difficult for these techniques to optimize for all possible scenarios in which the executable will be deployed.
Optimizations applied post-link time, but just before execution, eg. optimiza-tions in Just In Time (JIT) compilaoptimiza-tions [GAH+
00],[KF01], have to suffer from time constraints for applying optimizations. This is because compilation time for apply-ing optimizations would be exerted as part of the execution time, in particular, just before instructions from the application are executed.
hi-erarchy. Dynamic optimizations, i.e., post-link time optimizations performed at run-time, can provide code of higher quality because we can leverage profiling information. Optimizing at run-time can allow us to capture memory references of the entire ap-plication including pre-compiled library routines and of mixed-language apap-plications, which is crucial as numerous scientific production codes are mixed-language based. Dynamic optimizations can also cater to input dependencies, application modes and user behavior by using profile behavior that we collect from actual execution. How-ever, use of input information as part of optimizations is beyond the scope of this thesis.
There exist feedback directed optimizations schemes that use feedback to guide the optimizations applied. But these use feedback from a training input or from previous executions that may exhibit a behavior different from the current deployed scenario.
Also, dynamic optimization can be performed at idle time between execution runs or in parallel to the executing application. Hence it does not suffer from time constraints in applying optimizations.
1.2
Hybrid Mechanism
Dynamic optimizations are usually performed totally online or offline. In online schemes, a monitor program continually monitors the application and it analyzes the statistics it collects. The monitor may decide to optimize any function either by interrupting the application and optimizing the function or while the application continues but using the same shared hardware resources, such as the processor and cache. Both steps add a considerable overhead to the application execution that needs to be recouped from the benefits obtained from optimizations. Offline schemes typi-cally collect profiles from either training runs or previous runs. When the application finishes an execution run, the optimizing module will apply optimizations and use the optimized code during the next execution. We use a hybrid mechanism described below that enables us to optimize code without requiring that the application be restarted.
Executing application
Rewritten Executing application
a.out Bottleneck (func)
Profile Instrumentation Profile
Analyser Instrumentor
Profiling and Analysis module
Optimizations module
func−opt
Rewriting module
Dyninst based Rewriting tool
Dependancy Analyser
Parallel Optimizer
PARC tools VPO Port
Existimg
Unimplemented My contribution Legend : Modules
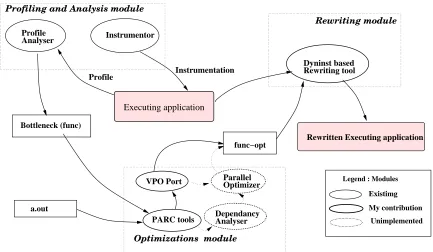
The current state of the implementation is shown in Figure 1.1. The preexisting profiling and analysis module was developed in our group before. This allows us to collect memory statistics from an executing application. Currently, we have designed and implemented two major modules. The first, termed optimizing module, contains components (VPO and PARC tools) that enable us to apply scalar optimizations to a function from an executable format. The other, termed as rewriting module, enables us to rewrite an optimized function into an executing application. The missing link is a component in the optimizing module to enable us to apply parallel optimizations. This requires another component that derives loop and data-dependence information from the executable. Once the optimizing module is complete, we can automate various transformations to optimize resource-intensive parallel applications.
1.3
Outline
This thesis is organized as follows. I will describe the Overall architecture in section 2. I will then describe issues about the design and implementation of various modules. First, I describe the model of VPCC/VPO [BD94, BD88], the optimizing compiler on which the optimizations module is built. I describe issues we encountered in porting the compiler to the POWER architecture, i.e., the architecture on which we are implementing our framework. I will then describe the design and issues with the implementation of the PARC (Power Assembly to RTL Converter ) tools that convert POWER assembly to intermediate format that can be fed into the compiler VPO. I also describe various related tools and the tool chain that leads to an optimized function from the executable. I will lastly describe the dynamic binary rewriting tool that enables us to hot-swap functions without requiring us to restart the application.
1.4
My contribution
Chapter 2
Description of the Overall
Architecture
There are 3 major modules in our architecture - the profiling and analysis module, the optimizing module and the rewriting module.
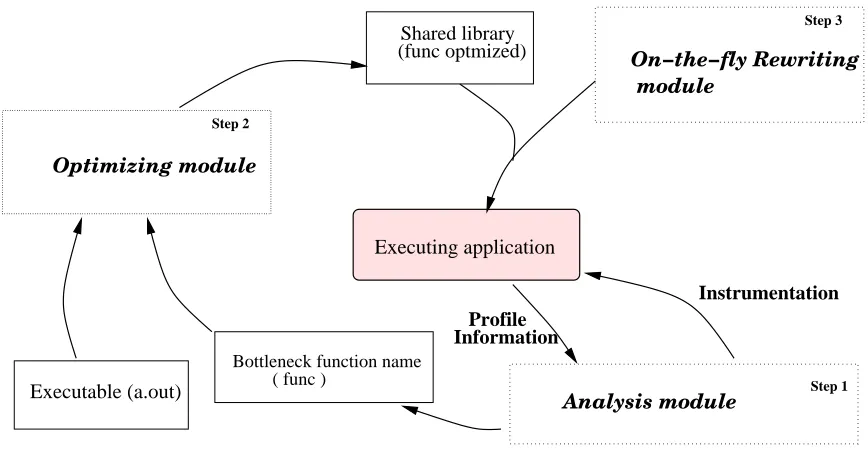
The overall architecture is shown in Figure 2.1.
The entire optimization cycle being described can be performed periodically during different phases of the application execution. Each cycle consists of the following steps. The profiling and analysis module first determines the bottleneck function of the current execution phase of the application. In order to identify the bottleneck function, we examine the current execution profile that will provide insights on the memory behavior. To build the execution profile for the current phase of execution, we use binary instrumentation to modify the application to extract a memory access trace. Instrumentation is added for a fixed time interval and is then removed.
Executing application
Step 3
Step 1
Executable (a.out)
Bottleneck function name ( func )
Shared library (func optmized) Optimizing module On−the−fly Rewriting module Analysis module Profile Instrumentation Information Step 2
Figure 2.1: Overall Architecture
Next, the profiling and analysis module is briefly described.
We add profile-generating instrumentation to the executing executable via binary rewriting in order for it to generate memory statistics. We interrupt the application to rewrite the executable in order to add instrumentation. We then let the application continue. After the statistics are generated, the application is interrupted to remove the profiling instrumentation. The application is then allowed to continue again without any instrumentation. The profiling step is online while the analysis can be performed offline, i.e., in parallel on disjoint hardware resources while the application continues. The analysis step, thus, does not add any execution overhead.
We leverage previous work of our group via the METRIC framework described in detail in [MM02] and [MM03]. METRIC determines memory inefficiencies by exam-ining traces. It extracts partial traces via binary rewriting. It uses online compression of memory traces and offline cache simulations that enables it to pinpoint memory performance bottlenecks without much overhead to the executing application.
The optimizations module contains the following components as shown in Figure 2.2.
The PrePARC and PARC tools extract the bottleneck function (func) from the executable and convert it into an intermediate format. The function in intermedi-ate format is provided to the optimizer based on VPO. PARC is a parser of POWER assembly, whose output is in the format accepted by VPO. The PrePARC tool prepro-cesses the disassembly of the linked executable, that is obtained from the disassembler. We use the objdump tool, part ofbinutilstoolset for AIX, as the disassembler.
In brief VPCC/VPO is an optimizing compiler that translates source code to a machine-independent intermediate format. The intermediate format, termed as RTL (Register Transfer Lists) [Ben91], indicates assembly instructions as register transfer operations. VPCC/VPO performs optimizations repeatedly on the RTL format and ultimately converts the RTLs to assembly form. VPCC/VPO performs a set of scalar optimizations. An optimizer module, that is beyond the scope of this thesis, needs to be implemented. It will perform parallel optimizations, on loops and arrays. This would, in turn, require loop and data dependency information to be collected from the executable, another aspect of future work.
After all optimizations are applied, the optimized function code is generated in the form of a shared library. The rewriting module then modifies the executing application, adding the shared library and modifying the executable, to utilize the optimized version of the function from that point on. The optimizing module executes offline, on disjoint hardware resources, e.g., a separate processing node, and in parallel while the application is still executing. This prevents overhead from being added to the application.
un-VPO Parallel optmizer
(func optmized) Shared library
RTL (func.rtl)
Dependancy Analyzer
Executable (a.out)
Bottleneck function name ( func )
gcc Optimizing module
xlc vpcc
xlf
PARC tools
. . func . . func . . func a.out imized func opt−
Offline
Online
Analysis
Optmizations
Rewriting
Profiling
* − With profiling instrumentation
. . func a.out Shared library a.out a.out*
Figure 2.3: Cycle of Optimizations during execution lifetime
conditional jump to func optimized. To obtain the addresses of both functions, we exploited the Dyninst API. The rewriting module then detaches from the application and lets it continue. Thus, this online step with respect to the program’s execu-tion adds only insignificant overhead. The rewriting module using Dyninst will be explained in detail later on.
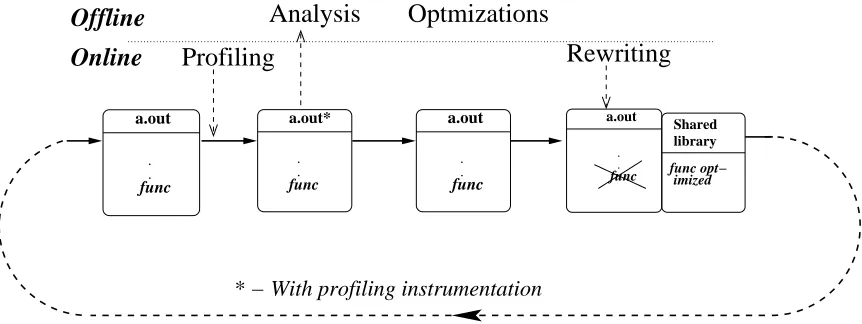
This ends the cycle of optimizing one function in the executing application. To summarize, the lifetime of an application goes through the cycle shown in Figure 2.3.
Chapter 3
Optimizing module based on
VPCC/VPO
3.1
Background of VPCC/VPO
VPCC/VPO is an optimizing compiler transforming code on machine and lan-guage independent representations, yet including machine specific instructions. This allows it to be machine and language independent but still be able to handle machine-specific features. All code improvements are applied to a single low-level representa-tion.
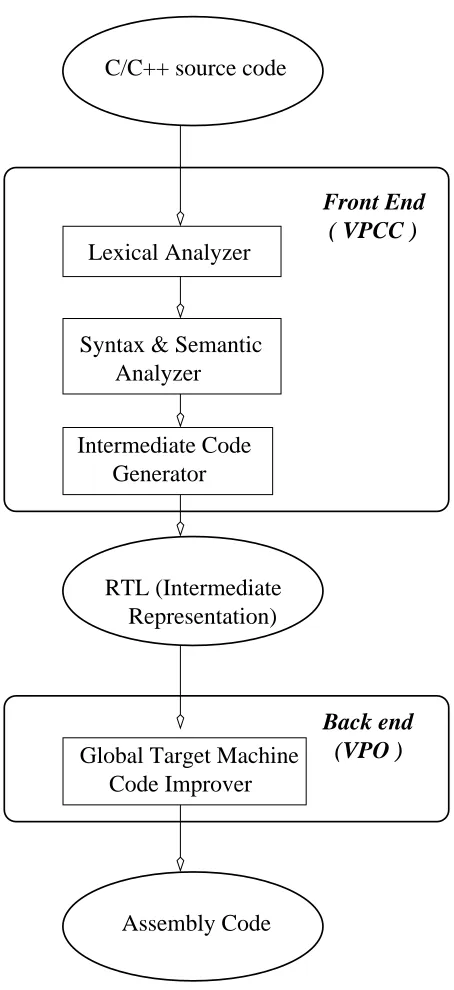
The overall organization of VPCC/VPO is shown in Figure 3.1.
The optimizing compiler is divided into a front-end and a back-end and uses an intermediate language representation in between. The intermediate language repre-sentation is in the form of sets of register transfers named as RTL format, [Ben91]. Example of assembly and the corresponding RTL representation :
assembly : lwz 2,32(1) RTL : +r[2]=R[r[1]+32]
C/C++ source code
Assembly Code Global Target Machine Code Improver
Back end (VPO )
Lexical Analyzer
Syntax & Semantic Analyzer
Intermediate Code Generator
Front End ( VPCC )
RTL (Intermediate Representation)
procImproveis BuildControlFlowGraph() ControlFlowTransformations() SetLocalLinks() InstructionSelection() EvaluationOrderDetermination() BuildDominatorTree() FindDominanceFrontiers LiveVariableAnalysis() BuildMinimalSSAForm() SetGlobalLinks() InstructionSelection() LiveVariableAnalysisUpdate() if LocalRegisterAssignment()then endif FindLoops() EstimateExecutionFrequency() do while C InstructionSelection() LiveVariableAnalysisUpdate()
if ColorLocalVariables() then
endif
while C
C = False
A = DeadVariableElimination()
C = InstructionSelection() A = True
if A then
endif
LiveVariableAnalysisUpdate()
C = CommonSubexpressionElimination() do
A = False
C = C || LoopTransformations() C = C || InstructionSelection() C = C || InlineFunctions()
C = C || DeadVariableElimination()
ControlFlowTransformations() Insert FunctionPrologueandEpilogue() InstructionSelection()
InstructionScheduling()
endproc
Figure 3.2: Pseudo code for Optimizations in VPO
The intermediate representation makes the front-end target independent so that it can be used for a variety of target architectures with as little modification as possible. The low-level representation consists of RTLs. The RTL representation is supplied to VPO through a file interface.
The pseudo code for steps carried out during optimization is shown in Figure 3.2.
Source .c
C preprocessor
cpp .s
Assembly RTL
.cex .i
High Level
frontend backend
VPCC VPO
Figure 3.3: File flow through a VPO Compiler
selection is performed. Analysis to build Static Single Assignment(SSA) is performed next, followed by global data flow analysis. Then, instruction selection is re-invoked. At this point, local register allocation is performed. If new hardware registers are allocated, instruction selection is redone
Then loop information is collected. After this, a loop of improvements are ap-plied until the code converges. This includes improvements like common subexpres-sion elimination, loop transformations (induction variable elimination, loop unrolling, ...etc.). After the code converges, control-flow transformations are invoked. Then pro-logue and epipro-logue code for the function is generated, and a final pass of instruction selection is performed. If required, an instruction scheduling stage is invoked. Op-timizations can be selectively enabled or disabled using command-line options with VPO.
The flow of files through VPCC/VPO is shown in Figure 3.3.
First, the C source code is input to a C preprocessor, such ascpp. The preprocessor generates the source in an intermediate format. The intermediate file is given to the VPCC front-end. The front-end generates the file in an encoded form of the RTL representation. This file can be given to the back-end, VPO. VPO generates optimized assembly code for that program.
3.2
Porting of VPCC/VPO to POWER
architec-ture
We implemented two distinct modules: A front-end component that translates the high-level representation to RTL form and a back-end component that translates from RTL to assembly form. The high-level representation is obtained by preprocessing the source code by using any C macro preprocessor.
VPCC/VPO has a very modular structure. It is structured to facilitate porting to a new architecture. The front-end, VPCC, has a machine-independent component calledmip, which performs lexical, syntactic and semantic analysis. It has a code gen-erator component called vpo-cgen that generates output in RTL form. vpo-cgen con-tains a machine-independent component called lib and separate machine-dependent components for each architecture (eg., for PowerPC it is called ppc). We utilized a version of the VPCC/VPO C compiler for PowerPC architecture that was incomplete. Thus, we had to change the machine-dependent code in order to port the compiler to the POWER architecture. This required changes to the front-end as well as the back-end. The structure of VPCC/VPO is shown in Figure 3.4.
3.2.1
Front end
VPCC uses ART (ASCII Register Transfer) files to generate the RTLs. ART is code embedded by the compiler writer in C source code that facilitates the design and implementation of transformations to generate RTLs by making such code more readable. The language preprocessor, called RTLPREP, translates ART statements into C. There are ART files for all structure elements of the C source code. In the following, the list of ART files is provided:
• branch.art: conditional and unconditional jumps
• call.art: calls
ppc ppc mip lib vpo−cgen cfe lib vpo
Machine dependent component Machine independent component
Front end
Back end
VPCC/VPO
Figure 3.4: VPCC/VPO structure
• func.art: function declarations, argument and local declarations and return
values
• field.art: field manipulations
• global.art: global declarations
• init.art: build initialization expressions
• op.art: binary and unary operations
• switch.art: switch statements
• stmt.art: manipulation of internal register stack for the front-end
• struct.art: structures
In call.art, we had to provide the means for passing arguments to the callee. We used the POWER Assembly Manual [IBM01] as a basic reference. It specifies a fixed set of general-purpose registers (GPRs) and floating-point registers (FPRs) to be used for passing integer and floating-point arguments, respectively. But we found that by restricting ourselves to such conventions, we were failing a test case when we compiled the caller with vpcc and callee with the native compiler, xlc. When we compiled the caller with xlc, we observed that the generated code saved the 8 bytes of the floating-point representation of each floating point argument in 2 GPRs along with its corresponding FPR (each GPR is 4 bytes long as compared to 8 bytes for FPR). Hence, we emitted code to save the bit representation of the floating-point arguments in GPRs.
In stmt.art, floating-point constant values were originally declared using the .dou-ble assembly mnemonic. The floating-point value was generated in the instruction using printf. The value was truncated depending on the formatting string passed to printf. We found this precision error while debugging a test case. We resolved this problem by declaring space for raw bytes representing the floating-point bit pattern using the .long mnemonic. Conversion from integer to floating-point values was also incomplete. We observed the code generated by xlc created the bit pattern arith-metically from the integer value. We emitted RTLs to generate the same conversion code.
3.2.2
Back End
generated in a callee. We used the assembly manual to properly prepare for function entry and exit points. We had to generate code to find registers to be saved and then generate RTLs to save them. We found that assembly code generated by xlc contained instructions to save registers on stack even for register arguments. This is utilized to store the floating-point value representations from the GPRs to the stack space and then perform a floating-point load from that location.
3.2.3
Optimizations
The optimizations in the backend enable us to apply scalar optimizations. In future work, we will implement the component that enables us to apply parallel optimizations based on data dependency and loop information. This would reflect the true benefits of applying dynamic optimizations. Hence, we do not report the measurements of performance gain of applying optimizations using our optimizations module in the current state. We do report results for dynamically utilizing hand-optimized code to an executing application via our rewriting module.
3.2.4
Testing strategy
Chapter 4
PrePARC and PARC Tools
The PrePARC and PARC tools are a set of tools that extract a function from an executable and convert it into RTL form. The PrePARC tool extracts a named function from the disassembly listing of the executable and processes it. PARC takes as input the preprocessed assembly instructions for the function from PrePARC and generates corresponding RTLs.
4.1
PrePARC
The PrePARC tool accepts the disassembly of an executable and the name of the bottleneck function provided by the analysis module. It extracts the function in assembly form and processes it as explained later. The PrePARC tool is written in Perl.
As a first step, PrePARC finds the start of the function in the executable disas-sembly by locating a label containing the function name. Objdump, the disassembler we used, indicates the start of each function by a label containing the function name and the end by an empty line. The tool stores the function disassembly in a vector in the program for later processing.
target locations. We had to distinguish between jumps and calls as both have a similar representations in the disassembler format:
call ==>10000170: 48 00 01 99 bl 10000308 <. mod init>
jump ==>1000017c: 41 8a 00 1c beq 2,10000198 <. start+0x70>
The format above is
”address” : ”raw bytes for instruction” ”mnemonic form”<”target location in
read-able form”>
Thus, a call can occur only to the start of some function while the target of a branch can occur anywhere within the function at some offset indicated by the plus ”+” sign as part of the last field in the disassembly line. Hence, the existence of a plus sign indicates a branch. The target is the last operand of the instruction. We find all branch instructions and their target address values and in every branch instruction, we replace the absolute address from the target with a unique label generated for that offset. An easy way to generate a unique label is to encode the offset value. We modify the jump in the example above into the following instruction:
1000017c: 41 8a 00 1c beq 2, LABEL 0x70
By processing all jump instructions in the first pass, we store all labels that need to be defined and their locations. In the next pass, we prepend labels to the target instructions. Finally, as a last pass, we remove extra fields from each disassembly statement so that just the assembly instructions remain.
4.2
PARC
PARC is a parser of POWER assembly based on lex [Les75] and yacc [Joh79] compilation tools. Its input is the preprocessed assembly listing of a function obtained from PrePARC and its output is the function in RTL format.
4.2.1
Design
Alexdescription for POWER assembly was developed along with ayaccgrammar whose action-rules generate RTLs corresponding to the assembly statements. Thelex specification was written by using the POWER assembly manual as a reference. The
lex specification lists all rules for various mnemonics first. POWER and PowerPC assembly can be used interchangeably for a significant part of the instruction set. Thus, in thelexspecification we combine alternate (POWER and PowerPC) forms of a mnemonic into the same token. Thus, fma and fmaddare both converted into fma for floating-point addition. Whenever a pseudo-op is seen at the start of a line, the entire line before the newline is returned as a DIRECTIVE token. These are followed in the specification file by rules defining NEWLINE, FUNCNAME and SYMBOL. A FUNCNAME is essentially a SYMBOL preceded by a dot. This is to identify the start of the function assembly to generate a proper function header that contains assembly pseudo-ops like .globl and a .csect. This is data required by the assembler to ensure correct translation. These rules are followed by rules for all numeric constants. We convert all octal, binary and hex numbers into decimal numbers before we process them in PARC, as only decimal numbers are accepted by VPO. These rules are followed by rules specifying a STRING. Various other operators return their identity as tokens. This is followed by empty rule for whitespace and finally a catch-all rule with a do-nothing action for all other characters.
assembly statements:
• load, store, immed(immediate mode operations), binop, compare, uncondbranch,
condbranch, condbranchlr (conditional branch to target present in the link reg-ister), move (for movement to and from special registers).
All DIRECTIVEs are classified as POWER assembly statements and are emit-ted as RTLs containing assembly statements by prepending the statement with a ’-’ character. A ’-’ character at the start indicates to VPCC that this RTL contains an assembly statement that needs to be emitted without further processing. Two groups of operands are used:
• twoconstant, which contains two operands named as source and destination.
• basedisplacement, which contains three integer operands termed as destination,
base, and displacement.
All loads and stores use basedisplacement or base16bitdisplacement, where the lat-ter is equivalent to basedisplacement with an additional check to confirm that the displacement does not exceed 16 bits. This is for instructions that require the dis-placement operand to be limited to a 16 bit value. In immed statement, we handle CISC-like instructions such as xoriu ( ”xor immediate a 16 bit value with the upper 16 bits of the source register and place it in a destination register”). These have no corresponding RTL statements and are converted into a set of RTLs having the same effect. For example, xoriu becomes ”store immediate value in a temporary register, xor registers, followed by shift left by 16 bits and place the result in the destination”. These multiple RTLs may use temporary registers that will be ultimately assigned by the register allocator in VPCC. Later, a peephole pattern in VPO will detect these sets of statements and convert them back to the complex instruction. By not denoting them explicitly, we reduce the complexity of the subset of RTLs accepted as input to VPO. In branch statements, we encounter various extended mnemonics. These are mnemonics that imply a base mnemonic and specific values for operands. For example,
bc 4,0, <target address>
where bc is branch on condition, 4 indicates branch if the condition bit is false and 0 indicates that the condition bit to be checked is the less-than bit. Also, a call instruction is similar to a jump where the link register bit in the instruction is set. For calls, we needed to generate associated RTL lines including RTLs indicating used and trashed registers.
4.2.2
Issues
In the existing PowerPC version of branch.art, the comparison-and-branch model had a single RTL line for comparing two registers and branching conditionally to a target. These were converted by the back-end into 2 assembly instructions. The first instruction sets a bit in the Condition Register and the second instruction branches conditionally depending on the bit set to the target label. While looking at the disassembly in the PARC tool, we would need to combine those 2 assembly statements together into one RTL. That would require us to remember the last comparison made prior to the branch instruction to generate the combined RTL. We changed the RTL model to split the original RTL into separate comparison and branch RTL statements. For this, a condition register was introduced in the register model in the POWER back-end of VPO. This register is set in the comparison instruction. In the branch instruction, the type of comparison used in the RTL would reflect the bit encoding from the original assembly instruction for the bit that is checked for making the jump decision.
For example, if the assembly instruction were
bc 12,0,Here - ( Jump to Here if less than bit is set)
This would be translated to the following RTL: +PC=CR<1,Here
where 1 is a dummy value.
Disassembler objdump
Preprocessor PrePARC
Assembly parser PARC
Executable
a.out
disassembly File
a.out.s
Function assembly
func.s
func.cex
Function in RTL form
func−opt.s
Optimised Function in Assembly
VPCC/VPO backend vpo
Chapter 5
On-the-fly Rewriting module
In this chapter, we discuss the design of the rewriting framework. First, we give a background on dynamic binary rewriting in brief. We then describe the dynamic binary rewriting API used. Finally, we describe our rewriting module that enables us to hot-swap a function while the application is executing.
5.1
Dynamic Binary Rewriting & Dyninst
Binary rewriting refers to post-link time modification of an executable, i.e., modifi-cation of the applimodifi-cation’s binary representation before executing the program [SW92]. Binary translation, on the other hand, represents the process of modifying the instruc-tions or the data of an application while its executing [BDB00]. Examples include Transmeta’s Code Morph project [CSG+
97] that allows x86 programs to run on low-power VLIW Crusoe processors. Dynamic binary rewriting is a combination of these techniques that uses a control process to rewrite the binary representation of an exe-cuting process. Dynamic binary rewriting is used because of its following advantages:
• It can capture memory references of the entire application, including those of
• It can accommodate mixed-language applications, which is crucial as numerous
scientific production codes use a combination of different source languages.
• It also provides potential to use runtime information to optimize for input
de-pendencies, application modes and user behavior. These provide opportunities to yield performance gains beyond static code optimization without profile-guided feedback, though this will be considered only in future work.
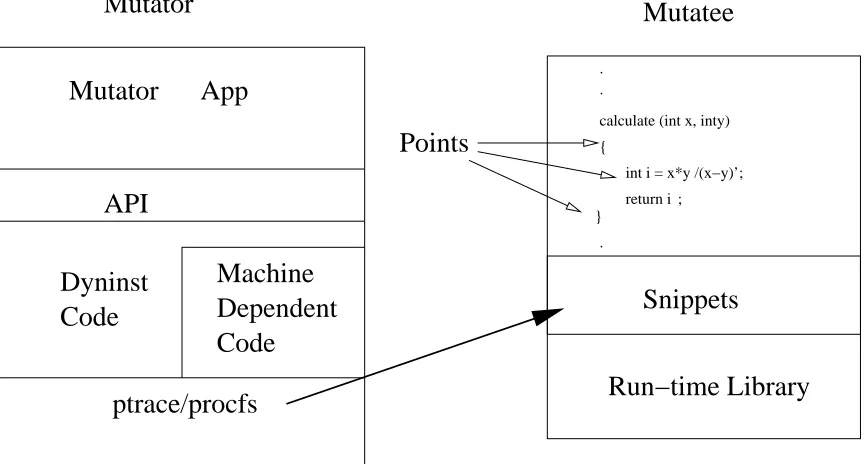
We use Dyninst to apply dynamic binary rewriting. Dyninst [BH00] is a C++ API that permits instrumentation and modification of an executing application. It allows machine-independent binary instrumentation programs to be expressed. Dyninst is based on abstractions of a program and its state while in execution. The two pri-mary abstractions are points and snippets. Point is a location in a program where instrumentation can be inserted. A snippet is a representation of instrumentation code to be inserted at a point in a program. For example, to count the number of times a function is called, we can insert instrumentation at the entry point of the function, which increments a counter. The first instruction of the procedure is the “point”. A “snippet” is used to create the statement to increment the counter. Snip-pets can include function calls, expressions and loops. The overall structure of code instrumentation is shown in Figure 5.1.
There are two processes - the mutator (containing Dyninst API calls) and the mutatee (the executing program to be dynamically rewritten). The mutator also contains the runtime compiler and the utility routines to manipulate the application process. The mutatee, as shown on the right side of the figure, contains the original code in the top half of the figure. The bottom half contains the snippets that are inserted into the program as well as the runtime library that implements the Dyninst API. The API is based on following classes:
• BPatch thread is used to control code in execution (start, stop or terminate
threads). It allows one to insert instrumentation code in the program.
• BPatch image represents the program executable.
Snippets
Mutatee
Run−time Library
{
}
int i = x*y /(x−y)’;
return i ; .
.
.
calculate (int x, inty)
Points
Mutator
Mutator App
API
Code
Dyninst
Machine
Dependent
Code
ptrace/procfs
//1. move r0 to ctr register
//2. branch to ctr (bcctr), fixed hex pattern
//3 Write the instruction array at address beginning at the function entry point of the old function.
//4 Get a thread object by attaching to the process
//6 Find function objects for the old and new function names
//7 Get process call stack
//10 Detach from the application and exit
//11 Call function myreplace with addresses of the old and the new functions
//12 Detach from the application and let it continue
Main function ( /* Accepts the name of the executable,the process id of the application, the names of the bottleneck and the optimized function*/
}/* end main */
//5 Load the library containing the optimized function in the process address space
//8 For every function on the stack, store the program counter and execute step 9.
//9 Check if the Program counter is within the address range which will be overwritten. If yes goto step 10
Function replace (/* takes as input the address of the old and new function*/) {
//0.Write in the first location of the instruction array, loading into register r0 the address of the new function
}//end func
Figure 5.2: Mutator Program
• BPatch point is a location in the code where the library can insert
instrumen-tation. Points can be described symbolically, eg., as the start of a function or by providing a virtual address.
5.2
Our Mutator program
A brief outline of our mutator program is shown in Figure 5.2.
execution instance followed by the name of the unoptimized function and the name of the optimized version of the function. In line 4, we obtain a Dyninst thread object, which acts as a handle to the executing application. This is achieved by a Dyninst call that attaches to the application, identified by the process id and the executable name, and interrupts it. The thread object is later used to insert instrumentation. In line 5, we load the shared library containing the optimized version of the function in the application’s address space. In line 6, we obtain Dyninst function objects for the unoptimized (old) function and the optimized (new) function versions. These objects are used to get the function start addresses passed in line 11 to function
Chapter 6
Validation Experiments
We demonstrate, in the absence of our optimizing module to include parallel optimizations, the capability of dynamic binary rewriting to obtain considerable per-formance improvements.
We use five synthetic application benchmarks. In each benchmark, we execute a function multiple times. Initially, we let the unoptimized version of the function execute. We then run our mutator program to modify the application such that calls to the original function lead to the newly optimized function code. Each time the wall clock time obtained in the last call is reported.
The first two benchmarks were obtained from [MM03].
The first benchmark performs matrix multiplication in the function. The original executable contains a function with a simple matrix multiply loop for a matrix of dimensions 800 by 800. The optimized version of the same matrix multiply function uses tiling [WL91, Wol89].
The second benchmark performs Erlebacher ADI integration. The optimized ver-sion of the function is obtained by applying loop interchange and loop fuver-sion.
The third benchmark performs encryption/decryption using Skipjack [Nat98]. The optimized version of the algorithm uses loop unrolling and data-layout modifi-cation. The third benchmark was obtained from implementations by Mark Tillotson
<[email protected]> and Paul Rissanen<[email protected]>.
Table 6.1: Proof-of-concept Experiment data
Benchmark Mean time per call (sec) Standard Deviation(sec)
Matrix Multiplication Unoptimized 33.0000 0.0000
Optimized 12.6667 0.5773
Erlebacher ADI Unoptimized 6.2733 0.0493
Optimized 0.4367 0.0058
Skipjack Unoptimized 0.1067 0.0058
Optimized 0.0200 0.0000
Linpack Unoptimized 0.3687 0.0015
Optimized 0.2500 0.0010
fm-part Unoptimized 0.0207 0.0006
Optimized 0.0120 0.0010
by applying common subexpression elimination.
The fifth benchmark is a test case from our regression test suite named fm-part, which is a hypergraph partioning program. The optimized version was obtained by compiling it with all optimizations available.
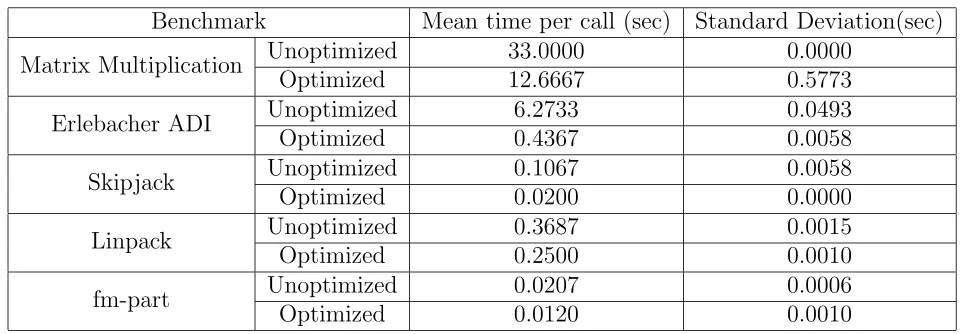
The mean execution timings are shown in the Table 6.1. Thus, we see potential for considerable improvements in performance of up to an order of a magnitude using dynamic optimizations.
The time taken for the rewriting step over all experiments had a mean value of 502.91 milliseconds and a standard deviation of 3.08 milliseconds. Thus the execution overhead of rewriting can be recouped over the entire execution duration when savings for calls to the optimized function are accumulated.
Chapter 7
Discussion
We discuss various benefits and limitations in our approach in this section. We use dynamic optimizations to improve performance of executing applications and mainly target long-running parallel applications. Optimizations are applied to the code from the executable form without any dependence on the source code. Thus, we can target precompiled library code as well as mixed language code. But this means we need to derive high-level information that is easy to derive from the source code. In order to apply parallel optimizations, we need to derive loop and data dependence information from the executable. This is a difficult problem that needs to be solved. The tradeoff between benefits and costs of applying dynamic optimizations needs to be considered. In dynamic optimizations, the execution overhead costs of applying optimizations needs to be recouped by the performance gains of applying optimiza-tions. We derive performance statistics by modifying the application to generate memory access statistics. This adds a small amount of execution overhead that we minimize by a number of ways. We use binary manipulation to add profile-generating instrumentation and then remove it after a period of time so that the extent of time that the application suffers execution overhead is small. We also analyze the statistics offline to avoid any further overhead. We interrupt the application to add optimized code and modify the application to make it utilize the optimized code. The execution overhead this step adds is insignificant.
Chapter 8
Related Work
Dynamo [BDB00] is based on dynamic compilation. It has a staged compilation model for achieving lightweight and heavyweight optimizations where different mod-ules of the input are compiled into various levels of representation. Higher-level repre-sentations are used for modules that would benefit from “heavyweight” optimizations and decreasing levels are used for optimizations with decreasing costs. Dynamic opti-mization using edge-counting profiling is available. Like our scheme, it uses profiling only for a portion of the program run. Their primary focus is virtual machines.
over optimizations applied to same library for a different application. This is another case for dynamic optimization.
OM [SW92] has a similar approach to ours that it takes as input an executable, builds the intermediate RTL format and then applies optimizations before generating object code. However, all steps are executed offline such that optimizations are per-formed between two execution runs. Also, they do not collect any profile to decide which functions need to be optimized.
The PLTO (Pentium link time optimizer) from the SOLAR project [SDA01] also uses binary rewriting to optimize procedures, but it performs optimizations online. It first collects an execution profile on training input and then optimizes the execution disassembly offline. The optimized program is utilized in the next execution run. We do not use training input but obtain profile information from actual execution. The authors report large speedups in integer programs that indicates potential for code optimization in statically optimized compiled code.
Mojo [CLCG00] targets dynamic optimization for a CISC (x86) architecture with support for large multi-threaded desktop applications that use exception handling. It counts the frequency of execution to identify hot-spot functions. These are then disassembled and optimized online. There is a controller thread that decides where program control should be transferred depending on whether optimized code exists or not. The performance gain observed was not significant. One reason could be the large execution overheads for the entire process being online.
Jalape˜no [GAH+
performed online, which increases the cost of optimization. Similar to many other sys-tems, it uses a cost-benefit analysis to decide whether a module needs recompilation with additional optimizations.
Strata [SD01] is an infrastructure for building software dynamic translators that can be re-targeted easily and be flexible enough to enable performance improvement as well as meet other objectives such as the construction of instruction-set simulators [CK93] or low-cost simulation of new OS or architecture features [Dit00], [UC00]. It is organized as a virtual machine where Strata itself examines and translates instructions before they are executed on the host machine. It can examine windows of instructions called fragments that can potentially span across function calls. Strata can implement optimizations like instruction scheduling.
The Morph system [CSG+
97] provides a framework for the automatic collection and management of profile information and application of profile-driven optimiza-tions. It uses an operating system kernel component that implements continuous, low overhead profiling and program monitoring. Similar to our approach, they sep-arate the analysis of a profile collected in an offline manner, but, unlike ours, they collect profile information continuously. There is a compiler component that imple-ments re-optimization and, similar to our approach, it does not require source code.
Digital’s FX!32 [CH01] is similar to Morph in that execution profiles of x86 Win32 applications are continuously collected and fed to a background process that translates the previously emulated portions of x86 binaries into native code transparent to the user. But it collects profile samples during program emulation and it focuses on code translation than code optimization.
Dyninst [BH00] is a C++ based API that permits the insertion of code into a running program. The goal of this API is to provide a machine independent inter-face to permit the creation of tools and applications that use runtime code patching. Applications that can make use of this dynamic code adaptation system include per-formance measurement tools, correctness debuggers, execution drive simulations and computational steering. Dyninst is based on the idea of dynamic instrumentation technology [JKHC94] developed as a part of the Paradyn Parallel Performance Tools Project [MCC+
Chapter 9
Conclusions and Future Work
We have described various components of a dynamic optimization framework de-signed to improve performance of long running-parallel applications. We have devel-oped a framework to identify and extract functions that are performance bottlenecks, apply scalar optimizations and reinsert the optimized function in an executing ap-plication. We are able to optimize code from the binary representation. We prove a proof-of-concept of the rewriting module of our framework using synthetic bench-marks. Future work includes a component to perform parallel optimizations within the existing framework. For the same purpose, we also need to derive data flow, induction variables and data dependency information from the executable. We also plan to extend this optimization framework for distributed and shared memory exe-cution based on MPI [For94] & OpenMP [CMD+
Bibliography
[BD88] M. E. Benitez and J. W. Davidson. A portable global optimizer and linker. InACM SIGPLAN Conference on Programming Language Design
and Implementation, pages 329–338, June 1988.
[BD94] Manuel E. Benitez and Jack W. Davidson. Target-specific global code improvement: Principles and applications. Technical Report CS-94-42, 4, 1994.
[BDB00] V. Bala, E. Duesterwald, and S. Banerjia. Dynamo: A transparent dy-namic optimization system. InACM SIGPLAN Conference on
Program-ming Language Design and Implementation, pages 1–12, June 2000.
[Ben91] M. E. Benitez. Register transfer standard. TR RM-91-01, University of Virginia, March 1991.
[BH00] Bryan Buck and Jeffrey K. Hollingsworth. An API for runtime code patching. The International Journal of High Performance Computing Applications, 14(4):317–329, Winter 2000.
[CH01] Anton Chernoff and Ray Hookway. DIGITAL FX!32 running 32-bit x86 applications on alpha NT. September 12 2001.
[CLCG00] Wen-Ke Chen, Sorin Lerner, Ronnie Chaiken, and David M. Gillies. Mojo:a dynamic optimization system. In ACM Workshop on Feedback-Directed and Dynamic Optimization, Dec 2000.
[CMD+
01] Rohit Chandra, Ramesh Menon, Leo Dagum, David Kohr, Dror Maydan, and Jeff McDonald. Parallel Programming in OpenMP. Morgan Kauf-mann Publishers, Los Altos, CA 94022, USA, 2001.
[CSG+
97] J. Bradley Chen, Michael D. Smith, Nicholas Gloy, Xiaolan Zhang, and Zheng Wang. System support for automatic profiling and optimization. July 24 1997.
[Dit00] David R. Ditzel. Transmeta’s Crusoe: Cool chips for mobile computing. In IEEE, editor,Hot Chips 12: Stanford University, Stanford, California, August 13–15, 2000, 1109 Spring Street, Suite 300, Silver Spring, MD 20910, USA, 2000. IEEE Computer Society Press.
[Don87] J. J. Dongarra. The LINPACK benchmark: An explanation. In C. D. Houstis, E. N.; Papatheodorou, T. S.; Polychronopoulos, editor,
Proceed-ings of the 1st International Conference on Supercomputing, volume 297 of LNCS, pages 456–474, Athens, Greece, June 1987. Springer.
[For94] MPI Forum. MPI: A message-passing interface. Technical Report CSE-94-013, Oregon Graduate Institute of Science and Technology, April 1994.
[GAH+
00] David Grove, Matthew Arnold, Michael Hind, Peter F. Sweeney, and Stephen Fink. Adaptive optimization in the jalapeno JVM. July 27 2000.
[HDH01] Jeffrey K. Hollingsworth, Luiz Derose, and Ted Hoover. The dynamic probe class library - an infrastructure for developing instrumentation for performance tools. June 05 2001.
[JKHC94] Barton P. Miller Jeffrey K. Hollingsworth and Jon Cargille. Dynamic program instrumentation for scalable performance tools. In SHPCC, Knoxville, TN, USA, May 1994.
[Joh79] Steven C. Johnson. Yacc: Yet another compiler compiler. In UNIX Pro-grammer’s Manual, volume 2, pages 353–387. Holt, Rinehart, and Win-ston, New York, NY, USA, 1979. AT&T Bell Laboratories Technical Report July 31, 1978.
[KF01] Thomas Kistler and Michael Franz. Continuous program optimiza-tion:design and evaluation. IEEE Transactions on Computers, 50(6):549– 566, June 2001.
[Les75] M. E. Lesk. LEX - A lexical analyzer generator. Computing Science TR, 39, October 1975.
[MCC+
95] Barton P. Miller, Mark D. Callaghan, Joanthan M. Cargille, Jeffrey K. Hollingsworth, R. Bruce Irvin, Karen L. Karavanic, Krishna Kunchitha-padam, and Tia Newhall. The paradyn parallel performance measurement tool. IEEE Computer, 28(11):37–46, 1995.
[MM02] J. Marathe and F. Mueller. Detecting memory performance bottlenecks via binary rewriting. In Workshop on Binary Translation, September 2002.
[MM03] J. Marathe and F. Mueller. Metric: Tracking down inefficiencies in the memory hierarchy via binary rewriting. In International Symposium on
Code Generation and Optimization, March 2003. accepted.
[Nat98] National Institute of Standards and Technology,(NIST). SKIPJACK and KEA algorithm specifications, 1998.
http://csrc.nist.gov/encryption/skipjack-1.pdf,
[RJLK78] D. M. Ritchie, S. C. Johnson, M. E. Lesk, and B. W. Kernighan. Unix time-sharing system: The c programming language. Bell Sys. Tech. J., 57(6):1991–2019, 1978.
[SD01] Kevin Scott and Jack Davidson. Strata: A software dynamic translation infrastructure. Technical Report CS-2001-17, Department of Computer Science, University of Virginia, 2001.
[SDA01] Benjamin Schwarz, Saumya Debray, and Gregory Andrews. Plto: A link-time optimizer for the intel ia-32 architecture. In Workshop on Binary Translation, September 2001.
[SW92] Amitabh Srivastava and David W. Wall. A practical system for intermod-ule code optimization at link-time. Journal of Programming Languages, 1(1):1–18, December 1992.
[UC00] David Ung and Cristina Cifuentes. Machine-adaptable dynamic binary translation. ACM SIGPLAN Notices, 35(7):41–51, July 2000.
[WL91] M. E. Wolf and M. S. Lam. A data locality optimizing algorithm. In
ACM SIGPLAN Conference on Programming Language Design and
Im-plementation, pages 30–44, June 1991.
[Wol89] Michael Wolfe. Iteration space tiling for memory hierarchies. In
Proceed-ings of the Third SIAM Conference on Parallel Processing for Scientific