ABSTRACT
DIA, MAHENDRA. Genotype x Environment Interaction and Stability Analysis of
Performance, and Mega-Environment Identification of Fruit Yield and Yield Components in Watermelon [Citrullus lanatus (Thumb.) Matsum & Nakai] Tested in Multiple US Locations. (Under the direction of Dr. Todd C. Wehner).
One of the major breeding objectives for watermelon [Citrullus lanatus (Thumb.) Matsum &
Nakai] is improved fruit yield. High yielding genotypes have been identified, so our
objective was to evaluate genotypes for stability of fruit yield and yield components over
diverse environments. The success of any breeding program depends on several factors,
including understanding and selection of suitable breeding and test locations. The objectives
of this study were to (i) evaluate the influence of years and locations on yield of watermelon
genotypes, (ii) identify genotypes with high stability for yield, (iii) determine whether
locations belong to a single mega-environment, or a diverse set, and (iv) rank locations based
on discriminating ability and representativeness. A set of 40 genotypes was tested over 3
years (2009, 2010, and 2011) and 8 locations across the southern United States in replicated,
multi-harvest trials. The genotypes included new vs. old releases, small vs. large fruit size,
round vs. elongate fruit shape, striped vs. solid rind pattern, resistant vs. susceptible to
anthracnose, eastern vs. western adapted, and inbred vs. hybrid type. Yield traits were
summed over harvests, and measured as marketable yield, fruit count, % cull fruit, % early
fruit, and fruit size. There were strong effects of environment and genotype x environment
interaction (GEI) on watermelon yield traits. There was a significant advantage of hybrids
over inbreds for performance of yield components and responsiveness to favorable
Crimson' and 'Legacy' would be good for development of cultivars having high yield and
stability. Two locations including, Florida and Clinton, NC were consistently represented as
key centers of two mega-environments for marketable yield, fruit count, and % early fruit.
The entire southern US should be considered one mega-environment for breeding
watermelon for fruit size. Identification of separate mega-environments in the watermelon
production region of the US has several implications for future breeding objectives and
genotype evaluation, including deployment of different genotypes in different areas for
© Copyright 2012 by Mahendra Dia
Genotype x Environment Interaction and Stability Analysis of Performance, and Mega-Environment Identification of Fruit Yield and Yield Components in Watermelon
[Citrullus lanatus(Thumb.) Matsum & Nakai] Tested in Multiple US Locations
by Mahendra Dia
A dissertation submitted to the Graduate Faculty of North Carolina State University
in partial fulfillment of the requirements for the degree of
Doctor of Philosophy
Horticultural Science
Raleigh, North Carolina
2012
APPROVED BY:
_______________________________ ______________________________
Todd C. Wehner Ralph A. Dean
BIOGRAPHY
Mahendra Dia was born in small village Dewas, close to Ajmer (district headquarter),
in Northern India on June 24, 1980. He spent his childhood in two little towns called
Gulabpura and Hurda, both in Bhilwara district, with his parents Suraj Karan Dia and Kanta
Dia. He grew up in joint family along with his sister, brother and cousins. Mahendra went to
school at Vivekananda Kendra Vidyalaya in Hurda along with his siblings and cousins from
kindergarten to high school from 1984 to 1996. In his high school he studied physics,
chemistry, mathematics and biology.
Mahendra spent his school vacations in his native village Dewas during summer and
winter where his grandparents, uncle and aunt would live and do farming. Dewas is situated
in semi-arid region of western India and foot of Aravali mountain range, which is worlds one
of the oldest mountainous range. Living in Dewas, he was able to enjoy so many things the
place has to offer including playing hiding and seeking in corn, sorghum, and pulses field;
milking goats; herding cattle; climbing mountains; and harvesting fruits from trees.
Mahendra’s love for nature and agriculture blossomed while living in his native
village Dewas and with his father who would work as Agricultural Officer for state
government. After finishing high school, he enrolled in the undergraduate program in
Agricultural Sciences at Rajasthan Agricultural University in Ajmer and always interested in
pursuing his higher studies to learn more about agriculture. In 2003, Mahendra passed All
India Entrance Examination to pursue MS in agronomy at Acharya N.G. Ranga Agricultural
University in Hyderabad, India and he was awarded by ‘Junior Research Fellowship’ by
quality of baby corn under the direction of Dr. D.S. Reddy. During his MS studies Mahendra
enjoyed cultural diversity including food, language, and life style; and made lot of new
friends there.
While working in corn field in MS degree, Mahendra had opportunity to get acquaint
him to plant breeding experiments from his colleagues research work. He was always
curious and wanted to expand his plant breeding and genetics knowledge from aboard,
particularly from the United States of America (US). For spring 2006, Mahendra got
admission from Cornel University in plant breeding program; however, he could not join
because of financial obstruction. At the same time Mahendra decided continue his studies
without break and he enrolled in fall 2006 at Tarleton State University in Texas for second
Master degree in Agricultural Sciences with major emphasis on soil and environmental
sciences. He did his research work on accumulation of carcinogenic metals in soils from
gasoline exhaust under the direction of Dr. David C. Weindorf. His graduate school taught
him so much about US education system, culture and food; and he cherished his experience
at Tarleton State University.
As Mahendra was always aspirant to learn more about plant breeding and genetics
and his professional goal was until still unfilled. From fall 2008 he started his doctoral study
in Plant Breeding and Genetics at North Carolina State University (NCSU) in Raleigh under
the direction of Dr. Todd C. Wehner. He has been working as graduate research assistant on
various projects in cucurbit breeding program. His graduate school career at NCSU not only
ACKNOWLEDGMENTS
It is my honor to acknowledge the many people who helped and inspired me during
my doctoral study over the past four years.
First and foremost I want to thank my advisor Dr. Todd C. Wehner. His expertise,
kindness, and patience are greatly appreciated and respected. He has taught me, both
consciously and unconsciously, how good plant breeding is done and to manage time in
productive way. I appreciate all his contributions of time and ideas to make my Ph.D.
experience productive and stimulating. His encouragement, guidance and support from the
initial to the final level of my Ph.D. provided me good basis to understand plant breeding.
The joy, passion and enthusiasm he has for plant breeding was contagious and motivation for
me, even during tough time in PhD pursuit.
Beside my advisor, I would like to thank the rest of my committee members: Dr.
Ralph A. Dean, Dr. Ramsey Lewis, and Dr. Huixia Wang. Their enthusiasm; inspiration;
efforts to explain things clearly and simply; and ideas for my course work and research
project, enabled me to develop an understanding of the plant breeding and genetics.
I would like to express my deep and sincere gratitude to Dr. Penelope Perkins-Veazie
at North Carolina Research Campus, Kannapolis NC; Dr. Richard Hassell at Clemson
University, Charleston SC; Daniel S. Price at Georgia County Extension, Cordele GA; Dr.
George E. Boyhan at University of Georgia, Athens GA; Dr. Stephen Olson at University of
Florida, Quincy FL; Dr. Stephen R. King at Texas A&M University, College Station TX; Dr.
Angela R. Davis at USDA-ARS, Lane OK; and Benito Juarez, Dr. Gregory E. Tolla and Dr.
research study. Without their efforts and commitments I could have not imagined having this
research done.
For this dissertation I gratefully acknowledge Tammy L. Ellington at the North
Carolina State University, Raleigh NC; Dr. Guoying Ma and Joyce O'Neal at North Carolina
Research Campus Kannapolis NC; Mark Schaffer at Clemson University, Charleston SC;
Jackie Snell at University of Florida, Gainesville FL; Desiree Koehn at Texas A&M
University, College Station TX; Cathy White and Dolores Safran at Monsanto Vegetables,
Woodland CA; and Amy Helms and Cody Sheffield at USDA-ARS, Lane OK for their
support and assistance with field and laboratory experiments.
The members of Dr. Wehner’s group have contributed immensely to my personal and
professional time at North Carolina State University. The group has been source of
friendships as well as good advice and collaboration. I am especially grateful to Tammy L.
Ellington, Adam Call, Sheen Ma and Rakesh Kumar. They ensured I was constantly engaged
and entertained along the way. In particular, Tammy L. Ellington, Hussein Tumturk and
Adam Call joked and kept thing moving during data collection in field. In later part of my
Ph.D. Shen Ma joined this fun group. My experience in Dr. Wehner’s program was also
enriched by visiting guest scholars Dr. Rajashree Prabhu, Hussein Tumturk, and Dr.
Shengping Zhang. I sincerely thank them for their help in field and greenhouse work.
My time at North Carolina State University was made enjoyable in large part due to
many friends and groups that became part of my life. I thank my fellow graduate classmates:
Santa-deadlines, and all fun we had in the last four years. I am grateful for time spent with my
roommates and friends, for our trip to Smoky Mountain and beach in North Carolina,
Virginia and South Carolina.
I thank Dr. Consuelo Arellano and Sandra Donaghy for helping me in data analysis. I
am grateful to Rachel McLaughlin for keeping me updated with graduate program.
Further I would like to extend my thanks to Monsanto for providing financial
assistance during my PhD and North Carolina State University training me as a plant breeder.
Lastly, and most importantly, I wish to thank my parents Suraj Karan Dia and Kanta
Dia for their love and encouragement. My uncle Ram Nath Dia, aunt Shakuntla Dia, and their
sons were particularly supportive. Thank you for always inspiring and caring me throughout
my life. I owe my loving thanks to my grandfather Hardev Ram Dia, though no longer with
us, and grandmother Rukhma Dia. I believe my grandfather would be proud of what I have
accomplished, if he would be with us. My grandfather’s brother Mishri Lal Dia has been very
supportive to his brother’s family all throughout his life, and deserves a special appreciation.
My special gratitude is due to my brother, my sister and their daughters Anshika Dia and
Gucchi Bhanuda, respectively, for their loving support.
I am indebted to Dia family for all their love and encouragement throughout my study
period. Without their encouragement and understanding it would have been impossible for
me to finish my studies. I specially thank Sunita Choudhary (my fiancée) for her love and
friendship. Despite the geographic distance, she is always nearby, stood with me and
I finish with thank to all my well-wishers other who helped me directly or indirectly
TABLE OF CONTENTS
LIST OF TABLES ... xi
LIST OF FIGURES ... xiii
GENERAL INTRODUCTION. Genotype stability and Location Value for Yield and Yield Components in Watermelon from Genotype x Environment Study in the Southern US ... 1
History of Watermelon Breeding and Genetics ... 2
Breeding for high yield and stability ... 4
Mega-envinment identification ... 6
Stability methods ... 7
Objectives ... 9
Refrences ... 10
CHAPTER 1. Genotype x Environment Interaction and Stability Analysis of Performance of Fruit Yield and Yield Components in Watermelon [Citrullus lanatus (Thumb.) Matsum & Nakai] Tested in Multiple US Locations ... 15
Abstract ... 16
Introduction ... 17
Materials and Methods ... 22
Germplasm and location ... 22
Plot work and Cultural systems ... 23
Data collection and traits ... 24
Data analysis ... 24
ANOVA ... 26
Genotype means (M) ... 27
Regression coefficient or slope (bi) ... 28
Deviation from regression (S2d) and Shukla's stability variance (σi2) ... 30
Kang's stability statistics (YSi) ... 31
Genotype stability ... 32
Correlation among trait mean, bi, S2d , σi2, and YSi ... 33
Conclusions ... 34
Refrences ... 36
CHAPTER 2. Value of Locations for Representing Mega-Environments and for Testing Yield of Watermelon [Citrullus lanatus (Thunb.) Matsum. & Nakai] in the US ... 51
Abstract ... 52
Introduction ... 53
Materials and Methods ... 57
Germplasm and location ... 57
Field plots and Cultural systems ... 58
Traits evaluated ... 58
Data analysis ... 59
Results ... 60
ANOVA ... 60
Discrimination ability of the test locations ... 66
Representativeness of locations ... 67
Locations with discriminating ability and representativeness ... 68
Discussion ... 68
Conclusions ... 71
Refrences ... 72
GENERAL CONCLUSIONS ... 91
Yield stability ... 91
Location value ... 92
Implications for watermelon breeders ... 93
LIST OF TABLES
CHAPTER 1. Genotype x Environment Interaction and Stability Analysis of Performance of Fruit Yield and Yield Components in Watermelon [Citrullus lanatus (Thumb.) Matsum & Nakai] Tested in Multiple US Locations
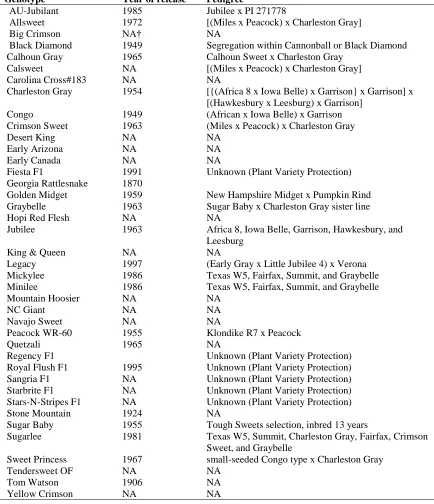
Table 1. The 40 watermelon genotypes tested. ...41
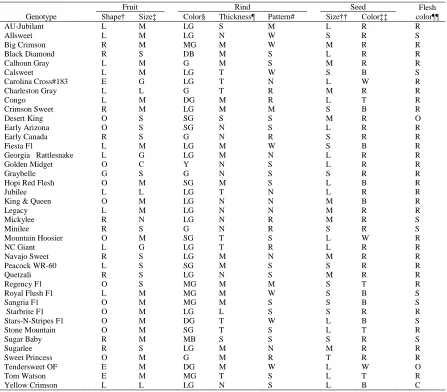
Table 2. Traits and pedigrees for the 40 watermelon genotypes evaluated. ...42
Table 3. Number of harvest done on 40 watermelon genotypes tested in 3 years
and 8 locations. ...43
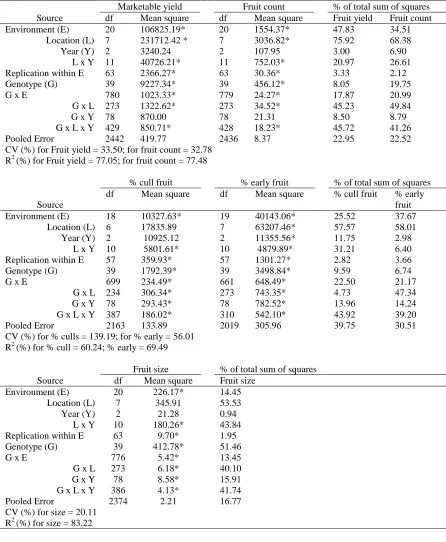
Table 4. ANOVA for marketable yield (Mg ha-1), fruit count, % cull fruit, % early fruit, and fruit size of 40 watermelon genotypes (kg fruit-1) tested in 3
years and 8 locations. ...44
Table 5. Means (corrected by least squares) and stability parameters (bi, S2d, and σi2) for marketable yield of 40 watermelon genotypes tested in 3 years
and 8 locations. ...45
Table 6. Means (corrected by least squares) and stability parameters (bi, S2d, and σi2) for fruit count of 40 watermelon genotypes tested in 3 years and 8
locations. ...46
Table 7. Means (corrected by least squares) and stability parameters (bi, S2d, and σi2) for % cull fruit of 40 watermelon genotypes tested in 3 years and 8
locations. ...47
Table 8. Means (corrected by least squares) and stability parameters (bi, S2d, and σi2) for % early fruit of 40 watermelon genotypes tested in 3 years and 8
locations. ...48
Table 9. Means (corrected by least squares) and stability parameters (bi, S2d, and σi2) for fruit size of 40 watermelon genotypes tested in 3 years and 8
locations. ...49
Table 10. Spearman rank correlation coefficients among trait mean (M) and stability parameters (bi, S2d,, σi2, and YSi) for watermelon based on 40
CHAPTER 2. Value of Locations for Representing Mega-Environments and for Testing Yield of Watermelon [Citrullus lanatus (Thumb.) Matsum. & Nakai] in the US
Table 1. The 40 watermelon genotypes tested. ...76
Table 2. Traits and pedigrees for the 40 watermelon genotypes evaluated. ...77
Table 3. Number of harvest done on 40 watermelon genotypes tested in 3 years
and 8 locations. ...78
Table 4. ANOVA for marketable yield (Mg ha-1), fruit count, % cull fruit, % early fruit, and fruit size of 40 watermelon genotypes (kg fruit-1) tested in 3
years and 8 locations. ...79
Table 5. ANOVA by year for marketable yield (Mg ha-1) of 40 watermelon
genotypes tested in 3 years and 8 locations. ...80
Table 6. ANOVA by year for fruit count (thousand ha-1) of 40 watermelon
genotypes tested in 3 years and 8 locations. ...81
Table 7. ANOVA by year for % cull fruit of 40 watermelon genotypes tested in 3 years and 8 locations. ...82
Table 8. ANOVA by year for % early fruit of 40 watermelon genotypes tested in
3 years and 8 locations. ...83
Table 9. ANOVA by year for fruit size (kg fruit-1) of 40 watermelon genotypes
tested in 3 years and 8 locations. ...84
Table 10. Correlation among test locations for marketable yield (Mg ha-1), fruit count (thousand ha-1), % cull fruit, % early fruit, and fruit size (kg fruit
-1
) of 40 watermelon genotypes tested in 3 years and 8 locations. ...85
Table 11. Standard deviation within test location for marketable yield (Mg ha-1), fruit count (thousand ha-1), % cull fruit, % early fruit, and fruit size (kg
LIST OF FIGURES
CHAPTER 2. Value of Locations for Representing Mega-Environments and for Testing Yield of Watermelon [Citrullus lanatus (Thunb.) Matsum. & Nakai] in the US
Figure 1. Polygon view of the GGE biplot based on watermelon (A) fruit yield (Mg ha-1), (B) count (thousand ha-1), (C) % culls, (D) % early, and (E) size (kg fruit-1) of 40 genotypes tested in 3 years and 8 locations.. ...88 Figure 2. The vector view of the GGE biplot based on watermelon (A) fruit yield
(Mg ha-1), (B) count (thousand ha-1), (C) % culls, (D) % early, and (E) size (kg fruit-1) of 40 genotypes tested in 3 years and 8 locations.. ...89 Figure 3. Comparison of all locations with the ideal location for watermelon (A)
GENERAL INTRODUCTION
GENOTYPE STABILITY AND LOCATION VALUE FOR YIELD AND YIELD COMPONENTS IN WATERMELON FROM GENOTYPE X ENVIRONMENT
STUDY IN THE SOUTHERN US
Mahendra Dia and Todd C. Wehner
Department of Horticultural Science, North Carolina State University, Raleigh, NC 27695-7609
History of watermelon breeding and genetics
Worldwide, the United States (US) is the fifth largest producer of watermelon
[Citrullus lanatus (Thumb.) Matsum & Nakai], with 2 million Mg harvested on 21,450 ha in
2007, valued in excess of $476 million dollars (FAO, 2010; USDA, 2010). Watermelons are
grown in most states of the United States (US). However, the major producers are in the
South and West, including Florida, Texas, Oklahoma and California, where the long
frost-free warm season lasts longer (Wehner, 2008).
Watermelon production in the US is highly seasonal, peaking from May through
August and declining through December. Florida is the only domestic source of watermelons
from December through April. Florida growers harvest watermelons during virtually every
month. However, the peak harvest occurs during May, June, and early July. Watermelon
production season in the US begins from Florida, followed by output from Arizona, Texas,
California, and the southeastern and south-central states (USDA-Economic Research Service,
2011).
Although Florida, California, Texas, and Georgia are the leading
watermelon-producing states, accounting for two-thirds of US output; watermelon is grown from
south-eastern, south-central to western states across the US. In 2010, it was grown in at least 20
states of the US (USDA-Economic Research Service, 2011).
Watermelon breeding has been practiced during the last three centuries in the US.
However, formal watermelon breeding in the US did not start until the late 1800s. By 1900,
1800s and early 1900s, the watermelon market became more established, and resistant
cultivars were developed. In 1954, C.F. Andrus released 'Charleston Gray' with elongate
fruit, gray rind, and red flesh. It was resistant to Fusarium wilt, anthracnose, and sunburn.
The Fusarium wilt resistant cultivar 'Jubilee' (1963) was developed by J.M. Crall. In 1970,
C.V. Hall developed 'Allsweet' with similar resistance to 'Charleston Gray', but higher fruit
quality. 'Allsweet' had elongate fruit shape and rind with wide, dark green stripes. In addition
to 'Allsweet', Hall developed 'Crimson Sweet', 'Super Sweet', and 'Petite Sweet'. During the
late 1900s, 'Crimson Sweet' and 'Allsweet' gained popularity among commercial growers and
captured a majority of the market in the US and 50 countries around the world (Gusmini and
Wehner, 2005). In 1990, Crall released the improved Fusarium wilt resistant cultivar 'Jubilee
II', and in 1995 along with a co-worker he released the small-seeded cultivar 'Dixielee', an
alternative to 'Allsweet' for its different fruit type and superior quality. Cultivars that
dominated the market in the mid 1900s were open-pollinated ones such as 'Charleston Gray',
'Jubilee', 'Crimson Sweet', and 'Sugar Baby'.
By the end of 1900s, hybrids had replaced open-pollinated cultivars for the
commercial market. 'Sangria' was the first hybrid developed by T.V. Williams of Rogers NK
(now Syngenta) in 1985. An important change in the watermelon industry was the production
of seedless cultivars. O.J. Eigsti worked for twenty years with H. Kihara of Japan, first to
work on seedless watermelon, to improve the systems of seedless watermelon. O.J. Eigsti
released the first seedless watermelon, 'Tri-X-313', in 1962. However, seedless watermelon
did not become commercially important until the 1990s due to poor fertility of tetraploid
Syngenta Inc. was first to introduce mini seedless watermelons, and were sold under the
PureHeartTM brand in the US and SolindaTM brand in the Europe (Maynard et al., 2007).
Mini seedless watermelons became popular, especially in the winter season. Although
seedless watermelons are more difficult to produce than seeded types, they sell for a higher
price and earn a larger return for growers (USDA-Economic Research Service, 2011). The
National Watermelon Promotion Board, Orlando, Florida, reported that in the US, 53% of
watermelons sold are seedless (TAMU-Vegetable Production and Marketing, 2011).
The last century of watermelon breeding has been focused on disease resistance and
fruit quality traits, often controlled by single genes. Many genes of watermelon, have been
used in cultivar improvement (Cucurbit Gene List Committee, 1979; Cucurbit Gene List
Committee, 1982; Guner and Wehner, 2004; Henderson, 1991; Henderson, 1992; Rhodes
and Dane, 1999; Rhodes and Zhang, 1995; Wehner and Guner, 2004).
Breeding for yield and stability
In the 20th century, high yielding watermelon cultivars became a major goal for breeders. Unlike corn (Zea mays), many researchers, mainly in the 1950s and 1960s, reported
that heterosis was not a large influence on yield. However, hybrids provided growers with
added value over open pollinated cultivars for uniform fruit yield and quality. Also, hybrids
provided protection of intellectual property and novel traits such as blocky shape (Gusmini
and Wehner, 2005). Seedless cultivars are in high demand and can only be produced as
triploid hybrids (TAMU-Vegetable Production and Marketing, 2011). However, it might be
advantage in using heterotic hybrid vs. inbred cultivars will still be important (Gusmini and
Wehner, 2005).
In the last five decades, watermelon yield in the US has increased approximately
200% (USDA, 2010). However, high yield is often associated with decreased yield stability
(Calderini and Salfer, 1999; Padi, 2007). The terms 'stability' or 'adaptability' refer to
consistent high performance of genotypes across diverse sets of environments (Romagosa
and Fox, 1993). Yield is a complex quantitative trait, and such traits are often controlled by
many genes, influenced by prevailing environmental conditions, with each gene having a
small effect. In order to identify the most stable and high yielding genotypes, it is important
to conduct multi-environment trials (Lu'quez et al., 2002). Although many yield trials of new
watermelons cultivars are run every year in the US, information on stability of yield in
watermelon is limited (Gusmini and Wehner, 2005).
Genotypes tested in different locations or years often have significant fluctuation in
yield due to the response of genotypes to environmental factors such as soil fertility or the
presence of disease pathogens (Kang, 2004). These fluctuations are often referred as
genotype x environment interaction (GEI) and are common. Genotype x environment
interactions have been studied in many crops, including common bean (Phaseolus vulgaris
L.) (Mekbib, 2003), corn (Zea mays L.) (Fan et al., 2007), cowpea (Vigna unguiculata L.)
(Padi, 2007), rice (Oryza sativa) (Haryanto et al., 2008), soybean (Glycine max L.) (Yan and
Rajcan, 2002), tomato (Lycopersicon esculentum Mill.) (Ortiz and Izquierdo, 1994), and
GEI results from a change in the relative rank of genotype performance or a change in
the magnitude of differences between genotype performance from one environment to
another. GEI affects breeding progress because it complicates the demonstration of
superiority of any genotype across environments and the selection of superior genotypes
(Magari and Kang, 1993; Ebdon and Gauch, 2002). Another undesirable effect of GEI
includes low correlation between phenotypic and genotypic values, thereby reducing
progress from selection. This leads to bias in the estimation of heritability and in the
prediction of genetic advance (Comstock and Moll, 1963; Alghamdi, 2004). Therefore, the
magnitude and nature of GEI determine the features of a selection and testing program.
Mega-environment identification
Often, plant breeders want to develop broadly-adapted genotypes for a wide range of
environments. However, it is often not possible to identify genotypes that are superior in
yield and yield components in all environments. Furthermore, the same genetic system may
not control yield over a diverse set of environments (Ceccarelli and Grando, 1993;
Ceccarelli, 1989; Simmonds, 1991). Therefore, breeders often develop genotypes for a
particular environment to take advantage of specific adaptations (Annicchiarico et al., 2005;
Samonte et al., 2005). However, breeding for a specific adaptation is more efficient if
production areas are divided into mega-environments, each representing a target environment
for breeding. Mega-environment is a portion (not necessarily contiguous) of the growing
region of a crop species having a fairly homogeneous environment that causes similar
The success of any plant breeding program depends on many factors; one of the most
important factors is the understanding and selection of suitable test locations (Yan et al.,
2011). An efficient test location is discriminating, so that differences among genotypes can
be easily detected using few replications, and is representative of the target environments for
the cultivars to be released. The representation of the location for the target environment
should be repeatable so that genotypes selected in each year will have superior performance
in future years (Yan et al., 2011). Therefore, knowledge of target environment for breeding
for locally adapted genotype is important and, also, it requires a subdivision of the target
locations into mega-environments.
Multiple-environment trials are routinely conducted as part of plant breeding
programs. The trials serve to identify superior genotypes for target regions, and to subdivide
the target region into different mega-environments. Subdivision of crop growing region into
several mega-environments helps in allocation of resources in a breeding program (Peterson
and Pfeiffer, 1989), target genotype distribution to appropriate production area, and
information exchanges between breeding programs (Brown et al., 1983). Understanding and
identification of mega-environment results in heritability increase within relatively
well-defined and predictable environment (Abdalla et al., 1996). Therefore, it improves the
efficiency of the testing and breeding program by focusing on the most promising material.
Stability methods
Various statistics have been proposed to measure the stability of genotypes over
environments. However, no single method can adequately explain cultivar performance
different concepts of stability: static (biological) and dynamic (agronomic). With the static
concept, a stable genotype possesses an unchanged performance regardless of variation in the
environmental conditions. Thus, genotypic variance among environments is zero. With the
dynamic concept, response of a genotype to environments is predictable. Thus, a stable
genotype has no deviation from response to environments. Both concepts of stability are
useful, but their application depends on the trait considered. For qualitative traits such as
resistance to diseases or stress, the static concept of stability is useful. For quantitative traits
such as yield, the dynamic concept of stability is useful (Norden et al., 1986).
Statistical methods for measuring genotypic stability should partition the information
from a genotype - environment data matrix into simpler components representing real
responses vs. random variation (Gauch, 1992). These statistical methods can be classified
into two groups: univariate and multivariate. Univariate models ranged from parametric, such
as environmental variance (Roemer, 1917), ecovalence (Wricke, 1962), stability variance
(Shukla, 1972), regression slope (Finlay and Wilkinson, 1963), deviation from regression
(Eberhart and Russell, 1966) and coefficient of determination (Pinthus, 1973).
Non-parametric models include Kang's yield stability statistic (Kang, 1993). Multivariate models
includes a wide range of methods such as principal component analysis (PCA) (Gower,
1967), cluster analysis (Mungomery et al., 1974), genotype main effect plus genotype by
environment interaction (GGE) biplot analysis (Yan, 2001), and additive main effects and
multiplicative interaction models (AMMI) (Gauch and Zobel, 1988).
of genotypes and do not rely upon assumptions about distribution of observed values or of
variance homogeneity. Univariate, parametric stability statistics involve relating observed
genotypic responses to a sample of environmental conditions. With certain statistical
assumptions, parametric stability methods exhibit beneficial properties, providing
information about the normal distribution of error and of interaction effects (Huehn, 1990).
For those reasons, parametric stability is more commonly used. Mut et al., (2009) reported
that for many applications, including selection in breeding and testing programs, parametric
stability statistics are useful but there is justification for the use of non-parametric measures
for the assessment of the yield stability of crop genotypes.
The multivariate models, AMMI and GGE biplot, appeared to be able to extract a
large part of the genotype - environment interaction and were efficient in analyzing
interaction patterns (Zobel et al., 1988). Gauch (1992) reported that multivariate models
captured a large portion of the genotype x environment interaction sum of squares clearly
separating main and interaction effects, and the model often provided an agronomically
meaningful interpretation of the data. Differences in genotype stability and adaptability to
environment can be qualitatively assessed using the biplot graphical representation that
scatters the genotypes according to their principal component values (Vita et al., 2010).
Objectives
The objectives of this research were to (i) evaluate the influence of years and
locations on yield of watermelon genotypes, (ii) identify genotypes with high stability for
yield, (iii) group test locations into mega-environments, and (iv) rank locations based on
References
Abdalla, O.S., J. Crossa, E. Autrique, and I.H. Declay. 1996. Relationships among international testing sites of spring durum wheat. Crop Sci. 36:33-40.
Alghamdi, S.S. 2004. Yield stability of some soybean genotypes across diverse environment. Pak. J. Bio. Sci. 7(12): 2109-2114.
Annicchiarico, P. 2002. Genotype × environment interactions: Challenges and opportunities for plant breeding and cultivar recommendations. FAO Plant Production and
Protection Paper No. 174. FAO, Rome.
Becker, H.C., and J. Leon. 1988. Stability analysis in Plant Breeding. Plant Breeding 101: 1-23.
Brown, K.D., M.E. Sorrels, and W.R. Coffman. 1983. A method for classification and evaluation of testing environments. Crop Sci. 23:889-893.
Calderini, D.F. and G.A. Slafer. 1999. Has high stability changed with genetic improvement of wheat stability? Euphytica. 107: 51-59.
Ceccarelli, S. 1989. Wide adaptation: How wide? Euphytica 40: 197-205.
Ceccarelli, S., and S. Grando, 1993. From conventional plant breeding to molecular biology. p.533-537. In D.R. Buxton et al. (ed.) International Crop Science I. CSSA, Madison, WI.
Comstock, R.E., and R.H. Moll. 1963. Genotype-environment interactions. p. 164–196. In W.D. Hanson and H.F. Robinson (ed.) Statistical genetics and plant breeding. National Academy of Sciences–National Research Council Publ. 982. NAS-NRC, Washington, DC.
Cucurbit Gene List Committee. 1979. New genes for the Cucurbitaceae. Cucurbit Genet. Coop. Rpt. 2: 49-53.
Cucurbit Gene List Committee. 1982. Update on cucurbit gene list and nomenclature rule. Cucurbit Genet. Coop. Rpt. 5: 62-66.
Ebdon, J.S., and H.G. Gauch, Jr. 2002. Additive main effect and multiplicative interaction analysis of national turfgrass performance trials: I. Interpretation of genotype 3 environment interaction. Crop Sci. 42: 489-496.
Eberhart, S.A., and W. A. Russell. 1966. Stability parameters for comparing varieties. Crop Sci. 6: 36-40.
Fan, X.M., M. Kang, H. Chen, Y Zhang, J. Tan, and C. Xu. 2007. Yield stability of maize hybrids evaluated in multi-environment trials in Yunnan, China. Agron. J. 99: 220-228.
FAO. 2010. Food and Agriculture Organization of the United Nations: FAOSTAT [Online]. Accessed at http://faostat.fao.org/site/339/default.aspx (accessed 30 April 2010; verified 10 Feb 2011).
Finlay, K. W. and G. N. Wilkinson. 1963. The analysis of adaptation in a plant breeding programme. Austr. J. Agric. Res. 14: 742-754.
Gauch, H.G. 1992. Statistical Analysis of Regional Yield Trials: AMMI Analysis of Factorial Designs. Elsevier Science Publishers, Amsterdam, The Netherlands.
Gauch, H.G., and R.W. Zobel. 1988. Predictive and postdictive success of statistical analysis of yield trials. Theor. Appl. Genet. 76: 1-10.
Gauch, H.G., and R.W. Zobel. 1997. Identifying mega-environment and targeting genotypes. Crop Sci. 37:311-326.
Gower, J.C. 1967. Multivariate analysis and multivariate geometry. Statistician 17: 13-28.
Guner, N. and T.C. Wehner. 2004. The Genes of watermelon. HortScience 39(6): 1175-1182.
Gusmini, G. and T.C. Wehner. 2005. Foundations of yield improvement in watermelon. Crop Sci. 45: 141-146.
Haryanto, T.A.D., Suwarto, and T. Yoshida. 2008. Yield stability of aromatic upland rice with high yield ability in Indonesia. Plant Prod. Sci. 11(1): 96-103.
Henderson, W.R. 1991. Gene list for watermelon. Cucurbit Genetics Cooperative Report. 14: 129-138.
Huehn, M. 1990. Non-parametric measures of phenotypic stability: Part 1. Theory. Euphytica. 47: 189-194.
Kang, M.S. 1993. Simultaneous selection for yield and stability in crop performance trials: Consequences for growers. Agron. J. 85: 754-757.
Lu'quez, J.E., L.A.N. Aguirreza´ bal, M.E. Aguero, and V.R. Pereyra. 2002. Stability and adaptability of cultivars in non-balanced yield trials: Comparison of methods for selecting 'high oleic' sunflower hybrids for grain yield and quality. Crop Sci. 188:225.
Magari, R. and M.S. Kang. 1993. Genotype selection via a new yield stability statistic in maize yield trials. Euphytica 70: 105-111.
Maynard, D.N., X. Zhang, and J. Janick. 2007. Watermelons: New Choices, New Trends. Chronica Horticulturae 47(4): 26-29.
Mekbib, F. 2003. Yield stability in common beans (Phaseolus vulgaris L.) genotypes. Euphytica 130: 147-153.
Mungomery, V.E., R. Shorter, and D.E. Byth. 1974. Genotype x environment interactions and environment adaptation. I. Pattern analysis-application to soyabean population. Aust. J. Agric. Res. 25: 59-72.
Mut, Z., N. Aydin, H.O. Bayramoglu, and H. Ozcan. 2009. Interpreting genotype x environment interaction in b read wheat (Triticum aestivum L.) genotypes using nonparametric measures. Turk. J. Agric. For. 33: 127-137.
Norden, A. J., D.W. Gorbert, D.A. Knauft, and F.G. Martin. 1986. Genotype x environment interaction in peanut multiline population. Crop Sci. 26: 46-48.
Ortiz, R. and J. Izquierdo. 1994. Yield Stability Differences among Tomato Genotypes Grown in Latin America and the Caribbean. HortScience 29(10): 1175-1177.
Padi, F.K. 2007. Relationship between stress tolerance and grain yield stability in cowpea. J. Agri. Sci. Camb. 142: 431-444.
Peterson, C.J., and W.H. Pfeiffer. 1989. International winter wheat evaluation: Relationships among test sites based on cultivar performance. Crop Sci. 29:276-282.
Rhodes, B. and F. Dane. 1999. Gene list for watermelon. Cucurbit Genet. Coop. Rpt. 22: 61-77.
Rhodes, B. and X. Zhang. 1995. Gene list for watermelon. Cucurbit Genet. Coop. Rpt. 18: 69-84.
Roemer, T., 1917: Sind die ertragsreichen Sorten ertragssicherer? Mitt. DLG 32: 87-89.
Romagosa, I. and P.N. Fox. 1993. Genotype×environment interaction and adaptation. In: Hayward, M.D., Bosemark, N.O., Romagosa, I. (Eds.), Plant Breeding: Principles and Prospects. Chapman & Hall, London, pp. 373-390.
Samonte, S.O., L.T. Wilson, A.M. McClung, and J.C. Medley. 2005. Targeting cultivars onto rice growing environments using AMMI and SREG GGE biplot analyses. Crop Sci. 45:2414-2424.
Simmonds, N.W. 1991. Selection for local adaptation in a plant breeding program. Theor. Appl. Genet. 82:363-367.
Shukla, G.K. 1972. Some statistical aspects of partitioning genotype-environmental components of variability. Heredity 29: 237-245.
USDA. 2010. United States Department of Agriculture, National Agricultural Statistics Services [Online]. Accessed at http://www.nass.usda.gov/QuickStats/index2.jsp (accessed 30 April 2010; verified 10 Feb 2011).
USDA-Economic Research Forum. 2011. Watermelons: An economic assessment of the feasibility of providing multiple-peril crop insurance [Online]. Accessed at
http://www.rma.usda.gov/pilots/feasible/pdf/wtrmelon.pdf (accessed 20 August 2011; verified 10 Oct 2011).
TAMU-Vegetable Production and Marketing. 2011. Smaller, low-priced seedless
watermelon's market dominance marks the end of seeded era [Online]. Available at http://aggie-horticulture.tamu.edu/extension/newsletters/vpmnews/feb03/art2feb.html (accessed 15 October 2011; verified 24 October 2011).
Vita, P. De., A.M. Mastrangeloa, L. Matteua, E. Mazzucotellib, N. Virzi, M. Palumboc, M. Lo Stortod, F. Rizzab, and L. Cattivelli. 2010. Genetic improvement effects on yield stability in durum wheat genotypes grown in Italy. Field Crop Res. 119: 68-77.
Whitaker, T.W. and I.C. Jagger. 1937. Breeding and improvements of cucurbits, p. 207-232. In: USDA-ARS (ed.). Yearbook of Agriculture.
Wehner, T.C. and N. Guner. 2004. Qualitative genes for use in development of elite watermelon cultivars. Cucurbit Genet. Coop. Rpt.27: 24.
Wricke, G. 1962: Uber eine Methode zur Erfassung der okologischen Streubreite in Feldversuchen. Z. Pfianzenzuchtg. 47: 92-96.
Yan, W. 2001. GGEbiplot: A Windows application for graphical analysis of multi-environment trial data and other types of two-way data. Agron. J. 93: 1111-1118.
Yan, W., D. Pageau, J. Frégeau-Reid, and J. Durand. 2011. Assessing the representativeness and repeatability of test locations for genotype evaluation. Crop Sci. 51: 1603-1610.
Yan, W., and I. Rajcan. 2002. Biplot evaluation of test sites and trait relations of soybean in Ontario. Crop Sci. 42: 11-20.
CHAPTER 1
GENOTYPE X ENVIRONMENT INTERACTION AND STABILITY ANALYSIS OF PERFORMANCE OF FRUIT YIELD AND YIELD COMPONENTS IN WATERMELON [Citrullus lanatus (Thunb.) Matsum. & Nakai] TESTED IN MULTIPLE US LOCATIONS
Mahendra Dia and Todd C. Wehner
Department of Horticultural Science, North Carolina State University, Raleigh, NC 27695-7609
Genotype x Environment Interaction and Stability Analysis of Performance of Fruit Yield and Yield Components in Watermelon [Citrullus lanatus (Thumb.) Matsum &
Nakai] Tested in Multiple US Locations Abstract
One of the major breeding objectives for watermelon [Citrullus lanatus (Thumb.)
Matsum & Nakai] is improved fruit yield. High yielding genotypes have been identified, but
we also were interested to evaluate genotypes for stability for fruit yield and yield
components over diverse environments. The objectives of this study were to (i) evaluate the
influence of years and locations on yield of watermelon genotypes, and (ii) identify
genotypes with high stability for yield. A set of 40 genotypes was tested over 3 years (2009,
2010, and 2011) and 8 locations across the southern United States in replicated, multi-harvest
trials. The genotypes included new vs. old releases, small vs. large fruit size, round vs.
elongate fruit shape, striped vs. solid rind pattern, resistant vs. susceptible to anthracnose,
eastern vs. western adapted, and inbred vs. hybrid type. Yield traits were summed over
harvests, and measured as marketable yield, fruit count, % cull fruit, % early fruit, and fruit
size. There were strong effects of environment as well as genotype x environment interaction
(GEI) on watermelon yield traits. There was a significant advantage of hybrids over inbreds
for yield components performance and responsiveness to favorable environments. Four
genotypes including, 'Fiesta F1', 'Stars-N-Stripes F1', 'Stone Mountain' and 'Calhoun Gray'
had a high trait mean performance and high phenotypic stability. The four stable genotypes
good lines for breeding for high yield and stability. Hybrids can provide growers with added
value expressed through a high probability of enhanced fruit yield and improved yield
responsiveness and stability relative to conventional genotypes. A significantly (P<0.001)
and positively correlation was found between trait mean and Kang's yield-stability statistics
(YSi), and Shukla's stability variance (σi2) and deviation from regression (S2d) for all the traits
evaluated in this study. None of the stability statistics (M, bi, S2d , and σi2) alone were useful
for selecting high yield and stable genotypes except YSi. Introduction
Watermelon (Citrullus lanatus [Thumb.] Matsum & Nakai) is a valuable crop grown
throughout the world. The United States is the fifth largest producer, with 2 million Mg
harvested from 21,450 ha in 2007, valued in excess of $476 million (FAO, 2010; USDA,
2010). Watermelons are grown in almost all the states of the US. However, the major
producers are in the South and West, including Florida, Texas, Oklahoma and California,
where there is a long frost-free season (Wehner, 2008). During the past century, watermelon
cultivars have been developed with high fruit yield, fruit quality, earliness, percentage
marketable fruit, excellent shipping characteristics, and disease resistance. A century of
breeding has produced uniform hybrids, seedless triploids, tough rind, high sugar content,
dark red flesh, 9 kg picnic watermelons, and 3 kg mini watermelons (Gusmini and Wehner,
2008). Since 1960, yield has increased approximately 200% in the US (USDA, 2010).
However, high yield is often associated with decreased yield stability (Calderini and Salfer,
By growing genotypes in different environments, the highest yielding and most stable
genotypes can be identified (Lu'quez et al., 2002). Genotypes tested in different locations or
years often have significant fluctuation in yield due to the response of genotypes to
environmental factors such as soil fertility or the presence of disease pathogens (Kang,
2004). These fluctuations are often referred as genotype x environment interaction (GEI) and
are a common, and have been studied in many crops (Bednarz et al., 2000; Mekbib, 2003;
Riday and Brummer, 2006; Fan et al., 2007; Mulema et al., 2008; Vitta et al., 2010).
GEI results from a change in the relative rank of genotype performance or a change in
the magnitude of differences between genotypes performance from one environment to
another. Thus, GEI affects breeding progress because it complicates the demonstration of
superiority of any genotype across environments and, thus, the selection of superior
genotypes (Magari and Kang, 1993; Ebdon and Gauch, 2002). Another undesirable effect of
GEI includes low correlation between phenotypic and genotypic values, thereby reducing
progress from selection. This leads to bias in the estimation of heritability and in the
prediction of genetic advance (Comstock and Moll, 1963; Alghamdi, 2004). Therefore, the
magnitude and nature of GEI determine the features of a selection and testing program.
Many researchers use the terms 'stability' and 'adaptability' to refer to consistent high
performance of genotypes across diverse sets of environments (Romagosa and Fox, 1993).
Lin and Binns (1994) described two types of stable genotypes; those showing a stable
average yield across environments, and those with high yield in specific environments, but
Statistical methods have been proposed for the analysis of yield stability. The
methods partition the information from a genotype - environment data matrix into simpler
components representing real responses vs. random variation (Gauch, 1992). These statistical
methods range from univariate models, such as regression slope, deviation from regression,
environmental variance, and Kang's yield-stability; as well as multivariate models such as
genotype main effect plus genotype by environment interaction (GGE) biplot (Finlay and
Wilkinson, 1963; Eberhart and Russell, 1966; Yan, 2001; Kang, 1993; Yan and Kang 2003).
Lin et al. (1986) classified stability analysis models into three groups: types 1, 2 and
3. Each model reflects different aspects of stability, and no single method adequately
explained genotype performance across environments (Wachira et al., 2002). Type 1 stability
parameters – genotype mean squares (Si2) and genotypic coefficient of variation (CVi) –
measure the variation within a genotype across environment. In type 1, a genotype is
considered to be stable if its environmental variance is small (Roemer, 1917). This stability
parameter is often related to homeostasis and has been associated with low yield. Therefore,
it is less appealing and infrequently used by plant breeders (Mekbib, 2003).
The most widely used approach is based on linear regression of genotype yield on an
environmental index derived from the average performance of all genotypes in each
environment (Finlay & Wilkinson, 1963; Eberhart & Russell, 1966; Freeman, 1973;
Chakroun et al., 1990). The regression model provides two stability parameters. The first
estimate is the linear regression coefficient (bi) of genotype mean on environmental index.
The regression, or slope, is a type 3 stability measure. The second estimate obtained from
deviation from regression is a type 3 stability measure. According to the Eberhart and Russell
(1966), a bi approximating unity along with a S2d near zero indicate average stability. When
this is associated with high mean yield, genotypes have general adaptability and when
associated with low mean yield, genotypes are poorly adapted to all environments. A bi
greater than unity describes genotypes with higher sensitivity to environmental change
(below average stability), and greater specificity of adaptability to high yielding
environments. A bi less than unity provides a measure of greater resistance to environmental
change (above average stability), and therefore increasing specificity of adaptability to low
yielding environments. Despite the frequent use of the regression method, several researchers
reported deficiencies of the method for determination of GEI patterns (Zobel et al., 1988;
Nachit et al., 1992; Annicchiarico, 1997; Vita et al., 2010). The linear regression method
captures a small part of sum of squares of GEI, and confuses GEI and main effects (Wright,
1971). Thus, regression technique is unable to predict non-linear genotypic response to
environment (Nachit et al., 1992).
Shukla (1972) proposed an unbiased estimate of the variance of GEI plus an error
term associated with genotype. This stability statistic is termed 'stability variance' (σi2), and is
a type 2 stability measure. The σi2 partitions GEI and error term, and assigns it to individual
genotypes. Shukla's stability statistic measures the contribution of a genotype to the GEIs and
error term, therefore a genotype with low σi2is regarded as stable. Shukla's stability variance
(σi2) is a linear combination of Wricke's ecovalance (Wi2), another type 2 stability measure
correlation between Wi2 and σi2was observed in studies on yield stability of barley (Hordeum vulgare L.) (Bahrami, 2008), common beans (Phaseolus vulgaris L.) (Mekbib, 2003), and
winter rapeseed (Brassica napus L.) (Marjanovic-Jeromela, 2008). Therefore, it is sufficient
and justifiable to use just one of the two statistics (Ngeve and Bouwkamp, 1993).
Kang's stability statistics (YSi) is nonparametric stability procedure in which both trait
mean (M) and Shukla's (1972) stability variance (σi2) of trait are used as selection criteria.
This method assumed equal weight for M and σi2. The genotype with the highest M was
given the rank of 1 and the rank of M was adjusted based on LSD (Mekbib, 2003). Mean
rank was adjusted by +1 if mean yield is greater than overall mean yield and their difference
is less than 1LSD; +2 if mean yield is greater than or equal to 1LSD above overall mean
yield; +3 if mean yield is greater than or equal to 2LSD above overall mean yield; -1 if mean
yield is lesser than overall mean yield and their difference is less than 1LSD; -2 if mean yield
is lesser than or equal to 1LSD above overall mean yield; and -3 if mean yield is lesser than
or equal to 2LSD above overall mean yield (Mekbib, 2003). Stability variance (σi2) was
assigned rating of -8, -4, -2, and 0 based on F test. The rating of -8, -4, and -2 was assigned, if σi2 was significant at α = 0.01, 0.05, and 0.01, respectively; and 0 for non-significant σi2
(Mekbib, 2003). The adjusted rank of M and rating of σi2 were summed (YSi) for each
genotype. According to this method, genotypes with YSi greater than the mean YSi are
considered stable (Kang, 1993; Mekbib, 2003, Fan et al., 2007).
Several models for evaluating stability have been proposed, reflecting different
aspects of the concept. However, no single method adequately explains genotype
useful in selection unless they are combined with performance (mean). Thus, stability must
be used along with performance.
GEI for yield has been studied in several crops, including common bean (Phaseolus
vulgaris L.) (Mekbib, 2003), corn (Zea mays L.) (Fan et al., 2007), cowpea (Vigna
unguiculata L.) (Padi, 2007), rice (Oryza sativa) (Haryanto et al., 2008), soybean (Glycine
max L.) (Yan and Rajcan, 2002), tomato (Lycopersicon esculentum Mill.) (Ortiz and
Izquierdo, 1994), and wheat (Triticum aestivum L.) (Vita et al., 2010). GEI for oil production
has been studied in winter rapeseed (Brassica napus L.) (Marjanovic-Jeromela et al., 2008).
GEI for leaf yield has been studied in tea (Camellia sinensis) (Wachira et al., 2002). GEI for
carotenoid content has been studied in potato (Solanum tuberosum) (Haynes et al., 2010).
However, information on stability of watermelon for yield in the US is limited.
Therefore, we were interested to evaluate the stability for yield and yield components of
watermelon, and to identify genotypes having high stability across locations or specific
location adaptability. The objective of this study was to (i) evaluate the influence of years
and locations on yield of watermelon genotypes, and (ii) identify genotypes with high
stability for yield.
Materials and Methods
Germplasm and location
Forty genotypes of watermelon were evaluated for 3 years (2009, 2010, and 2011)
and 8 locations across the southern United States. Locations were chosen to represent major
California in the west. Data were not collected from Oklahoma in 2009, Georgia in 2010, and
Florida location in 2011. Forty genotypes were chosen to represent new vs. old releases,
small vs. large fruit size, round vs. elongate fruit shape, striped vs. solid rind pattern,
anthracnose resistance vs. susceptibility, eastern vs. western adapted, and inbred vs. hybrid
type (Tables 1, 2 and 3).
Plots work and Cultural systems
The experiment design was a randomized complete block with four replications in
each location and year. For Kinston and Clinton locations of North Carolina, seeds of all 40
genotypes were sown in 72-cell polyethylene flats in the greenhouses at North Carolina State
University. An artificial soilless growing medium 4P Fafard soilless mix (Conrad Fafard
Incorporated, Massachusetts), was used. The flats were moistened to capacity after seeding,
and held in the greenhouse at 25-30°C until full emergence. The transplants were moved to
cold frames for acclimation one week before transplanting. The seedlings were transplanted
by hand at the two-true-leaf stage. Missing or damaged transplants were replaced one week
after the initial transplanting.
The crop was planted on raised, shaped beds in rows on 3.1-m centers with
single-plant hills 1.2 m apart. The beds were made up with drip irrigation tubes and covered with
black polyethylene mulch. Production practices were according to the North Carolina
Extension Service and Southeastern US 2009 Vegetable Crops handbook (Sanders, 2004;
Holmes and Kemble; 2009). The same protocols were followed at other locations in each
Data collection and Traits
At each location, the 40 watermelon genotypes were evaluated for traits including
marketable yield (Mg ha-1), fruit count (thousand fruit ha-1), % cull fruit (100 x cull fruit yield/total fruit yield), % early fruit (100 x fruit weight of first harvest/fruit weight over all
harvests), and fruit size (kg fruit-1). Yield traits were the same as used by commercial growers and plant breeders.
Fruit were harvested using the guide of number of days to maturity, as well as the
indicators of maturity: a brown and dry tendril at the node bearing the fruit, a dull waxy fruit
surface, a light-colored groundspot on the fruit, and a dull sound of the fruit when thumped
(Maynard, 2001). Fruit were weighed individually, and yield was calculated as total and
marketable fruit weight (Mg ha-1) and number (thousands ha-1) by summing plot yields over harvests. Numbers of cull and marketable fruit were also recorded. Percent cull fruit was
calculated as cull fruit weight divided by total fruit weight. All crooked, bottle-necked, and
other deformed fruit were considered culls. Depending on location and year 1 to 4 harvests
were done; however, most locations had 2-3 harvests (Table 3). Data were not collected on %
cull fruit from South Carolina in 2009, 2010, and 2011; and Florida in 2009 and 2010. Only
single harvest was done at California in 2009 and Georgia in 2011, therefore for % early fruit
no data was collected from California in 2009 and Georgia in 2011.
Data analysis
Data were analyzed for genotype, environment and genotype - environment
random effects. ANOVA was used to determine the size and significance for genotype -
environment interactions for the traits of interest. An F test was used to test the interaction
effect. If GEIs were significant, additional statistics were calculated to determine the stability
of each genotype over the 24 environments. The stability parameters used were bi, S2d, and σi2 (Finlay and Wilkinson, 1963; Eberhart and Russell, 1966; Shukla, 1972). Least squared
means or adjusted trait means (M) and their least significant difference (LSD) for each
genotype were computed over the 24 environments for the traits of interest. Hereafter, 'mean'
is used to indicate least squared mean or adjusted trait mean. Stability parameters bi, S2dand σi2 were used to identify the most stable genotypes. Additionally, the Kang's yield-stability
statistic (YSi) was computed (Kang, 1993; Mekbib, 2003; Fan et al., 2007) for simultaneous
selection of high mean and high stability for yield and yield components.
Tests for significance were derived using a t-test for each bi and an F test for each S2d
for statistical differences from unity and zero, respectively, at 0.05, 0.01 and 0.001 levels of
probability. Ranks were assigned to each genotype in an increasing order for each stability
parameter, except % cull fruit (selected for low values). Simple correlation coefficients using
Spearman's rank correlations were calculated on the ranks to measure the relationship
between the parameters. When compared to Pearson correlation coefficients, spearman
correlation coefficients may be more reliable since they use rank order and are therefore not
Results and Discussion
ANOVA
The combined analysis of variance (ANOVA) indicated highly significant
environment, genotype and genotype - environment interaction (GEI) effects for all traits
evaluated (Table 4). Marketable yield was affected greatly by environment (48% of total sum
of squares), moderately by GEI (18% of total sum of squares), and a small amount by
genotype (8% of total sum of squares) (Table 4). Of the environmental (48%) variation for
marketable yield, 75% was attributable to location, 21% to location - year interaction (LEI),
and 3% to year (Table 4). However, fruit count was controlled largely by environment,
genotype and GEI effects (35%, 20%, and 21% of total sum of squares, respectively) (Table
4). The E portion (35%) of fruit count was attributable to 68% to location, 27% to LEI, and
7% to year (Table 4).
ANOVA for % cull fruit indicated that environment, genotype and GEI effects
accounted for 26% 10% and 23%, respectively, of the total sum of squares (Table 4). Percent
cull fruit was affected moderately by environment (26% of total sum of squares) and GEI
(23% of total sum of squares), and a small amount by genotype (10% of total sum of squares)
(Table 4). Of the environmental (26%) variation for % cull fruit, 58% was attributable to
location, 31% to LEI, and 12% to year (Table 4).
ANOVA for % early fruit indicated that environment, genotype and GEI effects
accounted for 38%, 7% and 22%, respectively, of the total sum of squares (Table 4). Percent
squares) (Table 4). Of the environmental (48%) variation for % early fruit, 58% was
attributable to location, 6% to LEI, and 3% to year (Table 4).
ANOVA for fruit size indicated that environment, genotype and GEI effects
accounted for 14%, 51% and 13%, respectively, of the total sum of squares (Table 4). Fruit
size was affected largely by genotype (51% of total sum of squares), and small amount by
environment (14% of total sum of squares) and GEI (13% of total sum of squares) (Table 4).
Of the environmental (14%) variation for fruit size, 54% was attributable to location, 44% to
LEI, and 1% to year (Table 4).
All yield traits except fruit size had a large sum of squares due to environment, with
large differences among environments for genotype means causing most of the variation in
genotype performance. Similarly, these results suggested that yield and yield components
were influenced by GEI and, thus, required separate stability analysis for each trait.
Genotype means (M)
Marketable yield ranged from 80.44 to 27.43 Mg ha-1. Highest marketable yield was for 'Big Crimson', but 'Stone Mountain', 'Stars-N-Stripes F1' and 'Starbrite F1' were not
significantly different (Table 5). Other high yielding genotypes were 'Fiesta F1', 'Regency
F1', 'Calhoun Gray', 'Legacy' and 'Mountain Hoosier'. 'Golden Midget' had the lowest
marketable yield, significantly lower than the other genotypes tested (Table 5). A similar
observation was made by Gusmini and Wehner (2005). They evaluated 80 watermelon
genotypes for yield performance and found that highest yielders were the inbreds 'Mountain
Hoosier', 'Hopi Red Flesh', 'Early Arizona', Stone Mountain', 'AU-Jubilant', 'Sweetheart',
'Blacklee', and the F1 hybrids 'Starbrite F1', and 'Stars-N-Stripes'. Fruit count ranged from
3.94 to 15.59 thousand fruit ha-1 (Table 6). Highest fruit count was for 'Golden Midget', followed by 'Minilee' and 'King & Queen' (Table 6). Lowest fruit count was for 'Carolina
Cross#183', significantly lower than all other genotypes (Table 6). Genotypes with high
marketable yield had intermediate fruit count, confirming the results of Gusmini and Wehner
(2005).
Large fruit size was correlated with high % cull fruit (Tables 7 and 9). 'NC Giant' and
'Congo' had large fruit and the highest % cull fruit (23.42% and 20.55%, respectively, Table
7). Lowest % cull fruit were for 'Minilee', which was similar to high yielding 'Starbrite F1'
and 'Regency F1' (Table 7). 'Carolina Cross#183', 'NC Giant', 'Georgia Rattlesnake',
'AU-Jubilant', and 'Jubilee' had the largest fruit size; 'Golden Midget', 'Minilee', and 'Mickylee'
had the smallest fruit size (Table 9).
'Golden Midget', 'Early Canada', 'Stone Mountain', and 'Regency F1' had the highest
% early fruit (Table 8). Genotypes 'Navajo Sweet', 'Peacock WR-60', 'King & Queen',
'Minilee' and 'Tom Watson' produced the lowest % early fruit (Table 8).
Regression coefficient or slope (bi)
For marketable yield, the bi value of most of the genotypes was similar (P>0.01) to
unity, except for 'Big Crimson', 'Carolina Cross#183', 'Charleston Gray', 'Congo', 'Early
Canada' 'Golden Midget', 'Graybelle', 'King & Queen', 'Royal Flush F1', 'Starbrite F1' and
'Tom Watson' (Table 5). According to Eberhart and Russell (1966), large variation in bi
Stripes F1', 'Georgia Rattlesnake', 'Sangria F1', 'Early Arizona', 'Navajo Sweet', 'Peacock
WR60', and 'Mickylee'. Thus, these genotypes were the most stable for marketable yield
using the regression coefficient method.
Similarly, bi for fruit count was close to unity for 'Sugar Baby', ' Stars-N-Stripes F1',
'Tender Sweet OF', 'Crimson Sweet', 'Fiesta F1', 'Crimson Sweet', 'Mountain Hoosier',
'Legacy', and 'Peacock WR-60' (Table 6). With the exception of 'Black Diamond', 'Congo',
and 'Starbrite F1' all genotypes had bi of unity (Table 6). Genotypes 'Black Diamond' and
'Congo' had bi of zero. High positive value of bi indicates that fruit count increased as
environmental index increased. Low bi indicates that fruit count did not increase as
environmental index increased (Table 6).
For % cull fruit, bi ranged from -1.35 to 2.79 (Table 7). Interestingly, a positive
association was observed for bi and % cull fruit (Table 10). This suggests that genotypes such
as 'Congo' and 'Hopi Red Flesh' with high % cull fruit also had high bi, indicated that they
produced more culls as environment improved. Conversely, genotypes such as
'Stars-N-Stripes F1', 'Fiesta F1', Peacock WR 60, and 'Yellow Crimson' with low % cull fruit had
resistance to environment changes. 'Minilee', 'Navajo Sweet', and 'Calsweet' had low % cull
fruit and negative bi value, which suggested that these genotypes produced fewer culls as
environment improved.
The bi value for % early fruit for all the genotypes were positive and found to be
significantly similar to 1.0, except 'Georgia Rattlesnake' (Table 8). These findings suggested
that early yield of all the genotypes was more influenced by environment. These genotypes
were the most desirable for yield performance over environments since their % early fruit
improved directly as the environment improved.
Deviation from regression (S2d) and Shukla's stability variance (σi2)
A significant positive rank correlation was found between S2d and σi2 for the yield of
marketable yield, fruit count, % cull fruit, and % early fruit; and fruit size (Table 10). The
high correlation between S2d and σi2 indicated overlap in the aspect of stability measured by
the two statistics. Similar observation has been reported by Ngeve and Bouwkamp (1993)
and Mekbib (2003) in sweet potato (Ipomoea batatas L.) and common bean (Phaseolus
vulgaris L.), respectively. Therefore, it is sufficient to use just one of the two statistics.
The genotypes with the highest marketable yield in this study were 'Starbrite F1',
'Stars-N-Stripes F1', 'Fiesta F1', 'Regency F1', 'Big Crimson', 'Stone Mountain', 'Calhoun
Gray', and 'Legacy'. Among these high yielding genotypes, two inbreds ('Big Crimson' and
'Legacy') and a hybrid ('Starbrite F1') had significant S2d and high σi2 for marketable yield
(Table 5). It suggested that marketable yield of 'Big Crimson', 'Legacy', and 'Starbrite F1'
were more likely to change over environments. Two high yielding inbreds ('Big Crimson' and
'Legacy') had significant S2d and high σi2 for yield components including, fruit count and %
early fruit (Tables 6 and 8). According to Eberhart and Russell (1966) and Shukla (1972) an
ideal genotype is the one that combines high yield with non-significant S2d and low σi2.
Therefore, the inbred genotypes 'Big Crimson' and 'Legacy' were unstable and non-ideal for
marketable yield. For % early fruit, except two hybrids ('Fiesta F1' and 'Starbrite F1'), all
Gray' (Tables 9). It suggested that the performance of high yielding genotypes for % early
fruit was more likely to change over environments and fruit size was less likely to change
over environments.
With respect to inbreds with high marketable yield, hybrids with high marketable
yield consistently had non-significant S2d and low σi2 for fruit count and % early fruit (Tables
6 and 7). The top three high yielding hybrids ('Starbrite F1', 'Regency F1', and
'Stars-N-Stripes F1') had non-significant S2d and low σi2 for fruit count and % cull fruit (Tables 6 and
7). Whereas, high yielding inbred per se did not have non-significant S2d and low σi2 for both
fruit count and % cull fruit (Tables 6 and 7). It is assumed that the presence of heterozygous
loci in hybrids might have masked the effect of genes controlling trait for less fruit count and
low % cull fruit. Similar to this study, Bruns and Peterson (1998) compared yield stability of
hybrids and pure lines in Agitprop Standard Variety Trials and USDA-ARS Southern
Regional Performance Nurseries from 1990 to 1995. They found strong evidence for
substantial hybrid yield advantage and hybrid responsive to favorable environments.
However, they did not find significant difference in deviation from regression line in hybrid.
vs. inbreds.
Kang's stability statistics (YSi)
Kang's stability statistics (YSi) analysis used both trait mean (M) and Shukla's (1972)
stability variance (σi2) of the trait. This method assumed equal weight for M and σi2;
however, if F test value of σi2 was non-significant then σi2 gets rating of 0 which leads to
equal rank of M and YSi. In present study, these observations were confirmed by a strong

![Table 5. Means (corrected by least squares) (M) and stability parameters (regression coefficient [bi], deviation from regression [S2d] and Shukla’s stability variance [σi2]) for marketable yield of 40 watermelon genotypes tested in 3 years and 8 locations](https://thumb-us.123doks.com/thumbv2/123dok_us/1481726.1181304/61.612.94.538.123.620/parameters-regression-coefficient-regression-stability-marketable-watermelon-locations.webp)
![Table 6. Means (corrected by least squares) (M) and stability parameters (regression coefficient [bi], deviation from regression [S2d] and Shukla’s stability variance [σi2])for fruit count of 40 watermelon genotypes tested in 3 years and 8 locations](https://thumb-us.123doks.com/thumbv2/123dok_us/1481726.1181304/62.612.93.541.123.620/corrected-parameters-regression-coefficient-regression-stability-watermelon-locations.webp)
![Table 7. Means (corrected by least squares) (M) and stability parameters (regression coefficient [bi], deviation from regression [S2d] and Shukla’s stability variance [σi2]) for % cull fruit of 40 watermelon genotypes tested in 3 years and 8 locations](https://thumb-us.123doks.com/thumbv2/123dok_us/1481726.1181304/63.612.93.542.124.618/corrected-parameters-regression-coefficient-regression-stability-watermelon-locations.webp)
![Table 8. Means (corrected by least squares) (M) and stability parameters (regression coefficient [bi], deviation from regression [S2d] and Shukla’s stability variance [σi2]) for % early fruit of 40 watermelon genotypes tested in 3 years and 8 locations](https://thumb-us.123doks.com/thumbv2/123dok_us/1481726.1181304/64.612.91.543.126.621/corrected-parameters-regression-coefficient-regression-stability-watermelon-locations.webp)
![Table 9. Means (corrected by least squares) (M) and stability parameters (regression coefficient [bi], deviation from regression [S2d] and Shukla’s stability variance [σi2]) for fruit size of 40 watermelon genotypes tested in 3 years and 8 locations](https://thumb-us.123doks.com/thumbv2/123dok_us/1481726.1181304/65.612.93.541.123.620/corrected-parameters-regression-coefficient-regression-stability-watermelon-locations.webp)
![Table 10. Spearman rank correlation coefficients among trait mean (M) and stability parameters (regression coefficient [bi], deviation from regression [S2d], Shukla’s stability variance [σi2], and Kang’s stability statistics [YSi] for watermelon based on 4](https://thumb-us.123doks.com/thumbv2/123dok_us/1481726.1181304/66.612.91.540.136.640/correlation-coefficients-parameters-regression-coefficient-regression-statistics-watermelon.webp)
![Inheritance of Fruit Yield and other Horticulturally important Traits in Watermelon [Citrullus lanatus (Thunb.) Matsum. & Nakai]](data:image/gif;base64,R0lGODlhAQABAIAAAP///wAAACH5BAEAAAAALAAAAAABAAEAAAICRAEAOw==)