Studies on Hybrid Composite Material
Harshith.B1, Ravi Kumar2
Student, Department of Mechanical Engineering, Sambhram Institute of Technology, Bangalore, India1
Assistant Professor, Department of Mechanical Engineering, Sambhram Institute of Technology, Bangalore, India2
ABSTRACT: Composite materials are formed by reinforcing two or more materials of varying properties. Our paper deals with the analysis of hybrid composite materials. Hybridization is a process of incorporating synthetic fibers with that of natural and metallic fibers in order to yield better strength, stiffness, high strength to weight ratio and other mechanical properties. This paper concerns with the development of new hybrid composite materials using Wood Powder, Groundnut Husk and Cashew nut Husk. Based on the physical, chemical and mechanical properties of the selected materials the required resins, catalysts and other accelerators are chosen and fabricated accordingly. The paper will present the Mechanical properties of the above mentioned eco-friendly and bio-degradable composites and the best possible applications of this composite materials.
I. INTRODUCTION
Many of the engineering application in the world today require materials with unusual combination of properties that cannot be met by the conventional metal alloys, ceramics or polymers. This is especially true for the materials that are needed for aerospace and transportation applications. A new class of materials called ‘Composite materials’ has answered to this search to a great extent. Composite materials are created artificially by combining two or more materials which usually have dissimilar characteristics. The constituents of a composite material can be generally identified macroscopically. Composite materials are new generation materials produced to meet the demands of automobile and aircraft industries.
II. MATERIALS AND METHODS
2.1 MATRIX MATERIAL USED:
Aluminium alloy LM25 in the form of ingots used in the work . The compositions of the same is given below.
Si Fe Cu Mn Mg Zn Al 7.2% 0.5% 0.2% 0.3% 0.60% 0.1% balance
2.2 REINFORCEMENT USED:
Preparation of Aluminium-Silicon Carbide Composite
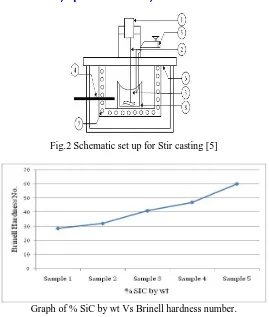
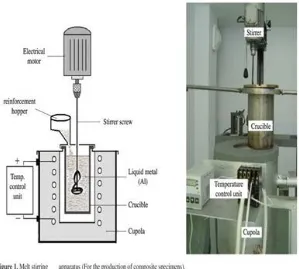
Casting is probably one of the most ancient processes of manufacturing metallic components. The metal matrix composite used in the present work is prepared by the stir casting method. For the preparation of the Aluminium silicon carbide composite by using stir casting mass basis ratio of 100:2.5, 100:5, 100:7.5, and 100:10 are taken. Fig. 1 illustrates the raw materials and samples of Aluminium Silicon Carbide material. Aluminium alloy in the form of ingots is used. The metal ingots are cleaned and melted to the desired super heating temperature of 750oC ingraphite crucibles. Fig.2 shows schematic set up for stir casting technique. A three-phase electrical resistance furnace with temperature controlling device is used for melting. For each melting 300 - 400 g of alloy is used. The super heated molten metal is degassed at a temperature of 780oC. SiC particulates, preheated to around 500oC, are then added to the molten metal and stirred continuously by a mechanical stirrer at 720oC. The stirring time is between 5 and 8 minutes. During stirring, Borax powder was added in small quantities to increase the wettability of SiC particles.
Fig.1 Raw materials and Samples of Aluminium Silicon Carbide material
The melt, with the reinforced particulates, is poured into the dried, coated, cylindrical permanent sand mould.The pouring temperature is maintained at 680oC. The same molten metal and SiC particle mixture was poured intostrip. The melt was allowed to solidify in the moulds.The mould has been prepared (Fig.3) for casting specimen for various mechanical tests. The sand mould isprepared approximately 10cm in diameter and 8cm to 10cm in height. Test specimen prepared for Hardness andmicrostructure are shown in Fig. 4.
1. Motor 5. Particle injection chamber 2. Shaft 6. Insulation hard board 3. Molten aluminum 7. Furnace
Fig.2 Schematic set up for Stir casting [5]
Graph of % SiC by wt Vs Brinell hardness number.
2.3 PRODUCTION OF CASTING:
2.3.1 MELTING OF THE ALLOY:
The crucible with the alloy was kept inside a 3phase Resistance furnace and mines were switched on. The alloy ingot will melt slowly. The temperature of the melt inside the furnace was noted ion the temperature recorder. The temperature was checked with an alumel-chromel thermocouple before the crucible out of the furnace.The crucible was taken out of the furnace in the melt temperature was around 850°C.
Fig 3.3.2: crucible inside the furnace Fig 3.3.1 Electrical furnace
2.3.2 DEGASSING:
The molten metal was degassed using hexa-chloroethane (C2CL6) tablets as degassing agent (0.5% weight of metal). The
Fig 3.3.2 Degassing
2.3.3 STIR CASTING METHOD:
The aluminum alloy was melted in an electrical furnace. The stirrer was introduced to perform mixing process when the molten temperature reached 8500C.
The stirring was carried out for 45 minutes at the rate of 200 rpm.
Silicon carbide and Activated Carbon particles were preheated to 200 0C and introduced into the molten alloy.
The pouring temperature of molten mixture was 8500C and molten metal was poured into the die.
Then the MMC was ejected from the die at a temperature of 150oC and it is allowed to cool in air.
III. VARIOUS TESTS CONDUCTED
3.1 TENSILE TEST:
the tensile strength (UTS), yield strength or yield point (σy), elastic modulus (E), percent elongation (ΔL%) and thereduction in area (RA%). Toughness, Resilience, Poisson’s ratio(ν) can also be found by the use of this testing technique.In this test, a specimen is prepared suitable for gripping into the jaws of the testing machine type that will be used. The specimen used is approximately uniform over a gage length (the length within which elongation measurements are done.
OBJECTIVE
Tension test is carried out; to obtain the stress-strain diagram, to determine the tensile properties and hence to get valuable information about the mechanical behavior and the engineering performance of the material.
TESTING SYSTEM
The testing system consists of a tensile testing machine, a load cell, a power supply and an x-y recorder.
Testing Machine is of hydraulic type (Alşa Universal Testing Machine). It is a load-controlled machine.
Load Cell provides an electrical circuit for measuring the instantaneous load along the loading axis.
Power Supply is connected to load cell. It feeds the load cell, amplifies the output signal and displays the load.
Recorder plots the variation of load against time.
SPECIMEN
As mentioned previously, tensile specimens are machined in the desired orientation and according to the standards.The central portion (gage portion) of the length is usually of smaller crosssection than the end portions. This ensures the failure to occur at a section wherethe stresses are not affected by the gripping device. The gage length is marked and elongation is measured between these markings during the test.
PROCEDURE
Before the test
1. Put gage marks on the specimen
2. Measure the initial gage length and diameter
3. Select a load scale to deform and fracture the specimen. Note that that tensile strength of the material type used has to be knownapproximately.
During the test
1. Record the maximum load 2. Conduct the test until fracture.
After the test
3.2 COMPRESSION TEST
Compressive strength is the capacity of a material or structure to withstand loads tending to reduce size. It can be measured by plotting applied force against deformation in a testing machine. . Compressive strength is a key value for design of structures.
When a specimen of material is loaded in such a way that it extends it is said to be in tension. On the other hand if the material compresses and shortens it is said to be in compression.
Compressive strength is measured on materials, components, and structures. By definition, the ultimate compressive strength of a material is that value of uniaxial compressive stress reached when the material fails completely. The compressive strength is usually obtained experimentally by means of a compressive test. The apparatus used for this experiment is the same as that used in a tensile test. However, rather than applying a uniaxial tensile load, a uniaxial compressive load is applied. As can be imagined, the specimen (usually cylindrical) is shortened as well as spread laterally.In a compression test, there is a linear region where the material follows Hooke's Law. Hence for this region where this time E refers to the Young's Modulus for compression. In this region, the material deforms elastically and returns to its original length when the stress is removed. This linear region terminates at what is known as the yield point. Above this point the material behaves plastically and will not return to its original length once the load is removed.By its basic definition the uniaxial stress is given by:
where, F = Load applied [N], A = Area [m2]
Stress is defined as the force divided by the area at the start of the experiment. This is known as the engineering stress and is defined by,
A0=Original specimen area [m2]
Correspondingly, the engineering strain would be defined by:
where l = current specimen length [m] and l0 = original specimen length [m]
The compressive strength would therefore correspond to the point on the engineering stress strain
curve defined by
where F* = load applied just before crushing and l* = specimen length just before crushing.
3.3 HARDNESS TEST:
Hardness is a characteristic of a material, not a fundamental physical property. It is defined as the resistance to indentation, and it is determined by measuring the permanent depth of the indentation. The Brinell hardness test method as used to determine Brinell hardness, is defined inASTM E10. . Brinell testing often use a very high test load (3000 kgf) and a 10mm wide indenter so that the resulting indentation averages out most surface and sub-surface inconsistencies.
given length of time. Typically, an indentation is made with a Brinell hardness testing machine and then measured for indentationdiameter in a second step with a specially designed Brinell microscope or optical system. The resulting measurement is converted to a Brinell value using the Brinell formula or a conversion chart based on the formula. Most typically, a Brinell test will use 3000 kgf load with a 10mm ball. If the sample material is aluminum, the test is most frequently performed with a 500 kgf load and 10mm ball. Brinell test loads can range from 3000 kgf down to 1 kgf. Ball indenter diameters can range from 10mm to 1mm. Generally, the lower loads and ball diameters are used for convenience in “combination” testers, like Rockwell units, that have a small load capacity. The test standard specifies a time of 10 to 15 seconds, although shorter times can be used if it is known that thE shorter time does not affect the result. There are other conditions that must be met for testing on a round specimen, spacing of indentations, minimum thickness of test specimens, etc
. 3.4 WEAR TEST:
Immediately prior to testing, and prior to measuring orweighing, clean and dry the specimens. Take care to remove alldirt and foreign matter from the specimens. Use non-chlorinated,non-film-forming cleaning agents and solvents. Dry materials with open grains to remove all traces of thecleaning fluids that may be entrapped in the material. Steel(ferromagnetic) specimens having residual magnetism shouldbe demagnetized. Report the methods used for cleaning.
Measure appropriate specimen dimensions to the nearest 2.5 μm or weigh the specimens to the nearest 0.0001
g
Insert the disk securely in the holding device so that the disk is fixed perpendicular (61°) to the axis of the resolution.
Insert the pin specimen securely in its holder and, if necessary, adjust so that the specimen is perpendicular (61°) tothe disk surface when in contact, in order to maintain thenecessary contact conditions.
Add the proper mass to the system lever or bale to develop the selected force pressing the pin against the disk. Start the motor and adjust the speed to the desired valuewhile holding the pin specimen out of contact with the
disk.Stop the motor.
Set the revolution counter (or equivalent) to the desired number of revolutions. Test Method Illustration
D = Ball diameter d = impression diameter F = load
HB = Brinell result
Begin the test with the specimens in contact under load.The test is stopped when the desired number of revolutions isachieved. Tests should not be interrupted or restarted.
Remove the specimens and clean off any loose wear debris. Note the existence of features on or near the wear scarsuch as: protrusions, displaced metal, discoloration, microcracking,or spotting.
Remeasure the specimen dimensions to the nearest 2.5 μm or reweigh the specimens to the nearest 0.0001 g,
as appropriate
Repeat the test with additional specimens to obtain sufficient data for statistically significant results.
SPECIMENS:
Before machining: After Testing:
After machining:
For wear test:
IV. RESULTS
4.1 TENSILE TEST RESULTS:
130 135 140 145 150 155
140 154
146
138
Te
n
si
le
St
re
n
gt
h
(M
P
a)
Percentage of reinforcements
LM25
LM25+10%SiC
LM25+5%SiC+5%AC
LM25+10%AC
4.2 COMPRESSION TEST RESLUTS:
180 185 190 195 200 205
193
203
198
188
C
o
m
p
re
ss
io
n
s
tr
en
gt
h
(M
P
a)
Percentage of reiforcement
LM25
LM25+10%SiC
LM25+5%SiC+5%AC
LM25+10%AC
From the above chart it is evident that for the combination of Al & 10%SiC the Compression Strength has increased, for the combination of Al & 10% AC the Compression Strength has decreased and for the combination of Al + 5%SiC + 5%AC the Compression Strength is in between of Al+10%SiC and Al+10%AC and still better than LM25.
4.3 HARDNESS TEST RESLUTS:
4.4 WEAR TEST RESULTS:
From the above chart it is evident that for the combination of Al & 10%SiC the wear rate has been slightly decreased, for the combination of Al & 10% AC the wear rate has been decreased and for the combination of Al + 5%SiC + 5%AC the wear rateis in between of Al+10%SiC and Al+10%AC.
V. CONCLUSION
The production and evaluation of properties of MMC’s were done according to the standards. From the study it is seen that the Activated Carbon and Silicon Carbide can be used for the production of composites and can provide good results for many applications.
The following observations were made:
The tensile strength of the composite materials increases with increase in SiC and decreases with increase in activated carbon reinforcements.
The compression strength of the composite materials increases with increase in SiCand decreases with increase in activated carbon reinforcements.
The hardness strength of the composite materials increases with increase in SiCand decreases with increase in activated carbon reinforcements.
The wear resistance of the composite material is better in activated carbon as reinforcement.
REFERENCES
1. Studies on Mechanical Properties and Tribological Characteristics of LM25- Graphite- Silicon Carbide and LM25-Flyash- Silicon Carbide - Hybrid MMC’s Basavaraju.S ,Arasukumar.K, Dr.ChandrashekharBendigeri,Dr.C.K.Umesh -November 2012
a. www.ijrset.com
2. Mechanical properties of silicon based aluminium alloy November 2012,CMJ University, Shillong, Meghalaya, INDIA www.vsrdjournals.com 3. Microstructural and wear behavior of hypoeutectic Al–Si alloy (LM25) grain refined nd modified with Al–Ti–C–Sr master alloy, A.K.
PrasadaRao, K. Das, B.S. Murty , M.
4. Chakraborty , Indian Institute of Technology, Kharagpur, India www.elsevier.com
5. Evaluation of mechanical Properties of al 7075-fly ash ,Composite material Deepak singla, s.r.mediratta , YIET/KUK, Jagadhri (Yamunanagar), Haryana, India
6. Microstructure, Mechanical properties and Dry Sliding Wear behaviour of Al-Si-Mg alloyReinforced with Graphite Amith.D.Gangadhar, M.H.Annaiah, T.G. Rajiv, Manjunatha B, Harendrakumar H.V , April 2013
7. Mechanical properties and Dry sliding wear Behavior of A2014 reinforced with Alumina, april 2013
8. Surface roughness prediction model in end milling of Al/SiCp MMC by carbide tools R. Arokiadass, K. Palaniradja, N. Alagumoorthi,Department of Mechanical Engineering, Pondicherry Engineering Collegewww.ijest-ng.com.
9. Composite material-aluminium silicon alloy: a Review M. Dave, k. D. Kothari, RK 10. university, Rajkot Gujrat , India,.