Business Process Modeling
as a means to bridge
The Business-IT Divide
Martin Devillers
Master’s Thesis
Information Sciences
Radboud University Nijmegen
Supervisors Dr. Stijn Hoppenbrouwers
Hidde Andriessen Gert Jan Timmerman
Thesis Number 156IK Martin Devillers
Version 1.3 Aug 2011
ii
“All models are wrong, some are useful”
iii
Preface
This Master’s thesis is the result of six months of research performed by me, Martin Devillers, as part of my internship at Info Support and my thesis for the Information Sciences Master of the Radboud University Nijmegen.
I would like to extend a word of thanks to the various organizations and people who in some manner have made a contribution to my research. I would like to thank the following organizations:
Radboud University Nijmegen, for providing me with an adequate education, thus granting me
with a vast amount of theoretical knowledge, which formed the bedrock of my research.
Info Support, for accepting me as an intern and providing the appropriate resources required by
me to perform my research.
I would like to thank three people for their involvement in my endeavors:
Stijn Hoppenbrouwers, my supervisor at the Radboud University Nijmegen, for his guidance
during the research project. His insight into conceptual modeling and group model building helped me considerably in my research.
Hidde Andriessen, my principal at Info Support, for providing the original assignment and the case which instigated my research. Contrary to what I expected, Hidde was more interested in the theoretical subjects underlying his case, than an actual solution. This motivated me to take a highly theoretical and explorative approach towards my research.
Gert Jan Timmerman, my technical supervisor at Info Support, for his excellent feedback and the numerous hours we spent on discussions. His perspectives on language and knowledge management helped me considerably in my research. But perhaps more importantly, meeting Gert Jan has taught me that commercial organizations can too be a place for scientists.
Lastly, I would like to reflect on the research process itself. Clearly, the focus of my attention with respect to the research topic shifted considerably over the six months. It would appear that as my knowledge of business process modeling and related topics expanded, the things I would write one day would seem wrong or irrelevant the next. Due to my perfectionist nature, I was not content to write anything I did not fully stand by nor did not entirely understand. As a result, I spent a significant time reading papers and writing text only to end up discarding my results. While at the time I found this lack of progress to be rather dissatisfying, I now realize that it was necessary and in all likelihood unavoidable. Although I do not intend to join the research community after I have finished my masters, I have gained an appreciation for the struggle scientists undergo in a world where there is vastly more knowledge available than any man could ever comprehend.
iv
Abstract
A great number of business process modeling endeavors aim to create representations of business processes which can be translated to computer software by IT stakeholders while remaining understandable to business stakeholders. However in practice, business process models rarely meet these high demands, leading either to models which are too informal to be interpreted by a computer or to models which are incomprehensible to business stakeholders. Our research attempts to assess why these problems occur and whether it is fundamentally feasible to create models that meet these demands.
Although the topic of business process modeling has received great attention from the research community, most of this attention is focused on the formal aspects of these models, such as computer simulation or mathematical properties. In contrast, little research addresses the informal aspects of these models, such as their accuracy in representing the real world business processes they are based on. We argue that these informal aspects play a pivotal role in creating a shared understanding of business processes among business and IT stakeholders.
We performed a two phase research in order to answer the question whether business process modeling can serve as a common language between business and IT stakeholders. The first phase is of a philosophical nature as it addresses a wide range of theories. These include the historic business-IT alignment problem, theories on language, conceptual modeling and generic system design principles. The second phase is of an empirical nature as it focuses on a case study of a real world BPM project. The study reveals a series of problems which we subsequently generalized using our theories gathered during the first phase. This allows us to not only produce a list of generic issues currently affecting BPM projects, but also to explain why these issues occur and how they can be avoided.
Most notably, our research reveals how the different manner in which business and IT stakeholders create and interpret business process models can lead to misunderstandings. Additionally, our results show that the influence of the IT discipline on BPM actually inhibits the development of business friendly modeling languages. We argue that if BPM is to truly become a management discipline, the focus should be placed on the usability of process modeling for the business, rather than IT.
v
Table of Contents
1 Introduction ... 1
2 Theoretical background ... 3
2.1 Business process management ... 3
2.2 Business process modeling ... 4
2.2.1 Flowchart ... 4
2.2.2 Petri net ... 5
2.2.3 Unified Modeling Language ... 6
2.2.4 Role Activity Diagrams ... 7
2.2.5 Event-driven Process Chains ... 8
2.2.6 Integrated Definition for Functional Modeling ... 9
2.2.7 Business Process Modeling Notation ... 11
2.3 Business-IT alignment ... 13 2.4 Language Theory ... 13 2.4.1 Natural language ... 13 2.4.2 Artificial language ... 14 2.5 Conceptual Modeling ... 14 2.5.1 Ontological Expressivity ... 14 2.5.2 Functional Decomposition ... 15 2.6 Abstraction ... 16
2.7 System Design Principles ... 16
2.7.1 Modularity ... 16
2.7.2 Separation of Concerns ... 17
2.7.3 Single Responsibility Principle ... 17
2.7.4 Single Point of Entry ... 18
2.7.5 Ad-hoc Polymorphism ... 18
2.7.6 Information hiding ... 19
3 Fundamental topics ... 20
3.1 Natural language versus formal language ... 20
3.1.1 Experience ... 20
3.1.2 Syntax, Semantics & Pragmatics ... 20
3.1.3 Purpose ... 21
3.1.4 Expressiveness ... 22
3.2 Ambiguity in languages... 23
3.3 Abstraction ... 24
3.3.1 Leaky abstraction ... 24
3.3.2 Conceptual abstraction vs. Scoping abstraction ... 25
3.4 Application of System Design Principles ... 25
vi
3.4.2 Separation of Concerns ... 26
3.4.3 Single Responsibility Principle ... 27
3.4.4 Single Point of Entry ... 28
3.4.5 Ad-hoc Polymorphism ... 29
3.4.6 Information hiding ... 29
3.5 Conflicting principles ... 30
3.5.1 Separation of Concerns versus Single Responsibility Principle ... 30
3.5.2 Single Point of Entry versus Ad-hoc Polymorphism ... 31
4 Case study ... 32 4.1 Outline ... 32 4.1.1 The Business ... 32 4.1.2 The Architect ... 33 4.1.3 The Technicians ... 33 4.2 Model analysis... 34
4.2.1 Large Poster – First Version ... 34
4.2.2 Large Poster – Second Version ... 36
4.2.3 Large Poster – Third Version ... 38
4.2.4 BPMN Model ... 39 4.3 Conclusions ... 42 4.3.1 Definition of overview ... 42 4.3.2 Suitability of flowcharts ... 43 4.3.3 Suitability of BPMN ... 44 4.3.4 Purpose of modeling ... 44 4.3.5 Types of abstraction ... 45 5 General issues ... 46
5.1 Conflicting mindsets of involved stakeholders ... 46
5.2 Conflicting goals of business process modeling ... 46
5.3 Fallacy of imperative reductionism ... 47
5.4 Novice modelers versus expert modelers ... 48
5.5 Quality of abstraction ... 48
5.6 Scientific approach versus business approach ... 49
5.7 Lack of standard business process modeling language ... 49
5.8 Lack of adequate tool support ... 50
5.9 Presence of technical details in business process models ... 50
5.10 False expectations of BPM projects ... 52
6 Discussion & Future Work ... 53
7 Conclusion ... 54
vii
Table of Figures
Figure 1 - BPM life-cycle ... 4
Figure 2 - Flowchart of a person watching TV ... 5
Figure 3 - Petri net of two traffic lights ... 6
Figure 4 - UML activity diagram of an ordering process ... 6
Figure 5 - RAD diagram of an article’s lifecycle ... 7
Figure 6 - EPC diagram of an ordering process ... 8
Figure 7 - IDEF0 diagram of a furniture construction process ... 10
Figure 8 - IDEF3 diagram of an odering process ... 11
Figure 9 - BPMN diagram of an ordering process ... 12
Figure 10 - Four ontological deficiencies of a modeling language ... 15
Figure 11 - Two examples of coupling ... 17
Figure 12 - Two examples of cohesion ... 18
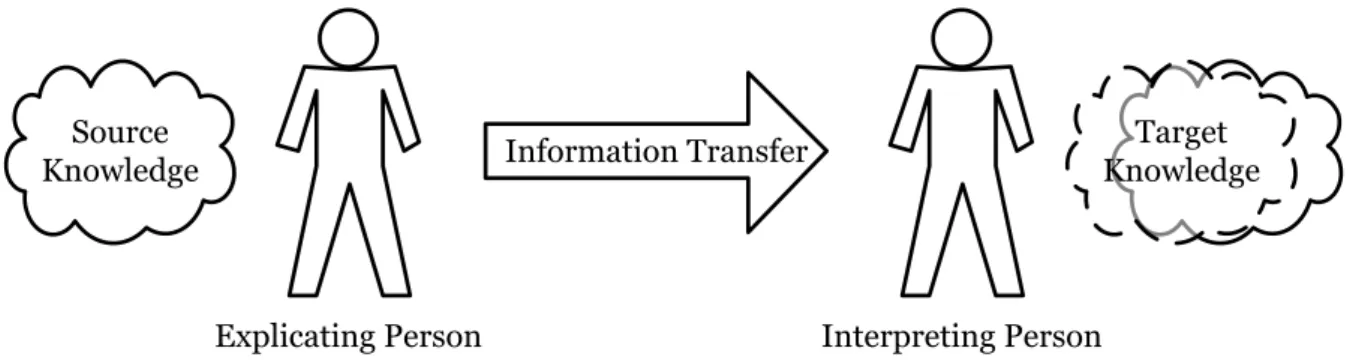
Figure 13 - Transferring knowledge using language ... 23
Figure 14 - Example of Separation of Concerns in flowcharts ... 26
Figure 15 - BPMN diagram of the 'Send Invoice' sub-process ... 28
Figure 16 - BPMN diagram of the 'Create Invoice' sub-process ... 28
Figure 17 - Three uses of sub-processes in BPMN ... 28
Figure 18 - BPMN diagram of a customer complaint process. ... 29
Figure 19 - Overlapping business processes in a BPMN diagram ... 31
Figure 20 - First version of the large poster ... 35
Figure 21 - Two examples of flowchart anti-patterns ... 36
Figure 22 - Second version of the large poster ... 37
Figure 23 - Third version of the large poster ... 39
Figure 24 - Trigger with multiple inbound and outbound flows ... 39
Figure 25 - Root diagram of the BMPN model ... 40
Figure 26 - Hierarchical view of the various BPMN diagrams ... 41
Figure 27 - Incorrect use of basic BPMN constructs ... 41
Figure 28 - Combination of flowchart notation and colored rectangles ... 43
1
1
Introduction
Business process management (BPM) is an increasingly important topic for large organizations. Business process-awareness is at an all-time high and contemporary organizations invest considerable effort in BPM projects in order to attain enterprise operational efficiency [1]. Despite the great attention BPM has received both from the business world and the research community, organizations are still unable to fulfill their demand for expert knowledge in BPM projects. Both BPM projects and BPM as a research topic are associated with a degree of uncertainty and there exists much quarrel in the BPM community. To illustrate, at the time of writing there is still no generally accepted consensus on what BPM actually stands for or what it encompasses [2]. The lack of a solid theoretical foundation for BPM is one of the primary motivators for our research [3].
A core element of BPM is the so-called business process model1, which is a systematic description
of a business process generally in the form of a series of activities. According to Ould [4], there are three goals one tries to achieve with a business process model. To each goal, we assign a certain level of modeling effort, which we define as the time, methodological knowledge, technical support and stakeholder commitment required to achieve the desired goal. The three goals, in order from minimal modeling effort to maximal modeling effort are:
Description, with the purpose of facilitating shared understanding amongst business
stakeholders and to achieve consensus on the manner of which a business accomplishes its goals.
Analysis, with the purpose of improving a business process in order to increase efficiency of the
overall organization. Process models created for this purpose are generally measurable in some way (e.g. measuring the throughput of a production process or the average time required to complete an ordering process).
Enactment, with the purpose of providing direct IT support to a business process. Process
models that have been created for this purpose can either be directly executed by a process engine, translated into a machine executable model or used as a basis for software development [5].
While the first and second goal can certainly lead to organizational benefits, most BPM projects aim to achieve the third goal. In fact, the BPM approach originally focused on the automation of business processes. In this context, the inception of business process modeling can be seen as an attempt to create a common language between business and IT stakeholders. Our research focuses on whether this goal has been achieved, which also constitutes our main research question:
Can business process modeling serve as a common language between business and IT stakeholders?
In order to answer this question, we conducted a two phase research. In the first phase, we examine the various theoretical principles underlying our main research question, while in the second phase we examine the problems currently present in BPM projects. The first phase of our research opens with an exploration of existing business process modeling languages:
What business process modeling languages currently exist, what are their origins and in what manner do they represent business processes?
Answers to this question helps to shape the context of the problem we are attempting to solve by examining the current state of affairs.
1 Be aware that the acronym BPM refers to business process management and not business process
2 Next, we give a short summary of the business IT alignment problem, although we assume that the reader already possess a basic understanding of this dilemma. We will make the assumption that the business IT alignment problem is essentially a language problem: Business stakeholders emphasize natural language, while IT stakeholders emphasize artificial language, thus hindering successful communication. With this assumption in mind, we attempt to answer the following question:
How do natural language and artificial languages assist in the understanding and representation of business processes?
Answers to this question aids in building an understanding of the language problem and assessing whether it is feasible to create a common language for business and IT stakeholders. The theory of languages is followed by the theory of conceptual modeling. These help to understand how the modeling activity shapes the business process:
How does conceptual modeling assist in the design of business processes?
The first phase of our research is concluded by a listing of system design principles and the application of these principles to the design of business processes. Moreover, it is shown that business process modeling can be used as a means to measure the successful application of these principles.
What system design principles exist and can these be applied to the design of business processes?
In the second phase of our research, we performed a case study in order to assess the problems in real world BPM projects. The empirical findings of the case study are combined with the theoretical findings of the first phase to produce a listing of generic issues that hinder business process modeling. Based on these issues, we draw our final conclusion on whether business process modeling has been successful in bridging the business-IT divide.
Answers to these questions will form the basis for a set of guidelines that business users can follow to create higher quality business process models. As these models are at the heart of most BPM projects, modeling improvements will consecutively benefit all stakeholders involved with the BPM project. Moreover, we hope to spread awareness of the fundamental issues associated with business process modeling in order to prevent future BPM projects from falling into common business process modeling pitfalls.
The remainder of this thesis is structured as follows: Chapter 2 provides a series of theories, which are subsequently applied to business process modeling in chapter 3. Chapter 4 provides a description and analysis of our case study, which lead to the listing of generic issues in chapter 5. To reiterate, chapter 2 and 3 represent the first phase of our research, while chapter 4 and 5 represent the second phase of our research. Chapter 6 provides the discussion of our research and chapter 7 provides the most prominent conclusions of our research.
3
2
Theoretical background
An elaboration of the various theoretical topics involved in our research will be provided in this chapter. The topics we will discuss are business process management, business process modeling, business-IT alignment, language theory, conceptual modeling, abstraction and system design principles.
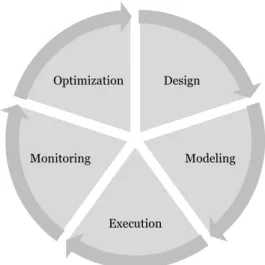
2.1Business process management
Business process management (BPM) is a systematic approach towards the definition, execution, management and refinement of business processes. A business process is a collection of activities or tasks that produce a specific service or product, generally involving both human interaction and computer applications.
All BPM activities can be attributed to one of the five phases of the BPM lifecycle:
Design phase, during which existing business processes are identified and future business
processes are designed. It is not uncommon for many stakeholders to be involved in this phase as business processes can be interdepartmental or even inter-organizational. Typical information required for the identification of business processes are tasks, quantifiable deliverables (e.g. documents), responsibilities, computer systems and required resources.
Modeling phase, during which the information gathered during the design phase is made explicit
in a business process model. These models are usually created with elaborate modeling tools, using a standard for business process modeling, such as the Business Process Modeling Notation (BPMN) and subsequently stored in a so-called modeling repository.
Execution phase, during which computer applications are deployed to support the automation of
the business process. In traditional organizations, there are many computer applications that each perform a specific task. These applications are not unaware of each other’s existence nor are they aware of the context in which they are used. Business process orchestration attempts to connect these applications by a main application, which is aware of the business process [6]. In addition, more recent developments of BPM technology aim to use the business process model itself as a basis for automation. By formalizing the business process model, it can be interpreted and subsequently executed by a so-called business process engine. This approach allows computers to be aware of the actual business process as it is executed, which in t urn enables a variety of advantages to the business.
Monitoring phase, during which the performance of the implemented business processes is
measured. The depth of the analysis depends on what BPM technologies were implemented during the execution phase. When a feature rich BPMS is used, one can measure process performance both at the global level and at the instance level. This information can subsequently be aggregated and displayed in comprehensive monitoring dashboards, which give managers quantifiable real-life data of the performance of their business. When this degree of rigor is employed during the monitoring phase, the act of monitoring becomes a goal by itself, which is also known as business activity monitoring.
Optimization phase, during which business processes are optimized based on the findings of the
monitoring phase. These optimizations may lead to the redesign of existing business processes or the design of additional business processes. As a result, the optimization phase can be the initiator of a new design phase, thus completing the BPM life-cycle.
4 The five phases of the BPM life-cycle shown in figure
1 form a never-ending loop, known as the continuous process improvement cycle. The modeling phase is, for obvious reasons, of great interest to our research, but another important phase is the design phase. As we will show, modeling can be a design activity by itself and designs tend to change when the modeling activity becomes involved.
In other words, design influence model and model influence design. Because of this, the distinction between what activities relate to the design of the business process and what relate to the modeling of the business process is not always clear. Indeed, alternative versions of the BPM life-cycle exist, which describe the design and modeling phase as one.
2.2Business process modeling
Business process models play a pivotal role in the business process management discipline. There are many modeling methodologies available which can be used to model business processes. Some of these methodologies have been specifically designed for this purpose, while others predate the BPM discipline and have been adapted for this purpose. Regarding the three goals of process modeling (i.e. description, analysis and enactment), most methodologies tend to be suitable for only one of the three goals, but not all three.
The great diversity of business process modeling languages has already leaded to researchers attempting to chart all these languages [7]. Particularly, a research done by Hafedh Mili et al. gives an excellent overview of these languages [8]. We will provide a less elaborate overview and only describe those languages that have played an important role in business process modeling. The following languages will be covered: Flowchart, Petri net, Unified Modeling Language, Role Activity Diagram, Event-driven Process Chain, Integrated Definition for Function Modeling and Business Process Management Notation.
2.2.1Flowchart
A flowchart is a diagram that represents a process as a sequence of activities and decisions. Flowcharts are the oldest and most basic process related modeling methodology known, with their first reported occurrence dating back to the early twenties, where they were used by mechanical engineers to describe machine behavior.
Basic flowchart constructs are activities, decisions, start points and end points. These are the basic building blocks typically used to represent processes. More advanced flowcharts use data -flow constructs (e.g. documents or machine input/output) to denote what information flows throughout the process. Relationships in a flowchart are denoted by arrows which indicate a flow of control from one element to another. All elements in a flowchart are either directly or indirectly connected to one and another.
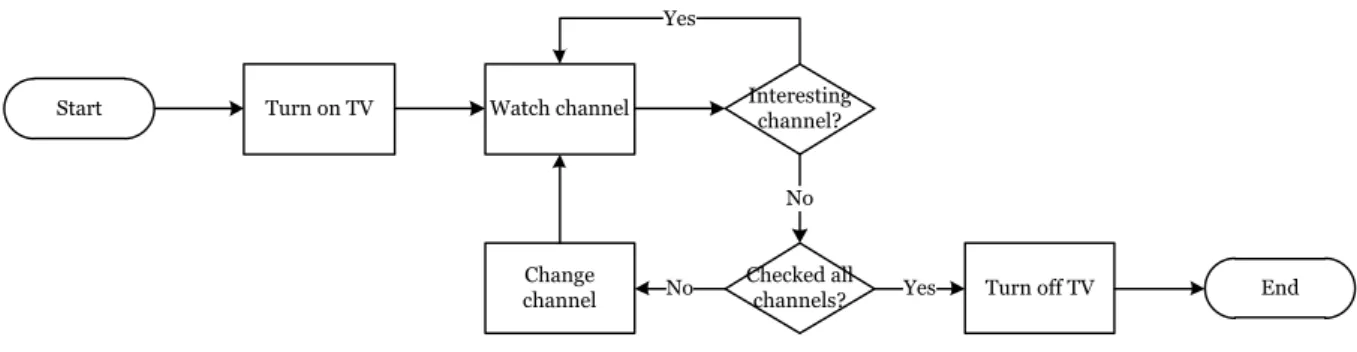
Figure 2 shows an example of a flowchart of a person watching TV. The process starts with the person turning on the TV, after which he observes the channel the TV is on. As long as the channel remains interesting, the person will continue to view that channel. When he is no longer interested in the channel, he can choose to switch the channel, granted there are any channels left which he has not seen. When all channels have been checked, the TV is turned off and the process ends.
Design Modeling Execution Monitoring Optimization Figure 1 - BPM life-cycle
5
Figure 2 - Flowchart of a person watching TV
Besides the simple set of constructs, flowcharts offer little to none methodological support. There are some commonly agreed on best-practices for designing flowcharts (e.g. limit crossing arrows), but guidelines for the application of flowcharts differ greatly.
With respect to business process modeling, flowcharts are often used as a sketching tool dur ing the earlier phases of the model development. The intuitiveness of flowcharts makes it an ideal tool for quickly charting processes in meetings or workshops.
2.2.2Petri net
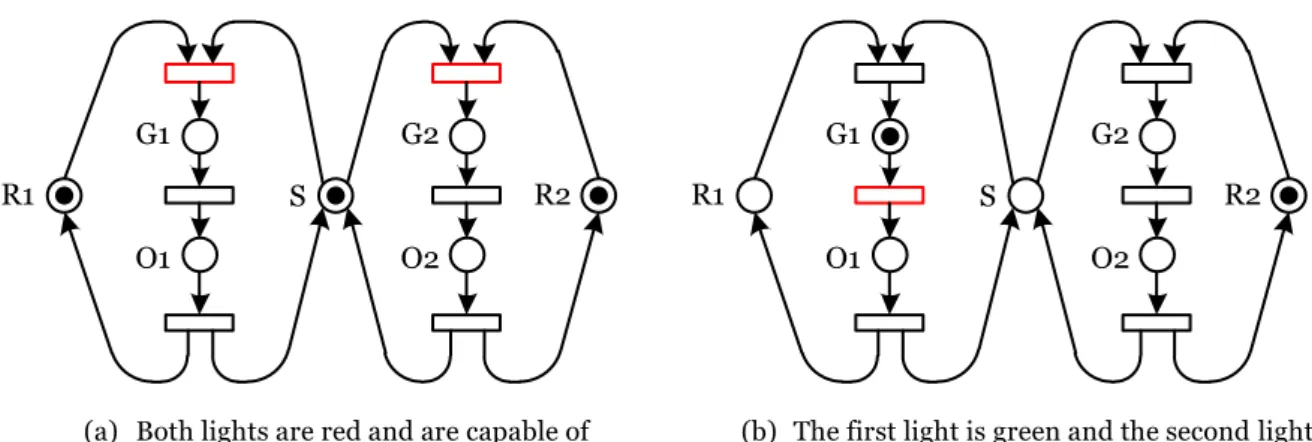
A Petri net is a formal modeling language for the description of concurrent processes. Carl Adam Petri invented the graphical notation of Petri nets in 1939 for the purpose of describing chemical processes, while the concept of Petri nets as we know them today would not be introduced by him until the early sixties. Unlike other methodologies, Petri nets have a strict mathematical definition of their execution semantics, which means that all well-formed Petri nets can be interpreted and executed by a machine. Whereas most other methodologies focus on representing the structure of a process, Petri nets focuses on the actual behavior of a process. Moreover, the mathematical basis of Petri nets makes them suitable for various kinds of automated analysis.
A Petri net consists of places and transitions, which are connected by arrows, otherwise known as directed arcs. One place may have multiple arcs running to distinct transitions and one transition may have multiple arcs running to distinct places. However, no arcs may ever run directly between places or transitions. Places can contain zero or more tokens which indicate the state of the place. When all the incoming arcs of a transition are connected to places that each has at least one token, the transition may fire. A firing transition will remove one token from each place connected to every incoming arc and add one token to each place connected to every outgoing arc. Note that when a transition meets the conditions to fire, it does not necessarily have to. Nor can the order of firing be determined when multiple transitions meet this condition. As a result, the execution of Petri nets is non-deterministic.
Figure 3 shows an example of two traffic lights on an intersection using Petri nets. Places R1, G1 and O1 denote the three states of the first traffic light (i.e. red, green and orange). Similarly, the states of the second traffic light are represented with the places R2, G2 and O2. Place S is used to restrict the behavior of the traffic lights, in order to prevent both lights from being green or orange at the same time. Figure 3(a) shows the state of the traffic lights when they are both red. There are two transitions which meet the preconditions for firing and these are denoted by a red color. These transitions allow either traffic light to move from the red state to the green state. Figure 3(b) shows the state of the Petri net after the first traffic light has turned green. Note that the only valid transition in this state is for the first traffic light to turn orange, while the second traffic light is no longer capable of turning green.
Although Petri nets have made great contributions to the field of computer science, their application in other disciplines, such as workflow management, has only recently gained attention. With respect to business process modeling, Petri nets have been used to translate non-formal process models into formal process models for the purpose of analyzing or simulating these processes [9], [10].
Start Turn on TV Watch channel Interesting channel?
Checked all channels? Change channel No No Yes Turn off TV Yes End
6
(a) Both lights are red and are capable of transitioning to green
(b) The first light is green and the second light can no longer turn green
Figure 3 - Petri net of two traffic lights
2.2.3Unified Modeling Language
The Unified Modeling Language (UML) is a general-purpose modeling language originally designed to be used in the field of object-oriented software engineering. UML is a standard which is actively managed by the Object Management Group (OMG). At the time of writing, the latest formally released version of UML is 2.3. The most recent version of UML specifies fourteen different diagrams, of which the Activity Diagram is the most used diagram for business process modeling.
An UML Activity Diagram consists of action nodes, object nodes and control nodes. An action node is the fundamental unit of behavior specification present in many UML diagrams. In the context of an activity diagram, an action represents some measurable piece of work which should be accomplished by a person or a computer. Object nodes represent the information which is consumed or produced by an action. From a functional perspective, an action is a transformation from a set of input objects to a set of output objects. Control nodes describe some aspect of the flow of control. Important control nodes are initial nodes, final nodes, decisions, forks and joins. The initial and final nodes represent the start and end of an activity diagram. Decisions are used to direct the control flow based on some information. Forks and joins can be used to split and merge the control flow in order to represent parallel processes [11].
There are two other important features of UML Activity Diagrams which are swimlane partitions and sub-activities. Swimlane partitions can be used to group actions on some common characteristic. Sub-activities can be used to aggregate an activity diagram into a single activity for use in other activity diagrams. Sub-activities facilitate composition and decomposition in activity diagrams.
Figure 4 shows an example of an UML activity diagram of an ordering process. The goal of the ordering process is to fulfill orders, ship products and perform billing tasks. A fork is used to represent that the billing tasks are ran in parallel with order fulfillment and shipping. A decision is used to represent that priority orders are shipped overnight, while all other orders are shipped using regular delivery. When the products have been shipped and the customer has paid the invoice, the order is closed and the process ends.
Figure 4 - UML activity diagram of an ordering process
R1 G1 O1 G2 O2 R2 S R1 G1 O1 G2 O2 R2 S Receive Order Fill Order
Send Invoice Receive Payment Overnight Delivery
Regular Delivery [priority order]
[else]
7 Although the original purpose of UML was to assist the design of object-oriented software systems, more recent versions of UML have broadened its view to systems in general. Particularly, UML Activity Diagrams have been extended with several constructs that are attuned towards the organizational context [12]. While UML was never developed with the goal of business process modeling in mind, it has been used for this purpose extensively. The main motivators for process analysts to use UML are its great popularity, the large breadth of both methodological support and tooling support, the generic applicability of UML for conceptual modeling and UML’s native support for extension with custom constructs. In other words, UML is an accepted and well documented general purpose modeling language.
2.2.4Role Activity Diagrams
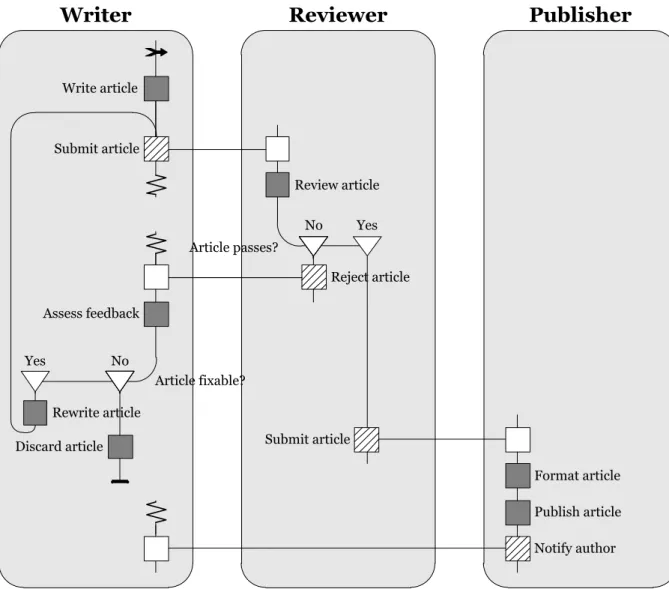
A Role Activity Diagram (RAD) is an element of the STRIM business process modeling methodology developed by Praxis Plc. for the elicitation, modeling and analysis of business processes [8]. As the name suggests, RAD are very similar to UML activity diagrams, with the main differences being that RAD emphasizes responsibilities, while UML activity diagrams emphasizes orchestration of the activities (e.g. aspects regarding the sequential or parallel execution of activities).
The primary constructs used in a RAD are roles, actions, interactions and decisions. Roles contain the actions and decisions that are performed by the man or machine with the assigned role. The interaction construct allows a role to communicate with another role, which also constitutes the only way how a relationship can be established between roles.
Figure 5 - RAD diagram of an article’s lifecycle
Writer
Reviewer
Write articlePublisher
Review article Yes No Reject article Assess feedback Yes No Rewrite article Discard article Submit article Article fixable? Article passes? Submit article Format article Notify author Publish article8 Figure 5 shows an example of a Role Activity Diagram describing the end-to-end lifecycle of an article. The three large grey rectangles with the rounded corners represent the three roles involved with the lifecycle. The process starts with a writer who creates an article. When the article is deemed finished by the writer, it is submitted to a reviewer for approval.
The reviewer can either reject or approve the article. A rejected article is returned to the writer, who then uses the feedback to decide whether he wants to adapt the article or discard it. An adapted article enters the same review cycle as the written article, while a discarded article effectively ends the article’s lifecycle and thus the process. An approved article is submitted to the publisher, who formats and publishes the article. The author of the article is notified of the article’s publishing.
Note that there is an implicit timeline present in the diagram, as actions at the bottom are generally performed at a later point in time than actions at the top. Interactions are always denoted by horizontal lines as they represent synchronization moments where two or more roles come together and actively exchange information.
There are no formal semantics underlying a RAD as these models are aimed at facilitating shared understanding among stakeholders, rather than providing a basis for process simulation or execution. However, some research has aimed to formalize RADs by translating them to other representations such as Petri Nets in order to perform simulations [13], [14].
2.2.5Event-driven Process Chains
An Event-driven Process Chain (EPC) is a business process modeling methodology aimed at creating business understandable models. Professor August-Wilhelm Scheer of the Saarland University developed the EPC method in 1992. Since its creation, the EPC method has grown to become one of the more popular business process modeling methodologies.
The core EPC constructs are events, functions and logical connectors. Events represent the pre - and post-conditions of a function, while a function represents an activity performed within the organization. Events are passive in the sense that they represent a state, whereas functions are active as they represent a transformation from one state to another. An EPC always starts and ends with an event. Both events and functions may only have one inbound and outbound relationship. Logical connectors are used to represent one-to-many relationships between events and functions.
An event cannot be preceded or succeeded by another event nor can a function be preceded or succeeded by another function. The latter constraint is generally ignored in practice as events between functions are often implicit.
Besides the core constructs, EPC also has several additional constructs which can be used to add additional information to the diagram. For instance, the organization unit construct can be used to represent which person or organization is responsible for the execution of a specific function.
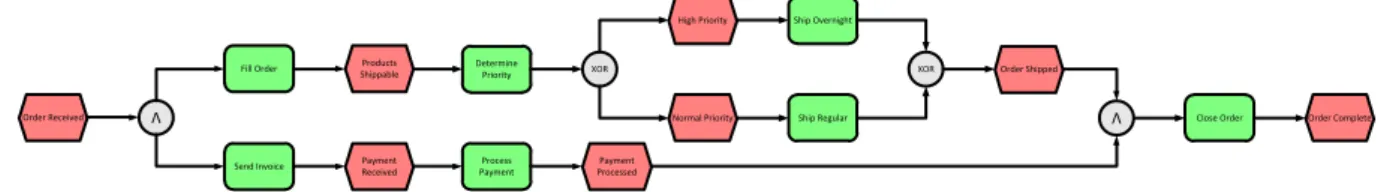
Figure 6 shows an example of an EPC diagram of an ordering process, similar to the one shown in figure 4. Note that the biggest difference lies in the explication of the events. Events start and end the process. Moreover, all functions are the consequence of one or more events and also cause one or more events to occur. This approach towards modeling the ordering process creates a balanced view between what states the process can be in and what activities are executed.
The emphasis on logical connectors and functions makes EPC seem technically oriented, while it is in fact aimed at the business stakeholders, rather than the IT stakeholders. There are only little formal semantics underlying EPC, although some research has been performed on formalizing EPC [15].
Figure 6 - EPC diagram of an ordering process
Order Received
Fill Order
V
Send Invoice Payment Received
V Products Shippable XOR Determine Priority Order Complete XOR Ship Overnight Ship Regular Process Payment Payment Processed Close Order Order Shipped High Priority Normal Priority
9 2.2.6Integrated Definition for Functional Modeling
The Integrated Definition for Functional Modeling (IDEF) is a series of modeling languages originally designed to be used in the field of software engineering. The first IDEF modeling language came into existence in the mid-seventies as a byproduct of the Integrated Computer-Aided Manufacturing program of the United States Air Force. Since then, the IDEF family has grown to a set of sixteen modeling languages, each addition simply named IDEF0, IDEF1 and so on. However, only the first five IDEF languages have matured into well-accepted modeling languages, while the rest were never developed any further than their initial definition.
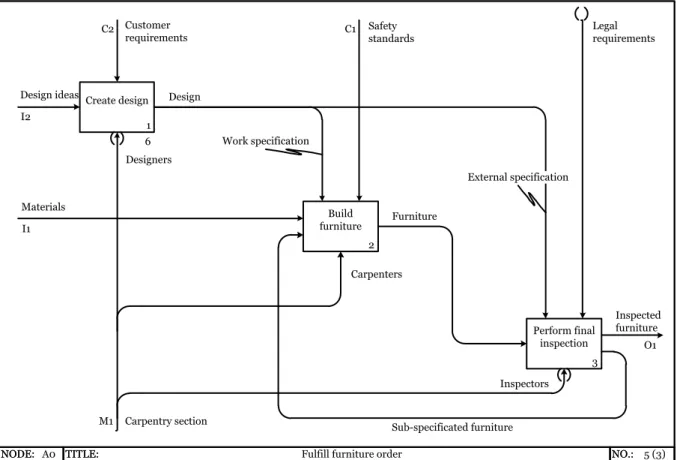
Of the sixteen modeling languages, IDEF0 and IDEF3 are the most suitable for business process modeling [16]. IDEF0 models business functions, while IDEF3 models business processes, so strictly speaking, IDEF3 is the only language of the IDEF family that is actually meant for business process modeling. In practice however, IDEF0 and IDEF3 are used to describe business processes, but from radically different viewpoints. Thus, the two languages should be considered complimentary rather than exclusive.
IDEF0
The IDEF0 modeling language has a limited syntax. In essence, everything is built upon the construct of a function. A function is an activity, similar to those used in flowcharts and EPC diagrams, which is represented by a rectangle. A function consumes input to produce some output. Additionally, a function is guided, regulated or constrained by controls and performed or executed by mechanisms. The output of one function can be the input, control or mechanism of another function. Inputs, controls, outputs and mechanisms (ICOM) are all represented by arrows which ar e connected to the function. Each ICOM arrow has a distinct side of the function rectangle to which it may connect. Input arrows connect at the left, control arrows connect at the top, output arrows connect at the right and mechanism arrows connect at the bottom [17].
Multiple functions in a diagram are ordered by dominance, with the most dominant function being placed at the top left of the diagram and the least dominant function being placed at the bottom right. A function dominates another function when it has more ICOM relationships leading to the other function than the other way around. This approach creates a cascading effect resulting in diagrams that have a waterfall like flow, which makes them easier to interpret.
Functional decomposition, on which we will further elaborate in 2.5.2, plays an instrumental role in IDEF0. All functions are always executed in a context, which is represented as the canvas on which the IDEF0 diagram is drawn. All inputs, controls and mechanisms which are not created by the functions within the diagram, originate from this context. Any function inside an IDEF0 diagram can be decomposed into a new diagram. In doing so, the ICOM of the function are mapped to the context of the new diagram. Numeric identifiers are used to cross-reference functions or ICOM arrows which appear in various diagrams.
Figure 7 shows an example of the order fulfillment of a furniture company. The process entails the creation of a design, the building of the furniture and the inspection of the built furniture. The ‘create design’ function transforms design ideas, the input, to actual designs of furniture, the output.
The designers are the mechanisms which execute the function, while the design process itself is controlled by the customer requirements. The designs which are the output of the design function are in turn used to control the building of the furniture. This shows that the output of a function does not have to be the input of another function, but can also serve as a control or mechanism.
From the perspective of functional decomposition, the diagram can be interpreted as a function called ‘Fulfill furniture order’, with the ICOM relationships I1, I2, C1, C2, M1 and O1. The parenthesis at the start of the control arrow called ‘Legal requirements’ indicate that the control does not appear in the parent diagram. This construction is called a ‘Tunnel in’. Likewise, the parenthesis at the end of the mechanism arrow called ‘Designers’ indicate that the mechanism does not appear in the decomposition of the ‘Create design’ function. This construction is called a ‘Tunnel out’.
10
Figure 7 - IDEF0 diagram of a furniture construction process
The number below the ‘Create design’ function reveals that the function is decomposed in diagram number 6.
Note that unlike all other modeling languages, an IDEF0 diagram does not describe a sequence of activities. The relationships between the various functions indicate their dependencies, which may imply a causal relation, but this does not necessarily have to. The lack of temporal sequencing is one of the main advantages of IDEF0 as it allows users to model what the business does without forcing them to explicate how the business accomplishes this. Unfortunately, the tendency for people to interpret an IDEF0 diagram as a flowchart is also one of its disadvantages. Moreover, not everyone is comfortable with IDEF0 abstracting away time itself as it makes the language less intuitive. The lack of sequencing was one of the main motivators for the creation of IDEF3.
IDEF3
IDEF3 focuses on the temporal aspect of business processes, which is in sharp contrast to IDEF0. Additionally, IDEF3 describes two different types of modeling languages. One for the purpose of describing process flows and one for the purpose of describing object state transitions. We will only cover the prior technique to limit our already lengthy description of IDEF.
Just like most other business process modeling languages, IDEF3 describes a business process as a series of activities. An activity is called a unit of behavior (UOB) and is represented by a rectangle. A causal relationship between two UOBs is called a precedence link and is represented by an arrow. Junctions can be used to split, join, branch and merge the control flow and are represented by small rectangles. The aforementioned constructs are the basic building blocks of IDEF3, which makes the language very similar to UML activity diagrams or EPC diagrams without the event construct.
Figure 8 shows an example of an IDEF3 process flow diagram of an ordering process. This example is based on the same example used in the UML activity diagram, shown in figure 4. Indeed, the diagram shows great similarities with the UML activity diagram and EPC diagram we covered.
1 6 Create design 2 Build furniture 3 Perform final inspection TITLE: NODE: NO.: Customer requirements C2 Design ideas I2 Materials I1 Design Safety standards C1 Legal requirements Inspected furniture O1 TITLE:
NODE: A0 Fulfill furniture order NO.: 5 (3)
Carpentry section Work specification External specification Furniture M1 Sub-specificated furniture Inspectors Designers Carpenters
11
Figure 8 - IDEF3 diagram of an odering process
Note that there are no constructs which indicate the start or end of the process. The shadow below the ‘Fill Order’ UOB indicates that the UOB has been decomposed into another diagram.
IDEF0 and IDEF3 have some unique characteristics when compared to the other modeling languages. Both IDEF languages emphasize semantics over an elaborate syntax, making the IDEF languages more formal than all the other languages. Both IDEF languages support the use of functional decomposition and encourage its use. In fact, the title block constructs act as a drawing canvas which constrains the drawing space, thus forcing one to use functional decomposition. Another advantage of this approach is that IDEF diagrams work well on paper as the title block constructs are usually the size of a standard A4 paper. In contrast, other modeling languages may lead to the creation of very large diagrams, which introduce a range of problems.
Unfortunately, the emphasis on functional decomposition is also a disadvantage of the IDEF modeling languages. Large models may span across numerous diagrams, which makes it difficult to maintain overview of the overall process. Although there is always a root diagram at the highest level of the decomposition, the functions in this diagram do not reveal the depth of the decomposition. For this reason, IDEF models are often accompanied with a model tree diagram which describes the relationships between the various IDEF diagrams.
2.2.7Business Process Modeling Notation
The Business Process Modeling Notation (BPMN) is a business process modeling methodology that aims to produce human understandable representations of business processes. The initial version of BPMN was developed by the Business Process Management Initiative (BPMI) in 2004. Two years later, the Object Modeling Group (OMG) adopted the language as a standard for business process modeling. As of 2011, BPMN is the most used notation for the modeling of business processes and considered the de facto standard [18]. At the time of writing, the latest version of BPMN is 2.0. Due to its immense popularity, we will use BPMN to provide examples of process modeling in the upcoming chapters.
BPMN is based on the same principles as flowcharts, but includes a much greater variety of constructs, making the language far more expressive than flowcharts. Besides flowcharts, the constructs present in BPMN show similarity to those used in UML activity diagrams and EPC diagrams. The core constructs of BPMN are events, activities, gateways and connections. Activities represent some kind of work which must be done, while events represent notable occurrences. Gateways can either be used to represent decisions which steer the control flow or can be used to split or merge the control flow (e.g. to perform activities in parallel). Finally, connections are used to establish the relationships between the aforementioned constructs. Each of these four constructs has a variety of more specific constructs which can be used to represent certain cases. For instance, the Timer Event is used to represent an event which occurs every so often.
Besides the core constructs, which are suitable for modeling most business processes, there is also a set of extended constructs. These constructs are meant for expert modelers who need to model
Receive Order 1 2 Fill Order Overnight Delivery 3 Regular Delivery 4 Send Invoice 5 Receive Payment 6 Close Order 7 X X & &
12 the more exotic cases. An example is the Event-Based Exclusive Gateway, which is a combination of a regular gateway, an Intermediate Event and a Start Multiple Event. One of the specific purposes of this complex construct is to represent scenarios in which various events can trigger the start of a process. Finally, BPMN supports swim lanes, which can be used to organize activities per role, and artifacts, which can be used to add additional information to the model, such as text annotations.
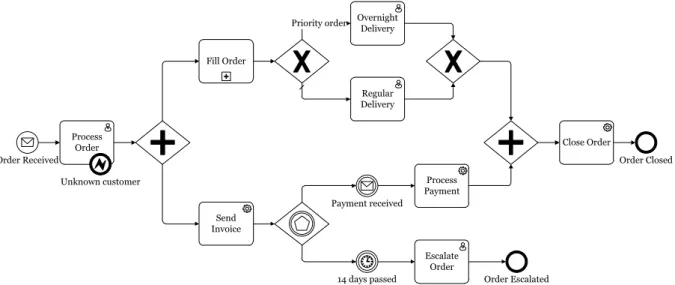
Figure 9 shows an example of a BPMN diagram of an ordering process. This example is based on the same example as the UML activity diagram shown in figure 4. The BPMN diagram shows great similarities to the previous diagrams which covered this example. Some additional details were incorporated in order in the example to showcase the expressive power of BPMN.
The circles represent events, which indicate notable occurrences during the ordering process. For instance, the ordering process is started when an order is received. The envelope inside the event element indicates that the event is triggered by receiving an actual message (e.g. a letter or e-mail). There is also an event present at the border of the ‘Process Order’ task. A boundary event represents a deviation or exception which can occur during the execution of the task. In this particular case, the event represents that the customer who placed the order is not known by the business. The symbol inside the event means that this is an Error Event and the bold face of the event means that the process ends when the event occurs. End Events with specific types can lead to follow-up actions, assuming the process in figure 9 is used as a sub-process in another diagram. Another use of events can be seen after the invoice has been sent. An Intermediate Message Event is used to represent the event of receiving payment, whereas an Intermediate Timer Event is used to represent a fourteen day delay. What this means is that when payment is not received within fourteen days, the order is escalated. Intermediate Events are events which do not start or end a process and are represented by a double border.
The diamonds represent gateways. The gateways with the plus symbol are Parallel Gateways while the gateways with the cross symbol are Exclusive Gateways. Their semantics are identical to the junctions of the IDEF3 diagram in figure 8. One interesting exception is the gateway after the ‘Send Invoice’ task, which is called an Exclusive Event-Based Gateway. This gateway is always followed by two or more Intermediate Events. The main purpose of this specific gateway is to indicate that one and only one event-based path succeeding the gateway may be taken. This is different from the Exclusive Data-Based Gateway which relies on data from the process instance to decide which branch to take. In contrast, the process instance is unaware whether the event ‘Payment received’ or ’14 days passed’ will happen first, only that when one event occurs, the process must continue on that path and ignore all other paths.
Figure 9 - BPMN diagram of an ordering process Process Order Fill Order Send Invoice Regular Delivery Overnight Delivery Priority order Process Payment Close Order Escalate Order Order Received Payment received Order Closed
14 days passed Order Escalated Unknown customer
13 The rectangles with rounded corners represent tasks and their semantics are similar to those found in the other examples. The symbol in the top right corner of the rectangle indicates the type of the task. A portrait specifies that a human is responsible for the execution of the task, while a gear specifies that a computer is responsible for the execution of the task. These help to differentiate between manual and automated tasks. The [+] symbol at the bottom center of the ‘Fill Order’ task points out that the task is actually a sub-process, meaning there is another BPMN diagram underlying it.
BPMN greatly emphasizes syntax over semantics. In fact, the set of available constructs in BPMN is so large that it is not always clear what construct is to be used in certain situations. In practice, over halve the users of BPMN only use the core set of constructs of BPMN [18].
2.3Business-IT alignment
The state in which an organization is able to use information technology effectively to achieve business objectives is called business-IT alignment and has been a topic of great attention over the last few decennia [19]. Although both groups of stakeholders are nowadays aware of the underlying issues, achieving business-IT alignment remains an elusive objective [20]. One of the main inhibitors of business-IT alignment is miscommunication caused by the fact that business and IT possess little knowledge of each other’s domain. The lack of mutual understanding is often paraphrased as business and IT speaking different languages or living in separate worlds. As a consequence of this misunderstanding, many software solutions developed by IT do not meet the demands of the business. Indeed, the effective translation of the demands of the business to a suitable software solution is often the most challenging part of an IT project [21].
BPM attempts to overcome this issue by letting the business express their demands in a process model, which in turn can be translated to a formal process model and executed by a process engine [22]. Instead of making IT responsible for determining the behavior of the system, which usually requires IT to understand the rules of the business, the business becomes responsible for the behavior. The role of IT is to create an adequate environment in which these process models can be created, analyzed, managed, stored and executed. This is often paraphrased as IT supporting the business, rather than taking it over.
We must add that we use the term business and IT to help facilitate our discussion, but realize that the distinction between the two is not as black and white as it used to be when the term was first coined back in 1995 [23]. As businesses rely more and more on IT to remain viable, the two groups have become intertwined and their boundaries have become blurred. A look at the current IT job market tells us, that a growing number of IT related vacancies no longer demands employees with a purely technical background, but rather seeks a mix of technical skills and so-called business skills. The latter refer to skills that include general understanding in the way businesses operate. Indeed, the demand for a Business-IT-hybrid employee is also recognizable in our current educational system, sprouting disciplines such as information sciences that educate its students in both fields.
2.4Language Theory
Business process modeling incorporates various aspects from the theory of language. Firstly, we distinguish between natural language and artificial language as both types of language are used in process modeling. Secondly, two features of artificial languages, formality and notation, are explained.
2.4.1Natural language
A natural language is a language that has evolved as a means of communication among people and is the type of language we are most concerned with in our daily lives. Although natural language can be considered to be developed by us, we only have a limited understanding of the origin of natural
14 language, how natural language works and how we are capable of processing natural language. Natural language can manifest itself in several ways, namely: speech, gestures and writings.
2.4.2Artificial language
An artificial language is a language explicitly designed with a specific purpose in mind. This is in sharp contrast to natural language, which serves a general purpose and has evolved naturally over time. There are various reasons for the creation of artificial languages, such as to ease communication or to serve as a basis for formal logic. Besides the purpose of an artificial language, there are two other aspects which are of interest to us:
Formality refers to the precision of the syntax and semantics of the language. A sentence
expressed in a fully formalized language, otherwise known as formal language, can be interpreted in one way and one way only. This property plays a crucial role in the field of formal logic, mathematics and computer programming. Languages with a formal syntax but informal semantics are called semi-formal languages.
Notation refers to the type of visual representation of the language in terms of text and/or graphics. Programming languages are usually text-based, whereas languages for conceptual modeling are usually graphics-based. Contrary to what one might expect, a modeling language does not necessarily involve a diagrammatic notation, but for the purpose of this thesis when we use the term modeling language, we will be referring to a graphical modeling language [24].
2.5 Conceptual Modeling
A conceptual model is a descriptive model of a system. Although we do not have a clear definition of the term ‘system’, we will attempt to provide one based on its characteristics. A system is a collection of elements with a distinct boundary which separates it from its environment. A system has a purpose, is usually artificial and exhibits observable behavior. A system may consume some form of input and produce some form of output.
Given these characteristics, many things can be considered systems. Consider a vending machine as a system. The system has a specific purpose, to sell snacks and beverages to customers. Its input is money and one or more button presses, while its output is the release of a snack or beverage. The outer case of the machine provides a clear boundary in the physical realm.
Whenever we speak of modeling in this thesis, we mean conceptual modeling. This is a refinement over the term model, which generally speaking is any simplified representation of (a part of) reality. Such a definition is too broad to be of value for our research. Besides the topic of conceptual models and modeling languages, the act of modeling itself is also a topic of scientific attention [25]. We will elaborate on two principles from this field, namely that of ontological expressivity and functional decomposition.
2.5.1Ontological Expressivity
The theory of ontological expressivity concerns the degree in which a modeling language can be used to describe the real world [26]. Some research has already applied this theory on business process modeling languages [27]. The real world can be described using ontology, the study of what exists in reality, with respect to its properties, its structure and how it relates to other parts of the real world. This assumes the thesis of philosophical realism which views reality as existing independently of its observers and being made up of structures and relationships. In other words, some elements in reality already form meaningful structures and we do not create these structures ourselves. This assumption makes it easier to map reality to a modeling language and back [28].
The degree of expressivity can be described using four types of ontological deficiencies of a modeling language shown in figure 10. These deficiencies are the four possible combinations over the constructs that either do or do not exist in the real world or the modeling language.
15
Figure 10 - Four ontological deficiencies of a modeling language
Construct deficit. The modeling language lacks a construct which is present in the real world. The
modeler will not be able to provide a direct representation of the real world construct and he or she will have to use one or more other modeling constructs to achieve the desired representation.
Construct redundancy. The modeling language has two or more constructs which describe the
same construct in the real world, thus creating an ambiguity in the modeling language. The modeler will encounter difficulty what modeling construct to choose for the description of the real world construct.
Construct overload. The modeling language has a construct which describes two or more
constructs in the real world. The modeler will encounter difficulty differentiating between the multiple real world constructs in his or her model.
Construct excess. The modeling language has a construct which is not present in the real world.
The modeler will not be able to use this construct in his model in a meaningful manner. Modeling languages that exhibit a high level of construct excess appear bloated and overly complicated. 2.5.2Functional Decomposition
Functional decomposition is the act of dividing a system into smaller subsystems with the purpose of increasing understanding of the system. This goal is also one of the primary motivators for the creation of conceptual models [29]. Generally speaking, decomposition is a fundamental cognitive principle we humans use to understand the world around us. To quote Goguen and Varela (1979): ‘The world does not present itself to us neatly divided into systems, subsystems, environments. These are divisions which we make ourselves.’ We realize that this stance poses a conflict with the thesis of philosophical realism we mentioned in the previous subsection. A more appropriate thesis would be that of critical realism, which acknowledges that some of our interpretations accurately represent their real world counterparts, while other interpretations do not. Thus, critical realism can be seen as a relaxed form of philosophical realism with respect to its implications for the theory of ontology.
Reductionists argue that functional decomposition will ultimately lead to complete knowledge of the system, while holists disagree, arguing that “The whole is different from the sum of its parts” . For instance, if one would take a car apart into its smallest constituent parts he or she might have gained full knowledge over the working of its combustion engine but not found an explanation why the steering wheel is on the left.
Construct deficit (1:0)
Construct redundancy (1:n)
Construct overload (n:1)
Construct excess (0:1)
16
2.6Abstraction
Abstraction has many different definitions and uses depending on its context. In its broadest sense, abstraction is a concept not associated with any specific instance. With respect to modeling, we define abstraction as the process by which an individual translates his observation of a part of the real world to a simplified form of knowledge. This definition exhibits great similarity to the act of modeling, which is on purpose as we believe that abstraction is a key component of any modeling activity.
We need to be able to abstract in order to reduce the infinite complexity of the real world to a limited set of concepts. This is a skill which we develop when we are young and keep on developing as our knowledge of the world expands. It is difficult to measure how well someone is able to perform abstract thinking much like it is difficult to measure how abstract a certain concept is. For instance, young children often struggle with the concept of time when learning how to read a clock or calendar. For adults, these matters seem quite concrete, while the effect of time dilation from the theory of relativity is perceived as abstract by many. When people are unable to give a concrete interpretation of an abstract concept, they will often have trouble understanding that concept.
In computer science, abstraction is the process by which programming constructs are defined with a specific meaning, while hiding away the implementation details [30]. The notion of hiding details plays an important role in any modeling activity as it allows one to leave out irrelevant information and focus on that which is deemed important. In business process modeling, information hiding is an important principle as these models tend to expand rapidly and a complete process description can contain an enormous amount of information.
2.7System Design Principles
System design principle is an umbrella term we use to describe a principle which assists the design of a system. In this section, we use the same definition of a system as provided in section 2.5. We believe these principles can be used as generic guidelines for conceptualization. In other words, if conceptual modeling leads to the description of a system, then these principles can be used to guide the creation of this description. Strictly speaking, creating a model of a system is very different from designing a system. However as we already discussed in 2.1, modeling the business process guides the design of the business process and vice versa.
The principles we will explore are best known for their use in object oriented software design. Object orientation is a programming paradigm centered on the design of objects, which are data structures consisting of variables and methods. These objects can be considered as systems as they are created for a specific purpose, exhibit some behavior and have a well-defined boundary, often referred to as the scope of the object. The paradigm itself is not the focus of our attention. Instead, we focus on the design principles underlying object orientation as we believe that many of these principles transcend the computer science discipline. Note that there is considerable overlap between the various principles below.
The following principles will be covered: Modularity, Separation of Concerns, Single Responsibility Principle, Single Point of Entry, Ad-hoc Polymorphism and Information hiding. 2.7.1Modularity
Modularity concerns the design of a system as a set of separate, interchangeable components, called modules. Such an approach towards system design has many advantages such as improved coping with complexity, improved maintainability and reusability by enforcing logical boundaries between modules. The principle of modularity is supported by a variety of other principles and the next two subsections will describe the two most important factors driving modularity: the Separation of Concerns and the Single Responsibility Principle.
17 2.7.2Separation of Concerns
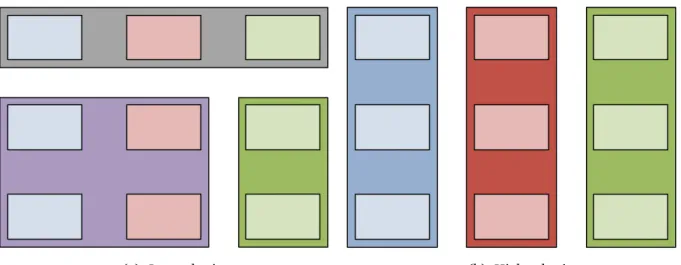
Separation of Concerns is the principle whereby a system is decomposed into a series of subsystems that each addresses a specific concern. The identification and Separation of Concerns allows one to cope with the complexity of a large system, by splitting the system into several smaller systems. The Separation of Concerns principle is used in various disciplines, including architecture and information design [31]. Unfortunately, there is no generally accepted definition of what constitutes as a concern or how one should achieve such a separation. As a result, the principle seems superfluous: The idea that a complex problem is easier to solve when it is split into several simpler problems is rather evident.
The software quality metric called coupling is used to measure the level of dependencies a set of software modules have on each other. A set of modules that uphold the Separation of Concerns principle will have a low coupling, otherwise known as being loosely coupled, which is favorable over sets of modules that are highly coupled. The example in figure 11 shows two software systems consisting out of nine distinct modules. Figure 11(a) is loosely coupled as the nine modules have few dependencies on each other, while figure 11(b) is highly coupled as the nine modules have many dependencies on each other.
(a) Loosely coupled (b) Tightly coupled Figure 11 - Two examples of coupling
2.7.3Single Responsibility Principle
Single Responsibility Principle states that every system should have a single well-defined responsibility, which is yet another approach towards the modular design of a system. The importance of single responsibility is less evident during the initial design and implementation phase, but pays off when requirements change and existing systems have to be adapted. If a system has multiple responsibilities it is likely that these responsibilities have interdependencies, which means that a change to one responsibility might inadvertently have implications for the other responsibilities. In other words, systems with multiple responsibilities are more difficult to change without unexpected side effects. Unfortunately, just as the case with Separation of Concerns, there is no clear definition of what constitutes as a responsibility.
The software quality metric called cohesion is used to measure the degree of relatedness of a software module. Modules that uphold the Single Responsibility Principle will have a high cohesion, which is deemed favorable over modules with low cohesion. Figure 12 shows two examples of a software system consisting out of nine distinct functions (the inner rectangles). The color of these rectangles indicates some distinct responsibility of the function. These nine functions are grouped into three distinct modules (the outer rectangles).