of Economic Research
Volume Title: Aging Issues in the United States and Japan
Volume Author/Editor: Seiritsu Ogura, Toshiaki Tachibanaki and David A.
Wise, editors
Volume Publisher: University of Chicago Press
Volume ISBN: 0-226-62081-6
Volume URL: http://www.nber.org/books/ogur01-1
Publication Date: January 2001
Chapter Title: The Third Wave in Health Care Reform
Chapter Author: David M. Cutler
Chapter URL: http://www.nber.org/chapters/c10288
䢇
5
The Third Wave in
Health Care Reform
David M. Cutler
The title of this paper refers to a forecast of coming trends in health care reform. I believe a “third wave” of health care reform, focusing on improv-ing the efficiency of medical care provision, will become common in the countries of Organization for Economic Cooperation and Development (OECD) in the next five to ten years.
I date the first wave of health care reform from the late 1940s through the early 1980s. In this era, most OECD countries built up their health insurance systems. Universal coverage was guaranteed, and benefits were expanded. There were few restrictions on the provision of services. As a result, medical spending consumed an increasing part of the economy of every OECD country.
The growing cost of medical care led to the second wave of reform—a focus on cost containment. The most obvious way to limit medical spend-ing is to limit the total amount of resources the medical sector can con-sume. Since governments in the OECD typically paid for most, if not all of, medical care spending, the government could easily limit its overall cost. Spending limits did not conflict with the goal of universal insurance coverage with low cost sharing. Thus, the 1980s saw the advent of wide-scale restrictions on medical spending in the aggregate: global budgets for hospitals, payments inversely related to volume increases for physicians, and caps on pharmaceutical payments.
However, limiting spending without altering the underlying demand or supply for medical care does not necessarily lead to efficient service
provi-David M. Cutler is professor of economics at Harvard University and a research associate of the National Bureau of Economic Research.
The author is grateful to Monica Singhal for research assistance and to the National Insti-tute on Aging for research support.
sion. In many countries, tight budget constraints have led to inefficient resource allocations and to a growing role for the private sector in supply-ing care. Some countries have concluded—and I believe more will fol-low—that additional reforms strengthening the market in medical care are needed. I refer to this incipient trend as thethird wave of health care reform.
In this paper, I document the trends in OECD medical systems over the past fifty years and the reasons for major changes in these systems.
5.1 The Organization of Medical Systems
The medical sector is characterized by three economic agents, shown in figure 5.1: patients, insurers, and providers. The dollars generally flow from left to right. Patients give money to insurers, who in turn pay providers. There is some cost sharing that patients pay directly to providers, but this is typically small. In the United States, for example, the typical private insurance policy covers nearly 80 percent of medical spending; only 20 percent is paid out-of-pocket by the patient. In most other countries, the insurers’ share of the bill is even greater.
Figure 5.1 depicts a fundamental representation of the medical sector. This figure encompasses a broad range of insurance arrangements. For example, the “patient” may be all taxpayers and the “insurer” may be the government, in which case figure 5.1 depicts a national health insurance scheme. Alternatively, the “insurer” and “provider” could be the same, as in a health maintenance organization (HMO) in the United States or a publicly run hospital in European countries. In both cases, one can distin-guish among the three separate actors, even if more than one function physically occurs in the same place.
In developed countries, the insurer is almost always the government, or, in cases where insurance is private, it is heavily regulated by government. This is not surprising; government involvement is required in any universal benefit system. Because of this, I conduct the rest of the discussion in terms of the decisions that governments have historically made about the medical sector.
5.2 The First Wave of Health Care Reform
Prior to World War II, few countries had universal health insurance coverage. Social insurance as a whole dates back to Bismark in the 1880s, but health insurance coverage was always limited. Bismark’s Germany, for example, covered the working age population, leaving the poor uncovered. In only a few countries (Austria, Germany, the United Kingdom, the Netherlands, France, and Norway) was any serious effort at medical care insurance adopted prior to World War II. The countries that did have some coverage typically covered only certain groups in the population, such as
workers or urban residents. Coverage was much more extensive for old-age insurance than for medical care insurance (Cutler and Johnson 1999). After World War II, medical insurance expanded. A wave of coun-tries—generally the rich Northern European countries such as the United Kingdom, Sweden, Belgium, and France—enacted universal insurance coverage in the 1940s. The advent of modern medicine, most strikingly illustrated by the penicillin antibiotic, drove demand for medical care to some extent. These countries are also notable for a strong egalitarian ethic: Health care is generally viewed as a basic right of all people, not as a good to be allocated through markets. The legacy of the Great Depression and World War II also fueled expanded coverage. Populations that had suffered for more than twenty years wanted some reward for their suffering, and medical insurance was an appropriate reward.
The late 1940s, 1950s, and 1960s saw the expansion of universal cover-age. The United Kingdom, for example, implemented universal coverage in 1948. France achieved universal coverage a few years later. Canada, Den-mark, Iceland, Luxembourg, Japan, and Sweden all guaranteed universal insurance coverage during the 1960s. The United States enacted Medicare and Medicaid in the middle of the 1960s.
For a few countries—Australia, Greece, Italy, and Portugal—the pro-cess of ensuring universal coverage extended into the 1970s. The “laggard” countries were typically poorer or had particular political situations (such as authoritarian regimes) that set back the expansion of social insurance for several decades.
By the 1980s insurance coverage had become universal in most devel-oped countries. Twenty-two of the twenty-four OECD countries have uni-versal insurance coverage.1Only in the United States and Turkey is
medi-cal insurance voluntary.
1. This statement applies to most of the population; in some countries, certain groups (such as guest workers) are not covered by health insurance. Switzerland only recently en-acted universal insurance coverage, but it has had very generous subsidies to insurance, and thus very high rates of insurance coverage, for several decades.
In the United States, insurance coverage is spotty. For the elderly and very poor, insurance is free or heavily subsidized. Thus, insurance is nearly universal for the elderly and is high among the very poor. For the non-elderly, non-poor population, insurance is subsidized, but to a lesser ex-tent. The principal subsidy is that employer payments to health insurance are not taxed as income to individuals in the way that wage payments are. As a result, the subsidy to medical insurance varies with the employee’s marginal tax rate—generally 15 to 40 percent once federal and state in-come taxes and social security taxes are accounted for. This subsidy is large enough that virtually everyone with private health insurance obtains that insurance through an employer, but small enough that not everyone chooses to be insured; about 15 percent of the U.S. population is without health insurance.
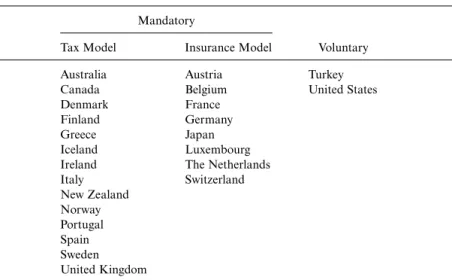
Because countries began at different points, the method of guaranteeing universal coverage differs internationally. There are two fundamental ways of providing universal insurance. The first is ataxmodel. Countries with this system levy a payroll, income, or consumption tax, the proceeds of which are used to finance universal insurance. In such a system, the “insur-ance company” is the government. The second system is the insurance
model.2Insurance is provided through regional associations, occupational
groups, or religious or political associations. Often, “employers” are re-quired to pay for health insurance in such a system (although the incidence of this is almost certainly on employees). Table 5.1 shows the division of countries by system of insurance provision. The tax system is typified in Canada, where the federal government raises a uniform tax that it distrib-utes to the provinces to pay for medical costs. The insurance model is seen most clearly in Germany, which has over 1,000 sickness funds varying by region, industry, and occupation.
In practice, the distinction between tax and insurance systems is less important than it could be. Countries that use the insurance model gener-ally do not let people choose among alternative insurance companies. As a result, people are effectively assigned to one insurance arrangement, as in the tax-financed model. The insurance companies are generally not-for-profit and are heavily regulated by the government, so that benefits and cost sharing do not vary across individuals.
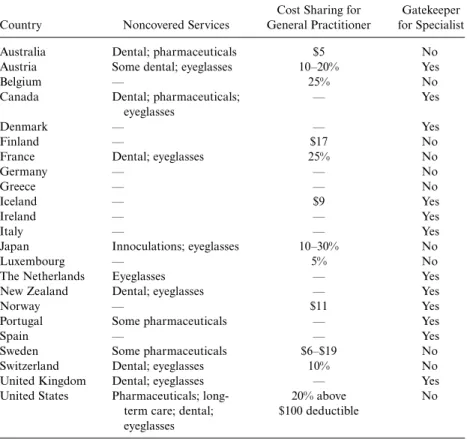
As countries expanded their insurance coverage, they also expanded the benefits that people receive and reduced the cost sharing that people pay. Table 5.2 shows the characteristics of the guaranteed insurance policy in OECD countries.3 It is easier to show the services that are not covered
than those that are covered. Generally, almost all medical services are
cov-2. Frequently, these insurance companies are termedsickness funds.
ered. The few exceptions tend to be eyeglasses, some dental care, or certain pharmaceuticals (generally less expensive ones, including some that are available over the counter in the United States). Frequently, even these ser-vices are covered for the very poor. Indeed, the serser-vices covered go far beyond what most economists think of as insurance services; a classic ex-ample is spa benefits, which are covered under health insurance in some countries (such as Germany).
Cost sharing is similarly low. Table 5.2 shows the cost sharing for visiting a general practitioner. In about half the countries, there is no cost sharing for visiting a primary care physician. In most other countries, cost sharing is nominal—perhaps $5 to $15 per visit—and these amounts are fre-quently waived for the very poor. Specialist services (not shown) generally are provided at the same levels of cost sharing. The out-of-pocket cost of using medical care is, in most countries, trivial. Indeed, the United States, which economists frequently criticize for having a low amount of cost shar-ing in its public programs, actually has very high cost sharshar-ing when com-pared with other OECD countries.4
The last column of table 5.2 shows whether each country imposes a “gatekeeper” for access to specialty care. Typically, the gatekeeper is the primary care physician, who must refer a patient to a specialist.
Gatekeep-4. Of course, this does not count the fact that most Medicare enrollees in the United States have supplemental insurance that eliminates the cost sharing required under Medicare.
Table 5.1 The Provision of Health Insurance
Mandatory
Tax Model Insurance Model Voluntary
Australia Austria Turkey
Canada Belgium United States
Denmark France
Finland Germany
Greece Japan
Iceland Luxembourg
Ireland The Netherlands
Italy Switzerland New Zealand Norway Portugal Spain Sweden United Kingdom
Source:Information on insurance systems is from the Organization for Economic Coopera-tion and Development (OECD; 1995).
ers are relatively common in OECD countries; however, it is important to note that there is generally little financial penalty for their primary care physicians who make referrals to a specialists (unlike for HMO physicians in the United States). Primary care physicians paid on a salary basis, for example, bear no cost of authorizing a person to see a specialist. As a re-sult, the gatekeeper provisions are generally much less onerous than they are in the United States.
On the supply side of the market, governments must specify a payment system for medical providers. There are many potential systems, shown in figure 5.2: the most generous is fee-for-service payment. In this system, a price is set for each service that providers can offer, and providers receive payment for the amount billed. Providers paid on a fee-for-service basis are insulated from the cost of the services they provide (assuming the fee-for-service payment is above marginal cost). As a result, providers have incentives to perform more services than are warranted.
Table 5.2 Generosity of Insurance Coverage
Cost Sharing for Gatekeeper Country Noncovered Services General Practitioner for Specialist
Australia Dental; pharmaceuticals $5 No
Austria Some dental; eyeglasses 10–20% Yes
Belgium — 25% No
Canada Dental; pharmaceuticals; — Yes
eyeglasses
Denmark — — Yes
Finland — $17 No
France Dental; eyeglasses 25% No
Germany — — No
Greece — — No
Iceland — $9 Yes
Ireland — — Yes
Italy — — Yes
Japan Innoculations; eyeglasses 10–30% No
Luxembourg — 5% No
The Netherlands Eyeglasses — Yes
New Zealand Dental; eyeglasses — Yes
Norway — $11 Yes
Portugal Some pharmaceuticals — Yes
Spain — — Yes
Sweden Some pharmaceuticals $6–$19 No
Switzerland Dental; eyeglasses 10% No
United Kingdom Dental; eyeglasses — Yes
United States Pharmaceuticals; long- 20% above No term care; dental; $100 deductible
eyeglasses Source:OECD (1995).
A somewhat tighter system is a salary payment.5 Salaried physicians
receive an annual payment, with their practice expenses covered by the insurer. While physicians are not paid for performing additional medical care, they also have no financial incentive to limit the care they provide.6
Systems that place the provider at risk for medical care utilization are on the right-hand side of the figure. These are grouped under the term
capitation,although there are many variants of such a system. One type of payment is a per diem in which a hospital receives a fixed amount for each day the patient is in the hospital. Hospitals bear the cost for patients who are more expensive than the per diem amount, but, conversely, make money on patients who are less expensive than the per diem amount. Not surprisingly, hospital stays are long in countries with per diem payments, since marginal days of care are less resource intensive than the average day of care. A related system is a per-case payment. In this system, the hospital is paid a fixed amount for the patient as a whole. Thus, the marginal costs of all services provided is borne by the hospital. Hospital stays generally fall as payment moves from a per diem or fee-for-service basis to a per-case basis (Cutler and Zeckhauser 1999). A final alternative is a per-year payment—a “global budget” for all hospital services provided during the year, or an annual fee to physicians that covers their salary and practice expenses. In these systems, providers are at even greater risk for the costs of the services that they provide. Money spent for one patient reduces money available for other patients or reduces physician take-home earn-ings. The exact level of risk varies with the nature of the capitation pay-ment.7
Historically, medical providers in virtually every country were paid on a fee-for-service or salary basis. In part, this has been a response to the complexity of the medical care system. Medical care is an extremely dif-ficult commodity to price. There are about 10,000 services that physicians can provide, and thousands more for hospitals. Since governments are rarely specialists in the provision of medical care, they must figure out
5. This system is relevant only for physicians (not for hospitals).
6. They also have few incentives to work hard where it is difficult to monitor their work hours or their effort.
7. This includes any additional payment for “outlier” patients. Fig. 5.2 Payment systems for medical care
how to pay for these varied services. Paying piece rates or salaries is more natural than capitated payment where knowledge of medical care delivery is important. Thus, many countries started offwith piece rates or salaried reimbursement.
The use of fee-for-service and salaried payments has also been, in part, a response to concerns about the underprovision of services if marginal costs were not covered. In the United States, for example, the Medicare system was set up with a fee-for-service payment structure for exactly that reason; it was the only way to blunt the fears of doctors that their incomes would be reduced if they were to use an alternate pricing system. In other countries, a similar dynamic was at work.
The result was that there were few incentives to limit utilization. In es-sentially no country were supply-side constraints important in limiting medical care provision. This circumstance was coupled with the already weak incentives on the demand side to limit utilization.
By the beginning of the 1980s, therefore, most countries had a medical care system characterized by three features, each of which strongly encour-aged the growth of medical costs:
● Universal insurance coverage;
● A generous set of benefits, with low cost sharing; and
● Fee-for-service or salaried providers who faced no financial incentives to limit care provision.
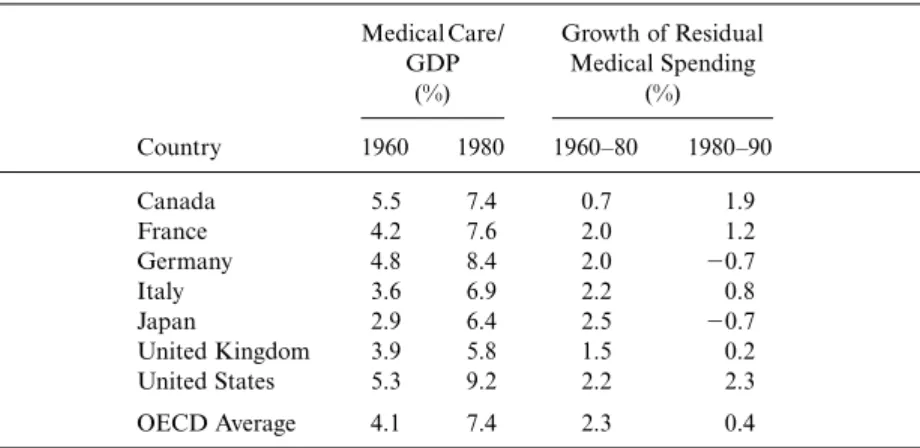
In effect, the systems were unconstrained on both the demand and the supply sides of the market. In such a system, one might naturally expect costs to grow rapidly; this was indeed the case. Table 5.3 shows the growth of medical costs in the Group of Seven (G7) nations and in the remainder of the OECD nations between 1960 and 1980. Between 1960 and 1980, medical spending for the average OECD country increased from 4.1 per-cent of GDP to 7.4 perper-cent. In the G7 countries, growth was particularly rapid; in the United States, for example, medical care increased from 5.3 percent of GDP to 9.2 percent of GDP.
Some of the growth of medical spending as a share of GDP may be due to the growth of the economy as a whole. If the income elasticity of medi-cal care is greater than 1, or if increases in income increase the opportunity cost of resources in the medical sector and thus increase overall medical spending (Baumol 1988), one would naturally expect medical care to ex-pand as a share of GDP as the economy grows. To adjust for this, I esti-mate a regression for the growth of real per capita medical spending be-tween 1960 and 1980 as a function of real per capita income growth. For the twenty-one OECD countries with data in both years, the coefficient on income growth is 1.26 (standard error⫽0.22). Thus, at least some of the growth of medical spending as a share of GDP is to be expected.
spending—medical spending growth beyond what can be explained by the growth of income alone. As the table shows, residual spending growth was generally 2.0 to 2.5 percent annually in the G7, and averaged 2.3 percent in the OECD countries. The only countries with residual growth rates be-low 2 percent annually are Canada and the United Kingdom, both of which had a longer history of cost containment, as noted below.
5.3 The Second Wave
At the beginning of the 1980s, countries throughout the OECD became concerned about spending on medical care. Public-sector concern was fu-eled by the large drain that medical costs placed on the public fisc. Gov-ernments paid for over 70 percent of medical costs in most countries. Be-ginning in the mid-1970s, the growth of wages, and thus the tax base, slowed; as the 1980s progressed, it became clearer to governments that they had a long-term funding crisis in medical care. Employers also be-came concerned about health care costs, particularly when employers wrote the checks for health insurance. In the United States, for example, employer concern about rising health costs was instrumental in driving reform. The general public also grew weary of rising costs, which led to ever-increasing tax burdens and less rapidly increasing wages.
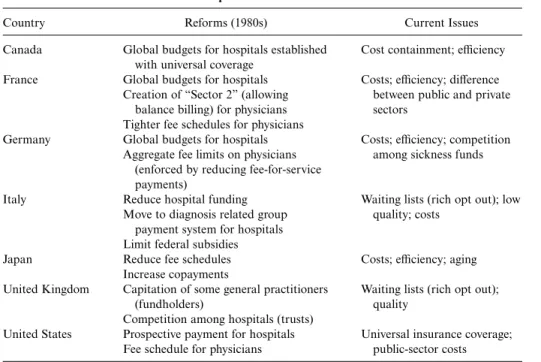
As a result, the 1980s saw a concerted effort to control medical spending in most developed countries. Table 5.4 shows the particular measures taken in the G7 (Canada, France, Germany, Italy, Japan, the United King-dom, and the United States). The most common reform was to place limits
Table 5.3 Medical Spending between 1960 and 1980
Medical Care/ Growth of Residual GDP Medical Spending (%) (%) Country 1960 1980 1960–80 1980–90 Canada 5.5 7.4 0.7 1.9 France 4.2 7.6 2.0 1.2 Germany 4.8 8.4 2.0 ⫺0.7 Italy 3.6 6.9 2.2 0.8 Japan 2.9 6.4 2.5 ⫺0.7 United Kingdom 3.9 5.8 1.5 0.2 United States 5.3 9.2 2.2 2.3 OECD Average 4.1 7.4 2.3 0.4 Source:OECD (1998).
Notes:Residual medical spending for 1960–80 is the growth of medical spending beyond the rate predicted by the increase in income. Residual medical spending for 1980–90 uses the in-come elasticity estimated for the 1960–80 period.
on overall medical spending. Since the government was paying for medical care, the simplest way the government could control overall spending was simply to limit aggregate spending for medical care.
This was most easily accomplished in the hospital sector. Rather than paying hospitals on a fee-for-service basis, countries moved toward a global payment for each hospital (termed a global budget) which was to cover all the care that was appropriate. Global budgets were implemented in France in 1984 (for public hospitals only) and in Germany in 1986. The United Kingdom, Canada, and Italy already had global budgets in place—they had been established with universal coverage—but both countries tightened their budgets in the 1980s, nonetheless. Among the universal insurance countries, only Japan did not move away from fee-for-service payment; instead, the fee schedule for hospitals in Japan was re-duced.
Table 5.5 shows that this experience was not unusual. Most countries now pay hospitals on some type of capitated basis. Only a few countries have retained a fee-for-service payment system.
Limiting physician spending is more difficult, since full capitation for physicians makes much less sense than it does for hospitals—the risk to a physician in bearing the cost per year of a patient are simply too great.
Table 5.4 The Medical Care Experience in the 1980s and 1990s
Country Reforms (1980s) Current Issues
Canada Global budgets for hospitals established Cost containment; efficiency with universal coverage
France Global budgets for hospitals Costs; efficiency; difference Creation of “Sector 2” (allowing between public and private
balance billing) for physicians sectors Tighter fee schedules for physicians
Germany Global budgets for hospitals Costs; efficiency; competition Aggregate fee limits on physicians among sickness funds
(enforced by reducing fee-for-service payments)
Italy Reduce hospital funding Waiting lists (rich opt out); low Move to diagnosis related group quality; costs
payment system for hospitals Limit federal subsidies
Japan Reduce fee schedules Costs; efficiency; aging Increase copayments
United Kingdom Capitation of some general practitioners Waiting lists (rich opt out);
(fundholders) quality
Competition among hospitals (trusts)
United States Prospective payment for hospitals Universal insurance coverage; Fee schedule for physicians public-sector costs Source:See Cutler (1999) for more details.
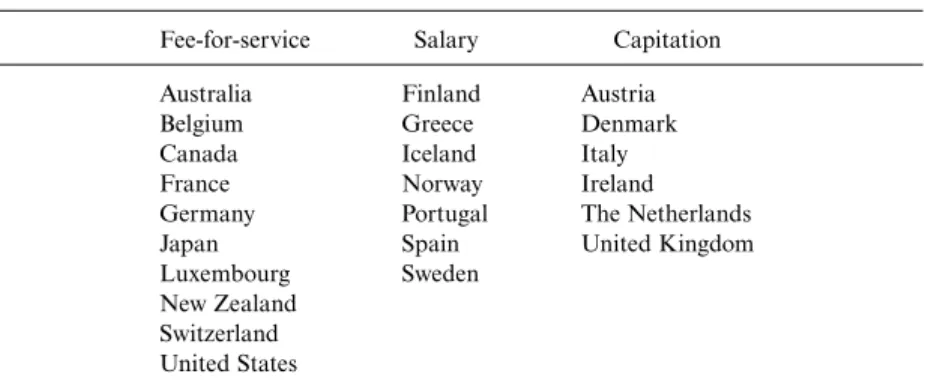
Table 5.6 shows how countries reduced payments for physician services, however. A few countries have capitated physicians, but this typically in-volves a salary payment that depends on the number of patients seen, not a system where primary care physicians bear the risks of individual patient costs.8More commonly, countries have implemented “global budgets” for
the physician sector as a whole. In Canada and Germany, for example, aggregate payments for physicians are set in advance; payments for each individual physician are made on a fee-for-service basis, but the fees are
Table 5.6 Methods of Payment for Primary Care Physicians
Fee-for-service Salary Capitation
Australia Finland Austria
Belgium Greece Denmark
Canada Iceland Italy
France Norway Ireland
Germany Portugal The Netherlands
Japan Spain United Kingdom
Luxembourg Sweden New Zealand
Switzerland United States
Source:Information on insurance systems is from OECD (1995).
Table 5.5 Methods of Hospital Payment
Fee-for-service Per Diem Per Case Per Year
Japan Austria Belgium Australia
Switzerland Belgium France (public) Canada
France (private) Germany Denmark
Germany Ireland Finland
Spain Spain Greecea
United States Icelanda Ireland Italya New Zealand Norwaya Portugala Sweden United Kingdom Source:Information on insurance systems is from OECD (1995).
Note:The United States is placed in the per-case column because that is how Medicare pays for hospital care.
aHospitals run by the public sector.
reduced if the aggregate volume of services provided exceeds the expected level. Other countries introduced fee schedules (as did the United States) or, as in the case of Japan, retained fee schedules but proceeded to lower the rates. In countries with salaried physicians (public-sector physicians in France and specialists in Italy and the United Kingdom), salaries grew less rapidly than they had in previous decades.
The result was a decade of relatively low medical-spending growth. The last column of Table 5.3 shows the growth of residual medical spending from 1980 to 1990, using the same income elasticity as in the 1960–80 period. That is, I report the growth of medical spending net of the amount predicted, given income growth that decade and the historical relation be-tween growth in income and increases in medical spending.
In most countries, residual medical-spending growth was substantially lower in the 1980s than it had been in previous decades. In Germany and Japan, for example, residual spending growth was negative in the 1980s— medical spending increased less rapidly than income alone would dictate. In the United Kingdom and Italy, residual spending growth was positive but very small. Only in the United States and Canada was residual medical-spending growth close to what its value had been in the previous twenty years. In Canada this is understandable, since many cost contain-ment initiatives had been implecontain-mented prior to the 1980s and the strin-gency with which limits were applied was generally reduced in the 1980s. The United States is the clear outlier. With no clear demand- or supply-side restraints, residual spending growth in the 1980s grew as rapidly as residual growth had during the 1960s and 1970s.
5.4 The Third Wave
Has the rest of the world (outside of the United States) discovered the answer? Are countries in long-run balance on their medical care systems, or are further reforms required? In this section, I speculate about future trends in health care reform.
It is clear that people in most countries are much happier with their medical care systems than are people in the United States. Blendon et al. (1990) reported on surveys of satisfaction with the health system in ten countries, including all of the G7 countries. The share of individuals who feel that only minor changes are needed in their health system9 was 56
percent in Canada, 41 percent in France and Germany, 29 percent in Ja-pan, 27 percent in the United Kingdom, and 12 percent in Italy. This com-pares to 10 percent in the United States.
Although people in most countries are more satisfied with their medical
9. The exact question was “On the whole, the health care system works pretty well, and only minor changes are necessary to make it work better.”
care systems than are Americans, what is equally striking is the large num-ber of people in every country who still want fundamental reform of the health system. Only in Canada did as many as 40 percent of the popula-tion think that the structure of the health system was sound; and in Can-ada, the share of people favoring fundamental reform of the medical care system has risen in recent years (Blendon et al. 1995).
The last column of table 5.4 shows the concerns that have arisen in G7 countries in the 1990s, particularly in the past few years. Despite lower overall spending growth, many countries are still concerned about medical costs. This is not surprising; even at its lower growth rate, medical care is consuming an increasing share of GDP—and public spending—in most countries. Moreover, the prices that have been paid for the less-rapid growth of medical costs have been high.
A second concern has risen to match the overall level of spending: the efficiency of the medical sector. Recall that medical care reforms in the 1980s did not reduce the underlying demand for medical care. Even after the 1980s, patients still faced little or no cost sharing for the use of covered services. The “rationing” of medical care was entirely on the supply side.
Supply-side rationing has predictable consequences, the most common of which are waiting lists. Waiting lists are common in Canada, Italy, and the United Kingdom. In Japan, although waiting lists are not common, excess demand for physicians is; the time involved in seeing a physician can be quite high.
Countries that spend more have shorter waiting lists than countries that spend less. Waiting lists are more common in the United Kingdom, for example, than in Canada, reflecting the greater level of medical care fund-ing in the latter country than in the former.
Coupled with this excess demand is the difficulty of efficient planning in the public sector. Governments are rarely good at providing complex services, and this is particularly true in medical care, where the nature of optimal service provision changes very rapidly. Thus, medical care quality in supply-side rationing was uneven—good in some places and bad in others. Moreover, the incentives built into the systems became more no-ticeable. Salaried physicians did not work hard, and physicians who were paid little money for each visit did not spend much time with each patient. The levels of funding and of the efficiency with which funds were allo-cated showed up directly in patient satisfaction with the medical care sys-tem. Cutler (1999) shows that the share of people expressing the need for fundamental health reform (based on the Blendon et al. survey) is strongly positively correlated with per capita medical spending. With the exception of the United States, countries that spend more on medical care have greater public satisfaction with the medical care system than countries that spend less on medical care. In the United States, in fact, the concern about the medical system probably refers more to the lack of universal coverage
than to the rationing of medical services. Within countries that have uni-versal coverage, the level of medical spending is strongly related to satis-faction with the medical system.
When waiting times are long and quality in the public sector is particu-larly low, the private sector is often the alternative source of medical care. The ability to go outside the national medical system varies across coun-tries; some countries place restrictions on doing so, or offer inducements to stay in the national system. In Canada, for example, providers are not allowed to treat patients outside the national system for services the sys-tem covers, nor are they allowed to accept payments above the insured level.
In other countries, however, a robust private sector has developed to supplement the public system. This is the case in the United Kingdom, Italy, and France. In the United Kingdom, for example, a growing private insurance market allows people to “queue jump” to receive services more rapidly than they would be eligible for them under the national insurance system. In Italy, people also go outside the public system, paying out of pocket when they want services they cannot obtain rapidly enough through the public sector. In France, the issue of private provision has been particularly contentious. Some providers may see patients outside the public sector, which they do to increase their income. The result is that the rich get better (or at least faster) medical care than the poor.
The anecdotal information from the G7 suggests that supply-limited systems are not the ultimate resolution of the medical care struggle. Tight spending constraints reduce medical spending but also engender increas-ing dissatisfaction. It seems likely that further medical care reforms will be needed. As a result, a new round of reform efforts across countries may well begin. My suspicion is that reforms are likely to proceed on two tracks, which I discuss in the following subsections.
5.4.1 Measures to Increase Competition
One focus of reform efforts will be on increasing competition in the medical care system, in an effort to increase system efficiency. Almost cer-tainly, this will involve more cost consciousness on the part of physicians. The United Kingdom is at the forefront here. In the late 1980s and early 1990s, the United Kingdom began capitation payments for physicians (“GP fundholders”). The capitation amount included primary care ser-vices as well as specialist and hospital serser-vices. At the same time, hospitals were encouraged to become, in effect, not-for-profit “trusts” that could compete for patients. The result is incentives for providers to monitor utili-zation more closely and to limit excessive medical care.
In other countries, there has been less emphasis on competition among providers than on competition among insurers. For example, Germany
now allows people to choose among sickness plans, much as individuals may choose among insurance companies in the United States. The hope is that competition among funds will encourage the different funds to be more efficient.10
The issue of choice brings up a fundamental question about health in-surance markets: Are the efficiency advantages of choice greater than the losses it brings about through adverse selection? While insurance choice is likely to lead to efficiency savings, it also creates adverse selection (Cutler and Reber 1998; Cutler and Zeckhauser 1999). As people sort themselves across insurance plans, the sickest people will choose the most generous insurance and the healthiest people will choose the least generous insur-ance. This will increase the premiums for the sick and reduce the premi-ums for the healthy, and may even lead to the abandonment of the most generous plans. Adverse selection is an inherent tendency of choice-based insurance systems (Cutler and Zeckhauser 1999). Thus, countries that move along this route will necessarily give up some of the redistribution that they currently maintain.
5.4.2 Increasing Patient Cost Sharing
The other avenue for change will be reducing benefits or increasing pa-tient cost sharing. As supply-side constraints alone become less popular, demand-side controls will be an increasing option. In some countries (e.g., Japan), reforms in the 1980s increased cost sharing for covered services. Cost sharing has been increasing in the United States as well as for some services in other countries.
Countries that increase cost sharing face the question of whether people will be allowed to purchase supplemental insurance to buy down that cost sharing. In many countries (including the United States), supplemental insurance is allowed to cover the cost sharing required under the basic package. This creates significant problems, however; when individuals purchase supplemental insurance, they use more medical services than they otherwise would, driving up spending in the basic medical plan. Thus, allowing insurance to cover basic cost sharing is likely to limit the effi -ciency gains of increasing cost sharing.
In addition, increasing cost sharing raises concerns about the poor. The rich can afford greater cost sharing more readily than the poor can. Thus, countries that move toward increased cost sharing or fewer covered ser-vices inevitably face questions about their commitment to equity in medi-cal care financing.
10. The model here is the recent reform in the Netherlands, which involved substantial competition among insurers.
5.5 Conclusions
The world’s medical systems have been in flux for most of the past fifty years. At first, countries built up their medical care systems. Coverage was made universal, and benefits were generous. There was little demand- or supply-side cost sharing.
In the early 1980s, countries realized the unaffordability of generous demand incentives with no control over medical care supply. The typical response was to limit the supply side of the market by capping the total amount of services that could be provided. Given most countries’ commit-ment to universal insurance and low cost sharing, supply-side restrictions were the logical response. This response saved money; the 1980s were char-acterized by much lower growth of medical costs than had taken place during the previous twenty years.
However, the strains in this approach ultimately became apparent. Ex-cess demand led to waiting lists, non-pricing rationing, and the incentive to seek services outside the public sector. As a result, efficiency concerns rose in importance during the 1980s and 1990s.
A focus on efficiency is likely to involve two reforms, which I character-ize as the “third wave” of health care reform: increased competition for services, either at the level of the provider or at the level of the insurer; and increased patient cost sharing. Neither of these is an easy reform to implement. Increased competition increases the incentives for adverse se-lection; increased cost sharing is more burdensome for the poor than for the rich. Nonetheless countries are finding, or are likely to find, they have no alternative but to try these reforms.
This debate between demand-side and supply-side limits is, in my esti-mation, the next great debate in the medical sector. Countries cannot have unlimited demand and unlimited supply, nor can they effectively rely on supply-side controls alone. What sort of demand-side controls they imple-ment, and how they manage the inherent inequities in these systems, will determine the shape of medical care systems for the early part of the twenty-first century.
References
Baumol, William J. 1988. Containing medical costs: Why price controls won’t work.The Public Interest93:37–53.
Blendon, Robert J., John Benson, Karen Donelan, Robert Leitman, Humphrey Taylor, Christian Koeck, and Daniel Gitterman. 1995. Who has the best health care system? A second look.Health Affairs14 (4): 220–30.
Blendon, Robert J., Robert Leitman, Ian Morrison, and Karen Donelan. 1990. Satisfaction with health care systems in ten nations.Health Affairs9 (2): 186–92.
Cutler, David. 1999. Equality, efficiency, and market fundamentals: The dynamics of international medical care reform. Mimeograph.
Cutler, David, and Richard Johnson. 1999. The birth and growth of the social insurance state. Mimeograph.
Cutler, David, and Sarah Reber. 1998. Paying for health insurance: The tradeoff between competition and adverse selection.Quarterly Journal of Economics113 (2): 433–66.
Cutler, David, and Richard J. Zeckhauser. 2000. The anatomy of health insurance. InHandbook of health economics,vol. 1, ed. Joseph Newhouse and Anthony Culyer, 563–643. Amsterdam: Elsevier.
Organization for Economic Cooperation and Development (OECD). 1995.Health policy studies 7. Paris: OECD.