Regression Tree Classification for
Activity Prediction in Smart Homes
Abstract
The growing number of older adults in the population has created an increasing need for health-assistive systems, including prompting interventions to provide activity reminders. In this paper, we present a new regression-tree-based activity forecasting algorithm to predict the occurrence of future activities for prompting initiation of such activities. This automated algorithm extracts high-level features from sensor events and inputs these features to a machine learning algorithm which forecasts when a target activity will next occur. We compare this system to a standard linear regression classification using real data from smart homes. The forecasting algorithm is shown to provide lower error rates over the linear regression model.
Author Keywords
activity forecasting; regression trees; smart homes
ACM Classification Keywords
H.1.2. User/Machine Systems; I.2. Artificial Intelligence
Introduction
The growing population of older adults has created an increasing need for new and innovative assistive technologies that are capable of improving users' lives while reducing the burden placed on caregivers. As the population of adults over 65 increases in the coming Permission to make digital or hard copies of all or part of this work for
personal or classroom use is granted without fee provided that copies are not made or distributed for profit or commercial advantage and that copies bear this notice and the full citation on the first page. Copyrights for components of this work owned by others than ACM must be honored. Abstracting with credit is permitted. To copy otherwise, or republish, to post on servers or to redistribute to lists, requires prior specific permission and/or a fee. Request permissions from
UbiComp '14 Adjunct, September 13 - 17, 2014, Seattle, WA, USA Copyright 2014 ACM 978-1-4503-3047-3/14/09...$15.00. http://dx.doi.org/10.1145/2638728.2641669
Bryan Minor
Washington State University PO Box 642752
Pullman, WA 99203 USA [email protected]
Diane J. Cook
Washington State University EME 121
PO Box 642752
Pullman, WA 99203 USA [email protected]
decades, the number of older adults suffering from cognitive illnesses is also expected to increase, putting a greater burden on healtchare systems and personnel [2]. Many older adults with cognitive illnesses have difficulties performing daily functional tasks, such as cooking, eating, or taking medicine (known as Activities of Daily Living, or ADLs) [11]. The need to provide care for these older adults highlights the growing importance of assistive health technologies.
The development of smart environments is one way in which these problems are being addressed. These environments employ a variety of sensors and
actuators to monitor inhabitants' behavior and improve their comfort, safety, and overall wellbeing, while reducing the burdens placed on caregivers and other healthcare providers. These systems can also be used to provide feedback to both inhabitants and caregivers related to the performance of ADLs and overall health. One form of feedback is in the form of prompts that can be provided to the inhabitant to remind them to
perform certain activities. For example, a prompt could be provided to remind the inhabitant to take their medications each morning at breakfast. While a simple reminder at a fixed time each morning may be
sufficient, Kaushik et. al. [6] have found that prompts that take into account the inhabitant's activities and other context can be more effective. In order to facilitate context-aware prompting, the environment needs to be able to detect and predict the inhabitant's future activities based on observed sensor data and other contextual clues.
In this paper, we present a method for predicting inhabitant activities from sensor events using
regression tree classification algorithms. This method is used to predict the time to the next occurrence of an activity of interest, and we will label it activity
forecasting (AF). Our method does not require real-time activity recognition capabilities, as it relies soley on features derived from the sensor events themselves. We discuss the implementation of this method and evaluate it in comparison to a linear regression-based activity forecasting method.
Related work
Prompting systems have been developed and studied for some time. Many early systems were rule-driven or required knowledge of a user's daily schedule,
employing dynamic Bayesian networks and similar techniques to produce prompts [3, 7, 8, 9, 10]. While these systems are able to adjust prompts based on user activities, they also required input of a user's daily schedule or predefined activity steps.
More recent work has included the incorporation of the user's behavior through activity recognition (AR). Holder and Cook [5] developed a system that learns relations between activities detected through an AR component, creating prompts for a predicted activity based on time elapsed since a reference activity. Das et. al. [4] applied data sampling techniques to address the imbalance between prompt and non-prompt situations and improve prompting performance. Other approaches to activity prediction include
sequential activity prediction using Markov or Bayesian models, which attempt to predict the next event in a sequence. Alam et. al. [1] used a modification of the Active LeZi algorithm to take into account the ON/OFF
nature of home appliances for prediction of the next activity in a sequence.
While these systems provide automated learning and prediction based on a user's activities, many of them rely on a separate activity recognition component to provide information about current and past activities. Our forecasting approach generates the features needed for forecasting directly from the sensor events themselves, without the need for a real-time
recognition component or manual construction of rules for activity times.
Methods
We have designed our AF method as a component in the WSU CASAS smart home project. The CASAS smart home system consists of a network of wireless motion and door sensors placed throughout the home. These sensors monitor movement and door use in the home, sending events over a mesh network which are processed by the middleware and stored in a database on a server. Our AF component provides activity forecasting which can be used by other components in the smart home to generate prompts or provide other useful services. Specifically, given a particular target activity which we wish to predict, AF provides a prediction of the time units that will elapse until the activity will next occur.
Feature Extraction
The sensor data stored by the CASAS system includes the date, time, sensor ID, and sensor message associated with each sensor event. The datasets described in this paper utilized motion and door sensors, but other sensor types can be included.
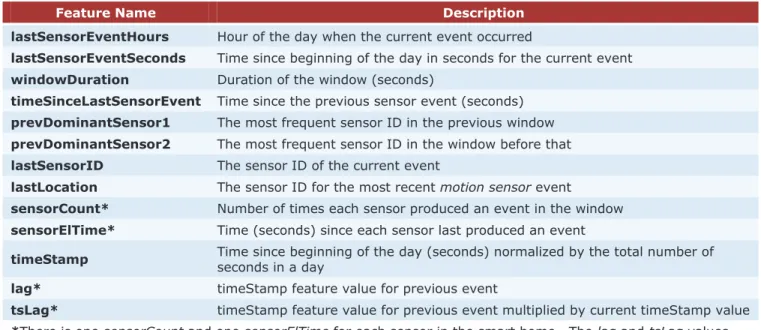
During operation, the feature extraction process stores a history of recent events. For each sensor event, the features listed in Table 1 are generated based on the context window, the size of which is determined dynamically. The temporal features (e.g.,
lastSensorEventHours, windowDuration) are included to provide information about the time of day. This is useful since many activities are likely to occur during certain periods of the day. The dominant sensor features (lastLocation, sensorCount and sensorElTime) provide information on where the activity has recently been occurring within the smart home. The timestamp and lag features provide information on the most recent sensor events in the window. This can help the classifier identify whether recent events were spaced close together or further apart, giving more information on the inhabitant's activities.
Although window sizes are determined during system training based on observed associations between sensors and activity classes, the AF feature extraction does not use information about the current activity. Thus, it does not require the use of a separate AR component, instead deriving all features directly from the recent sensor events.
Note that while the AF algorithm is explained here in the context of activity forecasting within a smart home, the underlying algorithm can be used to forecast activities based on any type of sensor data. The features that we describe are useful for discrete event sensors but can be replaced or integrated as needed with sampling-based sensor features as well.
Regression Tree Classifier
The forecaster portion of AF uses the extracted features to predict the value associated with each event. This target value is the time (in seconds) from the current event to the start (first event) of the next occurrence of the predicted activity. In order to provide this
prediction, a classifier was chosen that would be able to output a numeric classification value from the feature inputs.
Although a simple linear regression or auto-regressive moving average function could be used, these
techniques are limited in that they may not be able to
represent the complex non-linear interactions of the sensor events and inhabitant activities. Instead, we use a regression tree algorithm. Regression trees are similar to decision trees in that they have a root node and are traversed from the root to the leaves, choosing the path at each node based on the value of a split attribute (feature).
However, unlike a decision tree, a regression tree contains a multivariate linear model at each node, which is used to calculate the classification value upon reaching a leaf node. The regression tree is created during the training mode and can then be used to
Feature Name Description
lastSensorEventHours Hour of the day when the current event occurred
lastSensorEventSeconds Time since beginning of the day in seconds for the current event windowDuration Duration of the window (seconds)
timeSinceLastSensorEvent Time since the previous sensor event (seconds) prevDominantSensor1 The most frequent sensor ID in the previous window prevDominantSensor2 The most frequent sensor ID in the window before that lastSensorID The sensor ID of the current event
lastLocation The sensor ID for the most recent motion sensor event
sensorCount* Number of times each sensor produced an event in the window sensorElTime* Time (seconds) since each sensor last produced an event
timeStamp Time since beginning of the day (seconds) normalized by the total number of seconds in a day
lag* timeStamp feature value for previous event
tsLag* timeStamp feature value for previous event multiplied by current timeStamp value *There is one sensorCount and one sensorElTime for each sensor in the smart home. The lag and tsLag values are created for the previous sensor events (for our experiments, the lag size is 12).
Table 1. List of features generated by the feature extraction process. These features, based on a window of previous events, are used as input to the regression tree classifier.
classify events for activity prediction. Although the regression tree requires construction of the tree from training data before use, classification of events with a trained tree is performed quickly and efficiently. This allows for quick classification of new events in a smart home environment.
During training mode, a set of training events are processed by the feature extraction process to generate a set of feature vectors for training. These events are also tagged with the activities that were occurring during each event. (These activity tags could be generated by human annotators, an activity recognition algorithm, or other means.) These activity tags are used to compute the class label for each event. Here, the class label is the actual time that elapsed between the observed sensor event and the next occurrence of the target activity.
The regression tree is created from these training examples. We refer to the collection of training examples as . First, we compute the standard deviation of the class labels in (we label this V(T)). Then, starting from the root node, we build the tree. At each node, we want to choose an attribute to split on. The algorithm selects the attribute that will maximize the reduction in error. Given a particular attribute split, we denote as the subset of examples that would be produced by ith outcome of the split. We use the standard deviation of the subset ( ߪሺܶሻ ) as an estimation of the error for the corresponding examples. The algorithm will then choose the split attribute at each node that maximizes the gain, defined as shown in Equation 1.
ܩܽ݅݊ሺܶǡ ܽݐݐݎሻ ൌ ߪሺܶሻ െ σ
ȁ்ȁȁ்ȁ
ൈ ߪሺܶ
ሻ
ఢ௨௦ሺ௧௧ሻ (1)This splitting process continues recursively with the child nodes to form the entire tree structure. The splitting terminates when one of the following occurs: all attributes have been chosen along the current path, the number of examples remaining at a node is too little (in our case, four or fewer), or the standard deviation of remaining example class values is less than a percent of the original standard deviation (in this case, 5%).
Each node of the tree contains information for a multivariate linear model that can be used to calculate the class value from appropriate attributes. This linear model has the form ݓ ݓଵܽଵ ݓଶܽଶ ǥ ݓܽ, where are attribute values and are weight values
calculated through standard linear regression. At each node, the attributes used in the regression are only those that are used as split attributes in the node's subtree.
Pruning is performed on the regression tree bottom-up, starting from the leaf nodes. At each node, the
regression model from that node is used to classify the subset of training examples associated with the node, and the root mean square error (RMSE) is computed as shown in Equation 2, where error is defined as the difference between the predicted class label and the value.
ܴܯܵܧ ൌ ට
σ ൫ௗ௧ௗሺሻି௧௨ሺሻ൯ మ ͓ೡೞ సభ ͓௩௧௦ (2)The RMSE of the node's subtree is also computed. If the node's regression result outperforms the subtree, the subtree is pruned and the node becomes a leaf node. This pruning process helps to reduce the complexity of the tree and also improve its performance.
Finally, leaf node models are smoothed using their parents' regression models. This helps to improve performance when the number of examples used in constructing a node is small.
Once the classifier has been trained, it can be used to classify events for activity forecasting. When a new event is examined, the features generated by the feature extraction process are passed to the regression tree for classification. Starting at the root node, the regression tree compares the feature specified for that node to the threshold value to decide which child node should be accessed next. When the algorithm reaches a leaf node, the data features are used as inputs to the node's linear model and a class value is computed.
Experimental results
Setup
In order to validate the AF method, we test it on sensor events collected from CASAS smart homes. Our datasets represent sensor data collected from three apartment testbeds, each housing one older adult (65+) with no known cognitive impairments. The residents performed their daily routines during the six months in which data was collected.
The data from each apartment was tagged with related activities by human annotators by looking at the home floorplan and sensor layout, interviewing residents to
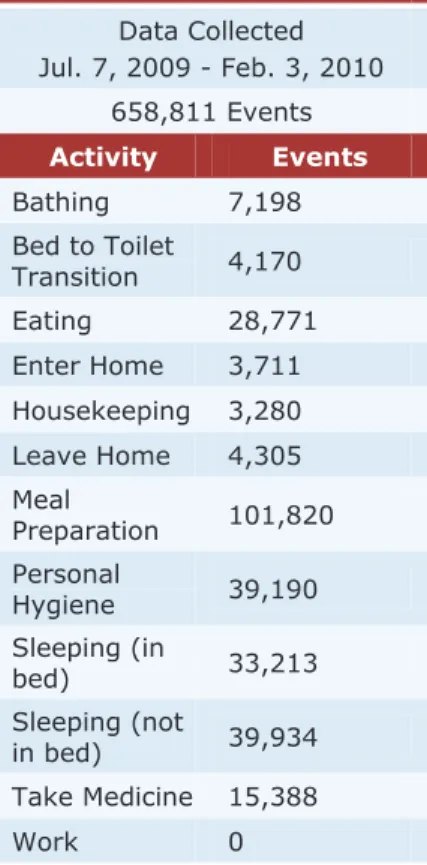
ascertain their daily routines, and using software to visualize the event sequence. Each event is labeled with one of 12 ADL activities or an "other" activity if the event was not part of an activity of interest. These activities, along with other information about the datasets, are shown in Tables 2-4.
To evaluate AF's performance, a sliding window validation approach was used. This is similar to k-fold cross-validation. However, since the sequential ordering of the events is important for the AF algorithm, train and test events cannot be chosen at random. Instead, a sliding window of a fixed length is moved across the dataset to determine the training examples. AF is trained on the data in the window, and then tested on the next event after the window. The window is then shifted by a specified number of events and the train and test process is repeated. All events in a dataset are used to train AF for each activity,
including those labeled as an “other” activity. Although the sliding window only uses feature data from within the sliding window for training, feature extraction window sizes and all features are pre-computed for the entire dataset. This reflects what might occur in a production environment, where AF is able to track events and fill event windows before performing training and testing. It also reduces the complexity of the validation as feature values are only computed once for all of the sliding windows.
To provide a baseline result for comparison, we also implemented a basic linear regression classifier, which we will refer to as LR. This is equivalent to a single-node regression tree that utilizes all of the feature attributes to determine the multivariate model, without Dataset: B1 Data Collected Jul. 7, 2009 - Feb. 3, 2010 658,811 Events Activity Events Bathing 7,198 Bed to Toilet Transition 4,170 Eating 28,771 Enter Home 3,711 Housekeeping 3,280 Leave Home 4,305 Meal Preparation 101,820 Personal Hygiene 39,190 Sleeping (in bed) 33,213 Sleeping (not in bed) 39,934 Take Medicine 15,388 Work 0
Table 2. Data collection period, number of events, and activity information for the B1 apartment dataset.
any pruning or smoothing. This classifier was tested using the same sliding window validation approach used for the full AF algorithm. The features provided to LR were generated by the same feature extraction process used in AF for an accurate comparison between the full regression tree and the basic linear regression. Since the AF algorithm produces a classification value indicating the time until the next occurrence of an activity, it is difficult to define a notion of a true positive rate or accuracy of the classification. Instead, we use an alternative measure of the error to indicate how close the predicted values come to the ground-truth class labels determined from the annotated data. The class labels may vary widely in value based on the time between activity occurrences, making it difficult to compare results for different activities and datasets using un-normalized errors. For example, while an activity like Eating may occur multiple times per day, Housekeeping may occur only a few times a month. The time between occurrences of these two activities can be quite different, making it difficult to compare their error results.
To account for this, we utilize a normalized measure of error based on the RMSE, defined in Equation 3. The range-normalized RMSE (RangeNRMSE) is the RMSE normalized by the range of class label values. The normalized value is useful as it allows more accurate comparison of results for different activities and datasets. A perfectly accurate predictor would have a RangeNRMSE value of zero (no error). The greater the value, the larger the difference between the predicted and actual times and the lower the performance.
ܴܴܽ݊݃݁ܰܯܵܧ ൌ
ோெௌா௫ሺ௧௨ሻିሺ௧௨ሻ
(3)
Results and Discussion
We ran an experiment to validate our activity
forecasting algorithm, to compare the performance of AF with a baseline linear regression method (LR), and to determine the effect of various parameter choices on the performance of the algorithm.
Our experiment was designed to determine the effects of the sliding window size, which determines the number of events the algorithm can use for training. The window sizes chosen were 1,000, 2,000, and 5,000 events. The start of the window was moved forward by 1,000 events with each iteration, and the tests were performed on all three datasets.
Since the actual class labels for each activity are derived from the annotated activity labels, we can only accurately compute the time to the next occurrence of an activity up to the last event of that activity in the dataset. Beyond this point, we do not know when the next occurrence of the activity would be, and thus cannot compute accurate labels. Thus, for each activity, the sliding window validation was stopped at the last event labeled with that activity, instead of the full dataset. However, the number of windows used for each activity was still approximately the same.
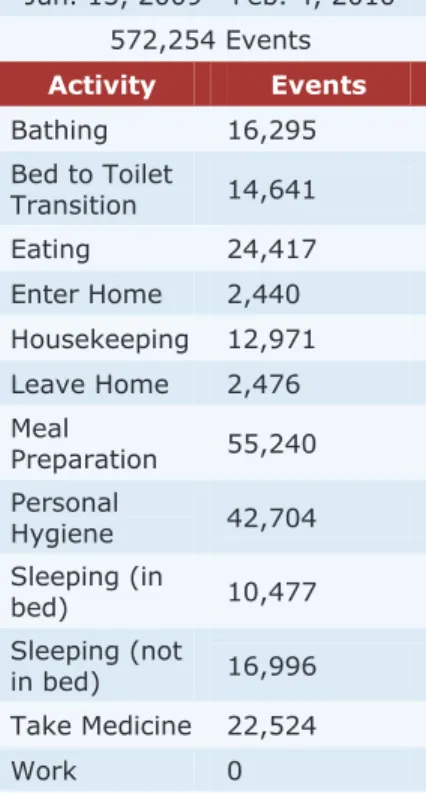
The results of these experiments are shown in Figure 1. The normalized RMSE values for the linear regression classifier are larger than those for AF in most cases. Dataset: B2 Data Collected Jun. 15, 2009 - Feb. 4, 2010 572,254 Events Activity Events Bathing 16,295 Bed to Toilet Transition 14,641 Eating 24,417 Enter Home 2,440 Housekeeping 12,971 Leave Home 2,476 Meal Preparation 55,240 Personal Hygiene 42,704 Sleeping (in bed) 10,477 Sleeping (not in bed) 16,996 Take Medicine 22,524 Work 0
Table 3. Data collection period, number of events, and activity information for the B2 apartment dataset.
Dataset: B3 Data Collected Aug. 11, 2009 - Feb. 4, 2010 518,759 Events Activity Events Bathing 5,151 Bed to Toilet Transition 4,346 Eating 39,453 Enter Home 996 Housekeeping 0 Leave Home 1,246 Meal Preparation 44,842 Personal Hygiene 37,237 Sleeping (in bed) 20,693 Sleeping (not in bed) 8,207 Take Medicine 1,248 Work 108,763
Table 4. Data collection period, number of events, and activity information for the B3 apartment dataset.
0
0.02
0.04
0.06
0.08
0.1
RangeNRMSE for Different Window Sizes for B1 Dataset
AF - 1000
LR - 1000
AF - 2000
LR - 2000
AF - 5000
LR - 5000
0
0.01
0.02
0.03
0.04
RangeNRMSE for Different Window Sizes for B2 Dataset
AF - 1000
LR - 1000
AF - 2000
LR - 2000
AF - 5000
LR - 5000
0
0.05
0.1
0.15
RangeNRMSE for Different Window Sizes for B3 Dataset
AF - 1000
LR - 1000
AF - 2000
LR - 2000
AF - 5000
LR - 5000
Figure 1. Range-normalized error plots for the three datasets. Values in the legend indicate the sliding window size for each group of results. The vertical axis on each of the plots has been shortened to allow better comparison of values. Some of the larger values extend beyond the plots because of this.
The AF error value is usually smaller than the
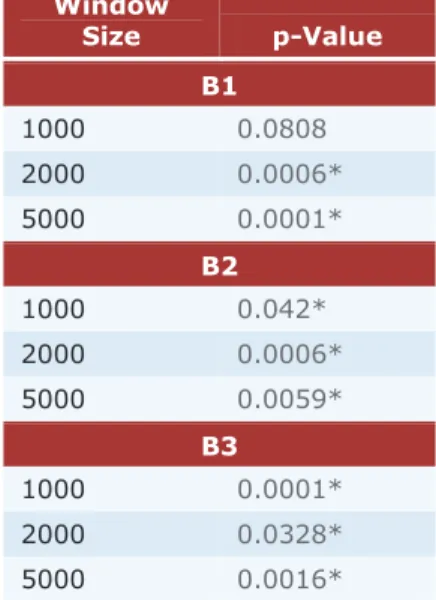
corresponding LR value for the same window size and, in many cases, the worst-performing AF results are better than the best LR results. The improved performance with AF is further supported by the p-values for the results in Table 5.
There is no consistent trend across all datasets for the effects of sliding window size. There is some indication that the AF-1000 case generally performs well on most activities, though it has some difficulty with the Personal Hygiene activity for datasets B1 and B2. Personal Hygiene is the most frequently-occuring activity for both of these datasets, indicating that, for frequent activities, AF can benefit from a larger window size where it is able to observe the repeatability of the activity.
It is also interesting to examine the cases where AF has some trouble with certain activities. The normalized error rates for AF are relatively high for the Enter Home activity, especialy for the B1 and B2 datasets. This may be a result of the fact that the inhabitant is outside the home before the Enter Home activity begins, so no sensor events directly proceed it. The results may be somewhat better for the B3 dataset in this regard if the inhabitant's work caused him or her to have a more consistent time to return home.
The relatively high errors for Taking Medicine in B1 may be due to the location and schedule of the inhabitant for taking medicine - the lower errors for AF with a window size of 5,000 here indicate that being able to observe more instances of the activity helps to increase accuracy, especially if the inhabitant took his or her medicine at varying times during the day.
Overall, however, our AF algorithm performs better than the linear regression classification case. AF’s predictions are usually much lower than those for LR, indicating its ability to model the non-linear
components of the inhabitants’ activities can reduce the error rate and improve performance. Thus, using AF in a predictive prompting system should allow for
generation of prompts much more accurately compared to a simple linear regression algorithm.
Conclusions
In this paper we have proposed an algorithm for automated activity forecasting in a smart home
environment. This algorithm can be used for prompting individuals and other important tasks to enable older adults to live more independently in their homes. Compared to other algorithms, AF has the advantage that it does not rely on a separate AR component, but rather derives feature attributes directly from sensor event data within the smart home.
We have also demonstrated the performance of AF using datasets from smart homes. We have found that AF performs better than a baseline linear regression classification for predicting the time duration to the start of various activities.
In the future, we hope to improve the AF algorithm by looking at the importance assigned to each of the features by the regression tree model, in order to add or remove features to increase performance. One limitation of the results here is that the longest sliding window length examined (5,000 events) is only about two or three days' worth of sensor events in the datasets. In the future we plan to examine the effects of further increasing the training window size, the Window Size p-Value B1 1000 0.0808 2000 0.0006* 5000 0.0001* B2 1000 0.042* 2000 0.0006* 5000 0.0059* B3 1000 0.0001* 2000 0.0328* 5000 0.0016*
Table 5. p-values computed for different tests. For each window size, the p-value listed is for a two-tailed paired t-test between the AF and LR RangeNRMSE values for each parameter. Significant p-values < 0.05 marked.
relationship between the variability of activities and error rates, and including sampling-based features in the AF algorithm to account for different patterns in the sensor data.
To date, we have evaluated our prompting algorithms on historic data and are pilot testing an activity
prompting interface for older adults. In our future work we will conduct a clinical study to evaluate the impact of data-driven activity prompting for older adults in their daily lives.
Acknowledgements
This work was supported in part by NSF grant DGE-0900781 and NIH grant R01EB015853.
References
[1] Alam, M. R., Reaz, M. B. I. and Ali, M. A. M. SPEED: An inhabitant activity prediction algorithm for smart homes. IEEE Trans. on Systems, Man, and Cybernetics- Part A: Systems and Humans 42, 4 (2012), 985-990.
[2] Bates, J., Boote, J. and Beverley, C. Psychosocial interventions for people with a milder dementing illness: a systematic review. Journal of Advanced Nursing 45, 6 (2004), 553-676.
[3] Boger, J., Poupart, P., Hoey, J., Boutilier, C., Fernie, G. and Mihailidis, A. A decision-theoretic approach to task assistance for persons with dementia. Proc. IJCAI 2005, Morgan Kaufmann Publishers (2005), 1293-1299.
[4] Das, B., Cook, D.J., Schmitter-Edgecombe, M. S., and Seelye, A. M. PUCK: An automated prompting
system for smart environments: Toward achieving automated prompting - Challenges involved. Personal and Ubiquitous Computing 16, 7 (2012), 859-873.
[5] Holder, L. B. and Cook, D. J. Automated activity-aware prompting for activity initiation. Gerontechnology 11, 4 (2013), 534-544.
[6] Kaushik, P., Intille, S. S., and Larson, K. User-adaptive reminders for home-based medical tasks: A case study. Methods of Information in Medicine 47, 3 (2008), 203-207.
[7] Lim, M., Choi, J., Kim, D., and Park, S. A smart medication prompting system and context reasoning in home environments. Proc. 4th International Conference on Networked Computing and Advanced Information Management, IEEE (2008), 115-118.
[8] Pineau, J., Montemerlo, M., Pollack, M., Roy, N., and Thrun, S. Towards robotic assistants in nursing homes: Challenges and results. Robotics and Autonomous Systems 42 (2003), 271-281.
[9] Pollack, M. E., Brown, L., Colbry, D., McCarthy, C. E., Orosz, C., Peintner, B., Ramakrishnan, S. and Tsamardinos, I. Autominder: An intelligent cognitive orthotic system for people with memory impairment. Robotics and Autonomous Systems 44, 3-4 (2003), 273-282.
[10] Rudary, M., Singh, S. and Pollack, M. E. Adaptive cognitive orthotics: Combining reinforcement learning and constraint-based temporal learning. Proc. ICML 2004, ACM Press (2004), 91-98.
[11] Wadley, V. G., Okonkwo, O., Crowe, M. and Ross-Meadows, L. A. Mild cognitive impairment and everyday function: Evidence of reduced speed in performing instrumental activities of daily living. The American Journal of Geriatric Psychiatry 15, 5 (2008), 416-424.