Development and application of a PCR
multiplex to assess the quality and
quantity of forensic DNA extracts
By
Sasitaran Iyavoo
A thesis submitted in partial fulfilment for the requirements
for the degree of PhD at the University of Central Lancashire
i
STUDENT DECLARATION FORM
Concurrent registration for two or more academic awards
I declare that while registered as a candidate for the research degree, I have not been a registered candidate or enrolled student for another award of the University or other academic or professional institution.
_________________________________________________________________________
Material submitted for another award
I declare that no material contained in the thesis has been used in any other submission for an academic award and is solely my own work.
Signature of Candidate
Type of Award PhD
ii
ABSTRACT
Isolation of DNA from skeletonised human remains can be problematic. In addition to DNA degradation, enhanced by high temperature and humidity, there are often potent polymerase chain reaction (PCR) inhibitors present within the samples. It is therefore important to extract the maximum amount of available DNA whilst removing any amplification inhibitors that may be present.
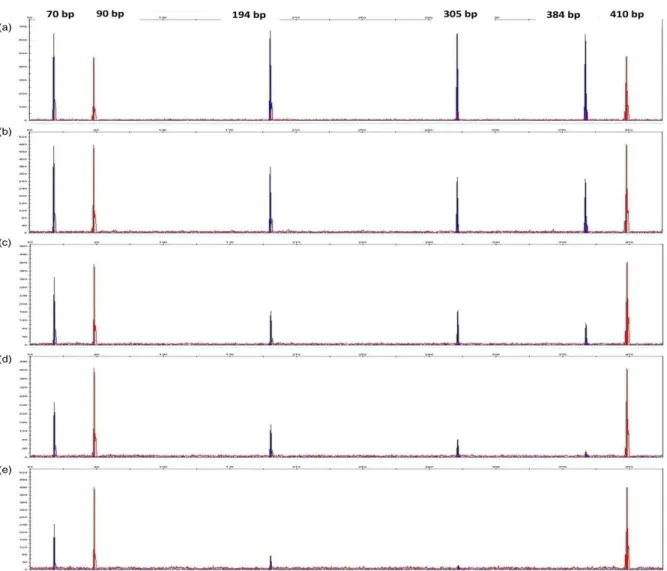
Whilst real-time PCR methods are available for quantification and detection of PCR inhibitors the information received is limited as real-time PCR targets amplicons that are much smaller than those typically targeted in forensic analysis. To gain more information on the quality of extracted DNA a new multiplex PCR assay comprising a 4-plex targeting amplicons of 70 base pairs (bp), 194 bp, 305 bp and 384 bp along with two Internal Amplification Contols (IACs) of 90 bp and 410 bp was developed. This multiplex was optimised so that it worked with template amounts ranging between 0.10 ng and 200 ng; partial profiles were obtained with as little as 0.02 ng. The IACs were effective in detecting PCR inhibitors.
The multiplex also assessed as a quantification tool. Plotting peak height compared to input DNA of a standard dilution series produced a coefficient of determination (R2) of 0.8308. The multiplex was found to provided reasonable estimates of DNA concentration, when the sample concentration was between 12.5 – 100 ng; relative standard deviations were all below 10% in this range for 30% of tested samples. However, real-time PCR proved to be more precise and was used in the rest of the study for the purposes of quantification.
In forensic cases bones and teeth often provide some of the most challenging samples to extract good quality DNA. Using the optimised multiplex to assess the quality of DNA
iii
extracts five extraction methods: ChargeSwitch® gDNA Plant Kit, DNA IQTM System Kit, DNeasy® Blood & Tissue Kit, PrepFiler® BTA Forensic DNA Extraction Kit and phenol-chloroform-isoamyl alcohol extaction methods were assessed for their capability for extracting clean DNA from bone samples. Prior to the main experimentation several evaluation studies were carried out to optimise the methods being used. Based on the results, decalcification was not used for any of the extractions as non-decalcified extracts contained higher amounts of DNA. For the phenol-chloroform-isoamyl alcohol extraction it was determined that whilst ethanol precipitation provided higher amounts of DNA, the extracts using Amicon 30kDa filters (Amicon ultra-0.5 centrifugal filter unit with ultracel-30 membrane) were cleaner. Based on poor results with degraded bone samples a pre-process technique was developed; these extractions started with 250 mg of pulverised bone sample which was then concentrated and cleaned up using Amicon 30kDa filters (Amicon ultra-2 ml centrifugal filters for DNA purification and concentration) before carrying out the standard extraction procedures.
After optimisation of the extraction methods the comparison study showed that the phenol-chloroform-isoamyl alcohol extraction method produced the highest DNA yields with both fresh and degraded bone samples, followed by DNeasy® Blood & Tissue Kit, ChargeSwitch® gDNA Plant Kit, PrepFiler® BTA Forensic DNA Extraction Kit and DNA IQTM System Kit. However, all produced DNA that could be amplified and did not contain any inhibition.
Another application of the multiplex was to assess the effectiveness of different DNA preservation methods by examining the amount and quality of DNA recovered after preservation. Five methods: cell lysis solution (with 1% sodium azide), dehydration / freeze drying,ethanol (96%), freezing and room temperature storage were used to study the effectiveness of preservation methods on fresh and three-month old decomposed pig bone samples which were preserved for 6 weeks, 6 months and 1 year. The results showed that freezing is the best preservation method for both fresh and degraded bone samples for long-term storage followed by ethanol (96%), dehydration / freeze drying and room temperature storage. However, full profiles were obtained from both fresh and
iv
degraded bone samples from all methods, except cell lysis solution (with 1% sodium azide). Cell lysis solution (with 1% sodium azide) preservation method tended to be good for short-term storage but with the long-term preservation, less DNA yield was obtained and also the electropherograms showed higher levels of DNA degradation.
Finally, using the optimised DNA extraction methods, the multiplex was tested using forensic samples comprising of 30 bone samples from casework in Malaysia and simulated body fluid evidences subjected to environmental insult in the United Arab Emirates. The application illustrated the effectiveness of the multiplex to identify PCR inhibitors and identify DNA degradation, providing supplementary information to real-time PCR.
v
TABLE OF CONTENTS
CHAPTER 1 : INTRODUCTION
1.1 DNA PROFILING
1
1.1.1 The processes of DNA profiling 1
1.1.2 DNA profiling of challenging samples 2
1.2 DNA DEGRADATION
2
1.2.1 Introduction 2
1.2.2 DNA persistence in bone 3
1.2.3 Degraded DNA sample analysis 5
1.3 PCR INHIBITION
6
1.3.1 Introduction 6
1.3.2 Detection of PCR inhibitor 8
1.3.3 Prevention of PCR inhibitor 8
1.4 MOLECULAR GENETIC TECHNIQUES FOR FORENSIC DNA
ANALYSIS
9
1.4.1 Polymerase Chain Reaction (PCR) 9
1.4.2 Multiplex PCR reaction 10
1.4.3 Internal Amplification Controls (IACs) 10
1.5 DNA EXTRACTION
11
1.5.1 Phenol-chloroform-isoamyl alcohol 11
1.5.2 Silica-based extraction 12
1.6 DNA PRESERVATION
12
1.6.1 Dehydration / freeze drying 13
1.6.2 Ethanol 13
1.6.3 Freezing 13
1.6.4 Cell lysis solution 14
1.6.5 Room temperature storage 14
vi
CHAPTER 2 : GENERAL METHODS AND MATERIALS
2.1 OVERVIEW
17
2.2 HEALTH, SAFETY AND ETHICS
18
2.3 SAMPLES
18
2.3.1 Sample collection 182.4 BONE PRESERVATION
19
2.4.1 Sample preparation 19 2.4.2 Time frame 19 2.4.3 Preservation methods 192.4.3.1 Cell lysis solution (with 1% sodium azide) 20
2.4.3.2 Dehydration / freeze drying 20
2.4.3.3 Ethanol (96%) 20
2.4.3.4 Freezing 20
2.4.3.5 Room temperature 21
2.5 BONE SAMPLES PULVERISATION
21
2.6 DNA EXTRACTION
21
2.6.1 Phenol-chloroform-isoamyl alcohol 21
2.6.2 Chargeswitch® gDNA Plant Kit 22
2.6.3 DNeasy® Blood and Tissue Kit 23
2.6.4 Prepfiler® BTA Forensic DNA Kit 24
2.6.5 DNA IQ™ System Extraction Kit 25
2.7 EVALUATION OF DECALCIFICATION DURING BONE EXTRACTION
AND USE OF AMICON 30KDA FILTER / ETHANOL PRECIPITATION
DURING PHENOL-CHLOROFOM EXTRACTION
27
2.7.1. Sample preparation 27
2.7.2 Decalcification prior to digestion 28
2.7.3 DNA extraction 28
2.8 EVALUATION OF EXTRACTION METHODS
30
vii
2.9 PRE-PROCESS METHOD DEVELOPMENT FOR DEGRADED BONE
SAMPLES
31
2.9.1 Sample preparation 31
2.9.2 Clean-up after the digestion 32
2.10 DNA QUANTIFICATION
33
2.10.1 Quantification with GoTaq® qPCR Master Mix 33
2.10.2 Quantification of human samples with Quantifiler® 34
2.11 DNA AMPLIFICATION
35
2.11.1 Multiplex PCR reaction 36
2.12 CAPILLARY ELECTROPHORESIS
37
2.13 DATA ANALYSIS
38
2.14 STATISTICAL ANALYSIS
39
CHAPTER 3 : DEVELOPMENT, OPTIMISATION AND
VALIDATION OF A NEW MULTIPLEX (4-PLEX & IACS) PCR
ASSAY
3.1 OVERVIEW
40
3.1.1 Objectives 41
3.2 METHODS AND MATERIALS
42
3.2.1 Multiplex design 42
3.2.1.1 Design of 4-plex primers 42
3.2.1.2 Development of Internal Amplification Controls (IACs) fragments 42 3.2.1.3 Nested PCR using Internal Amplification Controls (IACs) primers 44 3.2.1.4 Development of multiplex (4-plex & IACs) 45
3.2.1.5 Multiplex PCR reaction 45
3.2.2 Sample preparation for multiplex sensitivity studies 46
3.2.2.1 Control DNA 46
3.2.2.2 Degraded DNA 46
viii
3.3 RESULTS
48
3.3.1 Multiplex (4-plex & IACs) design 48
3.3.2 Amplicon specificity study 54
3.3.3 Sensitivity of the multiplex 55
3.3.4 Degraded DNA study using multiplex system 57
3.3.5 PCR inhibitors study using multiplex system 58
3.4 DISCUSSION
69
3.4.1 Multiplex (4-plex & IACs) design and validation 69
3.4.2 DNA degradation study 70
3.4.3 PCR inhibitors study 71
CHAPTER 4 : DNA QUANTIFICATION USING THE NEW
MULTIPLEX (4-PLEX & IACS)
4.1 OVERVIEW
74
4.1.1 Objective 74
4.2 RESULTS
75
4.2.1 Quantification of serial dilution samples using real-time PCR 75
4.2.2 Amplification and analysis of the serial dilution samples using multiplex (4-plex & IACs)
78 4.2.3 Correlation graph plotting using the average peak heights and
DNA concentrations
83
4.2.4 Evaluation of the correlation graph 87
4.2.4.1 Concentration estimation using control DNA 9947A 87 4.2.4.2 Concentration estimation using reference samples 88
4.2.5 Correlation graph of Internal Amplification Controls (IACs) 90
4.3 DISCUSSION
93
CHAPTER 5 : DNA EXTRACTION FROM BONE SAMPLES
5.1 OVERVIEW
96
PART 1 : EVALUATION OF EXTRACTION METHODS
ix
5.3 RESULTS
99
5.3.1 Evaluation of decalcification necessity during bone extraction and use of Amicon 30kDa filter / ethanol precipitation during phenol-chloroform Extraction
99
5.3.1.1 Comparison of DNA concentrations 99
5.3.1.2 Comparison of DNA concentrations using ANOVA 100 5.3.1.3 DNA amplification and analysis of extracted bone samples 102
5.3.2 Evaluation of extraction methods 104
5.3.2.1 Fresh bone samples extraction 104
5.3.2.2 DNA amplification and analysis on extracted fresh bone samples 107
5.3.2.3 Degraded bone samples 109
5.3.3 Pre-process method development for degraded bone samples 111
5.3.3.1 DNA extraction on degraded bone samples 111
5.3.3.2 DNA amplification and analysis of extracted degraded bone samples
116
PART 2: DNA EXTRACTION FROM PRESERVED BONE SAMPLES
5.4 OBJECTIVE
119
5.5 RESULTS
119
5.5.1 DNA concentration from different bone types 120
5.5.2 Evaluation of bone type for DNA extraction using ANOVA 121
5.5.3 Extraction methods comparison for preserved fresh bone samples 122
5.5.4 Extraction methods comparison for preserved degraded bone samples
123
5.5.5 Pairwise comparison between extraction methods 125
5.5.6 DNA amplification and analysis on extracted preserved bone samples
127
5.6 DISCUSSION
134
5.6.1 Decalcification of bone samples 134
5.6.2 Amicon 30kDa filters 135
5.6.3 Efficiency of extraction methods on bone samples 136
x
CHAPTER 6 : DNA PRESERVATION OF BONE SAMPLES
6.1 OVERVIEW
140
6.1.1 Objectives 141
6.2 RESULTS
142
6.2.1 Comparison using ANOVA 142
6.2.2 Preservation methods comparison for fresh bone samples 143
6.2.3 Preservation methods comparison for degraded bone samples 145
6.2.4 Pairwise comparison between preservation methods 146
6.2.5 DNA amplification and analysis on preserved fresh bone samples extracts
148 6.2.6 DNA amplification and analysis on preserved degraded bone
samples extracts
153 6.2.7 Analysis on lysate of cell lysis solution (with 1% sodium azide) 158
6.2.7.1 DNA extraction 158
6.2.7.2 DNA amplification and analysis on extracted lysate 159
6.3 DISCUSSION
161
CHAPTER 7 : APPLICATION OF MULTIPLEX (4-PLEX & IACS)
PCR ASSAY ON FORENSIC SAMPLES
7.1 OVERVIEW
166
7.1.1 Objectives 166
PART 1 : BONE SAMPLES FROM MALAYSIA
167
7.2 RESULTS
169
7.2.1 DNA extraction of forensic bone samples 169
7.2.1.1 Extraction methods comparison using DNA concentration 169 7.2.1.2 Extraction methods comparison using DNA concentration of
selected bone samples
171
7.2.2 Analysis on extracted forensic bone samples using multiplex (4-plex & IACs)
173 7.2.3 Re-analysis on extracted forensic bone samples using multiplex
(4-plex & IACs)
xi
PART 2 : SAMPLES FROM THE U.A.E.
186
7.3 RESULTS
187
7.3.1 Analysis on simulated forensic samples of body fluids using multiplex (4-plex & IACs)
187
7.4 DISCUSSION
189
CHAPTER 8 : GENERAL DISCUSSION AND FUTURE WORK
192
REFERENCES
197
xii
LIST OF TABLES
Table 1.1 The commonly encountered PCR inhibitors, the inhibited samples and their mechanism of inhibition
7
Table 2.1 The sample preparation for different incubation and extraction techniques using phenol-chloroform-isoamyl alcohol.
28
Table 2.2 The samples extracted during pre-process method development. 32
Table 2.3 The optimised primer concentrations of multiplex PCR reaction. 36
Table 2.4 The thermal cycler conditions for multiplex PCR reaction amplification. 37
Table 2.5 The parameters of ABI 3500 POP_6 module. 38
Table 2.6 The parameters for the analysis of PCR fragments. 38
Table 3.1 The sequence of the primers used to generate the IAC90 and IAC410
fragments.
43
Table 3.2 The thermal cycler conditions for amplification of IAC90 and IAC410
fragments.
44
Table 3.3 The sequence of the IAC90 and IAC410 ROX-labelled primers used in nested PCR.
45
Table 3.4 The thermal cycler conditions for multiplex PCR reaction amplification. 46
Table 3.5 The PCR inhibitors and the concentrations used for PCR inhibitory study using multiplex system.
47
Table 3.6 The primer concentrations of 4-plex system. 48
Table 3.7 The thermal cycler conditions of 4-plex system. 49
Table 3.8 The five primer sets for multiplex (4-plex & IACs) PCR reaction tested for their optimum primer concentrations.
51
Table 3.9 The thermal cycler conditions tested for the optimal multiplex PCR reaction amplification.
52
Table 3.10 The DNA concentration and the peak heights of the profiles generated. Only 0.10 ng DNA and below were shown.
xiii
Table 3.11 The properties of DNA profiles developed with human collagen type 1, humic acid, tannic acid and hematin with different concentrations.
59
Table 3.12 The properties of DNA profiles developed with ethanol, phenol and TE buffer with different concentrations.
60
Table 4.1 The concentrations of the DNA samples which were prepared by serial dilution using control DNA 9947A and quantified using GoTaq® qPCR Master Mix.
76
Table 4.2 The concentrations of the DNA samples which were prepared by serial dilution using control DNA 9947A and quantified using Quantifiler® Human DNA Quantification kit.
77
Table 4.3 The average peak heights of the electropherograms produced using the serial diluted control DNA samples.
79
Table 4.4 The statistical data of the comparison between each serial dilution points in the sequence.
85
Table 4.5 The comparison of estimated DNA concentrations with their theoretical DNA concentration.
88
Table 4.6 The comparison of estimated DNA concentrations with their theoretical DNA concentration.
89
Table 4.7 The average peak heights of IACs which were obtained from the electropherograms produced using the serial diluted control DNA samples.
91
Table 5.1 The DNA concentrations extracted from different incubation and DNA concentration techniques using phenol-chloroform-isoamyl alcohol extraction method.
100
Table 5.2 The mean DNA concentrations extracted from combination of different incubation and DNA concentration techniques using phenol-chloroform-isoamyl alcohol.
101
Table 5.3 The DNA concentrations extracted from fresh rib bone samples using five extraction methods.
104
Table 5.4 The DNA concentrations extracted from fresh femur bone samples using five extraction methods.
105
Table 5.5 The statistical data of the comparison between different bone types which were extracted using same extraction method.
xiv
Table 5.6 The DNA concentrations from rib bone samples recovered from animals that had been exposed to the environment for 3 months using five extraction methods.
112
Table 5.7 The DNA concentrations from femur bone samples recovered from animals that had been exposed to the environment for 3 months using five extraction methods.
112
Table 5.8 The DNA concentrations from rib bone samples recovered from animals that had been exposed to the environment for 1 year using five extraction methods.
113
Table 5.9 The DNA concentrations from femur bone samples recovered from animals that had been exposed to the environment for 1 year using five extraction methods.
113
Table 5.10 The statistical data of the comparison between different bone types which were extracted using same extraction method.
114
Table 5.11 The mean DNA concentrations of preserved bone samples (femur and rib) extraction after 6 weeks, 6 months and 1 year.
120
Table 5.12 The statistical data of the comparison between different bone types which were extracted using same extraction method.
121
Table 5.13 The mean DNA concentrations extracted from preserved fresh bone samples after 6 weeks, 6 months and 1 year using different extraction methods.
122
Table 5.14 The mean DNA concentrations extracted from preserved degraded bone samples after 6 weeks, 6 months and 1 year using different extraction methods.
122
Table 5.15 The statistical data of the comparison between different extraction methods on 6 weeks, 6 months and 1 year preserved bone samples.
126
Table 6.1 The statistical data of the comparison between different bone types which were preserved in the same preservation method.
143
Table 6.2 The mean DNA concentrations extracted from preserved fresh bone samples after 6 weeks, 6 months and 1 year on different preservation methods.
xv
Table 6.3 The mean DNA concentrations extracted from preserved degraded bone samples after 6 weeks, 6 months and 1 year on different preservation methods.
145
Table 6.4 The statistical data of the comparison between different preservation methods on 6 weeks, 6 months and 1 year preserved bone samples.
147
Table 6.5 The mean DNA concentrations extracted from lysate of cell lysis solution after 6 weeks, 6 months and 1 year preservation fresh and degraded bone samples.
158
Table 7.1 The bone types, year found and the markings assigned to the bone samples collected from Malaysia.
167
Table 7.2 The mean DNA concentrations extracted from different extraction methods.
170
Table 7.3 The DNA concentrations of selected bone samples which were extracted from different extraction methods.
171
Table 7.4 The ratio of IACs peaks with samples extracted using different extraction methods.
178
Table 7.5 The ratio of IAC peaks with a positive control sample (fresh human bone) extracted using different extraction methods.
xvi
LIST OF FIGURES
Figure 1.1 Schematic overview of bone, depicting gross overview and cellular distribution.
4
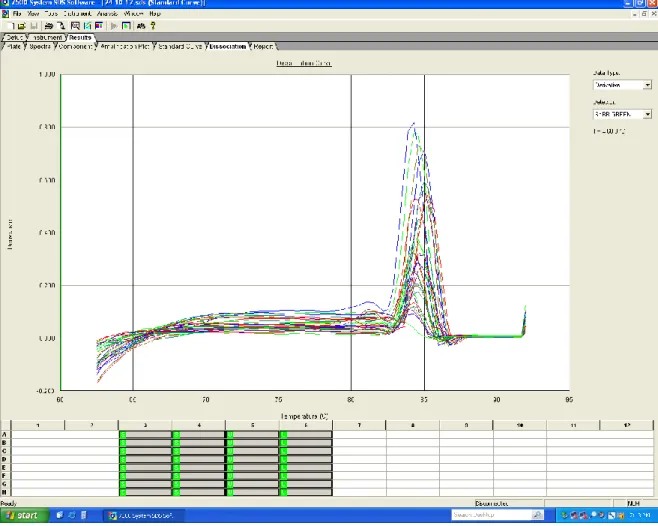
Figure 2.1 Dissociation curve obtained from the quantification using GoTaq® qPCR Master Mix.
34
Figure 3.1 Schematic diagram shows the generation of IAC90 and IAC410fragments from
different regions of the plasmid pBR322, using tailed primers.
43
Figure 3.2 Examples of electropherograms using GeneScan™ 500 ROX™ and GeneScan™ 500 LIZ™ size standards.
50
Figure 3.3 Electropherograms of set 1, set 2, set 3, set 4 and set 5. Each set with different primer concentrations.
53
Figure 3.4 Example of electropherogram shows specific peak for each amplicon (70, 90, 194, 305, 384 and 410 bp) without any additional peaks.
54
Figure 3.5 Electropherograms generated from samples from set 2 with 0.10 ng, 0.05 ng, 0.02 ng and 0.01 ng DNA.
56
Figure 3.6 Examples of electropherograms generated from 1 μl of DNA extract (from a total of 200 μl) extracted from pig soft muscle tissues at 159 ADD, 203 ADD, 295 ADD and 338 ADD.
57
Figure 3.7 Electropherograms generated from 1 ng of control DNA 9947A with final concentrations of 6.25 ng/μl, 12.5 ng/μl, 25 ng/μl, 50 ng/μl and 100 ng/μl Human Collagen Type 1 in 10μl PCR reaction.
61
Figure 3.8 Electropherograms generated from 1 ng of control DNA 9947A with final concentration of 1.25 ng/μl, 2.5 ng/μl, 5 ng/μl, 10 ng/μl, 20 ng/μl and 40 ng/μl humic acid in 10μl PCR reaction.
62
Figure 3.9 Electropherograms generated from 1 ng of control DNA 9947A with final concentrations of 2.5 ng/μl, 5 ng/μl, 10 ng/μl, 20 ng/μl and 40 ng/μl tannic acid in 10μl PCR reaction.
xvii
Figure 3.10 Electropherograms generated from 1 ng of control DNA 9947A with final concentrations of 2.5 ng/μl, 5 ng/μl, 10 ng/μl, 20 ng/μl and 40 ng/μl hematin in 10μl PCR reaction.
64
Figure 3.11 Electropherograms generated from 1 ng of control DNA 9947A with final concentrations of 1.25%, 2.5%, 5%, 7% and 9.5% ethanol in 10μl PCR reaction.
65
Figure 3.12 Electropherograms generated from 1 ng of control DNA 9947A with final concentrations of 0.625%, 1.25%, 2.5%, 5% and 9.9% phenol in 10μl PCR reaction.
66
Figure 3.13 Electropherograms generated from 1 ng of control DNA 9947A with final concentrations of 0.156 X, 0.313 X, 0.625 X, 1.25 X and 2.5 X TE buffer in 10μl PCR reaction.
67
Figure 3.14 Electropherogram generated from 1 ng of control DNA 9947A without any inhibitor in 10μl PCR reaction.
68
Figure 4.1 Electropherograms generated from serial diluted control DNA 9927A with 200 ng/μl, 100 ng/μl, 50 ng/μl, 25 ng/μl and 12.5 ng/μl final concentrations.
80
Figure 4.2 Electropherograms generated from serial diluted control DNA 9927A with 6.25 ng/μl, 3.13 ng/μl, 1.56 ng/μl, 0.78 ng/μl and 0.39 ng/μl final
concentrations.
81
Figure 4.3 Electropherograms generated from serial diluted control DNA 9927A with 0.20 ng/μl, 0.10 ng/μl, 0.05 ng/μl, 0.02 ng/μl and 0.01 ng/μl final
concentrations.
82
Figure 4.4 Boxplots showing the interaction between the serial diluted control DNA samples and the peak heights of the electropherograms generated by those samples.
83
Figure 4.5 Normal q-q plot showing that the data are not normally distributed, thus not suitable to generate a linear line using the sample points.
84
Figure 4.6 The graph represents correlation between average peak heights of 4-plex with different DNA amounts.
86
Figure 4.7 The graph represents correlation between average peak heights of IACs with DNA amounts.
92
Figure 5.1 Boxplots generated from the concentrations of DNA extracted using combinations of different incubation and DNA concentration techniques.
xviii
Figure 5.2 Examples of electropherograms generated from extracted DNA of fresh femur bone samples using decalcification – ethanol precipitation, non-decalcification – Amicon 30kDa filter, non-decalcification – ethanol precipitation and decalcification – Amicon 30kDa filter extraction techniques.
103
Figure 5.3 Boxplots generated from the concentrations of DNA extracted using different extraction methods on femur and rib bones.
106
Figure 5.4 Examples of electropherograms generated from extracted DNA of fresh rib bone samples using phenol-chloroform-isoamyl alcohol, DNeasy® Blood & Tissue Kit, ChargeSwitch® gDNA Plant Kit, PrepFiler® BTA Forensic DNA Extraction Kit and DNA IQTM System Kit extraction methods.
108
Figure 5.5 Examples of electropherograms generated from rib bone samples recovered from animals that had been exposed to the environment for 3 months that were extracted using phenol-chloroform-isoamyl alcohol, ChargeSwitch® gDNA Plant Kit, DNeasy® Blood & Tissue Kit, PrepFiler® BTA Forensic DNA Extraction Kit and DNA IQTM System Kit extraction methods.
110
Figure 5.6 Boxplots generated from the concentrations of DNA extracted from rib and femur bones recovered from animals that had been exposed to the environment for 3 months using different extraction methods.
115
Figure 5.7 Boxplots generated from the concentrations of DNA extracted from rib and femur bones recovered from animals that had been exposed to the environment for 1 year using different extraction methods.
115
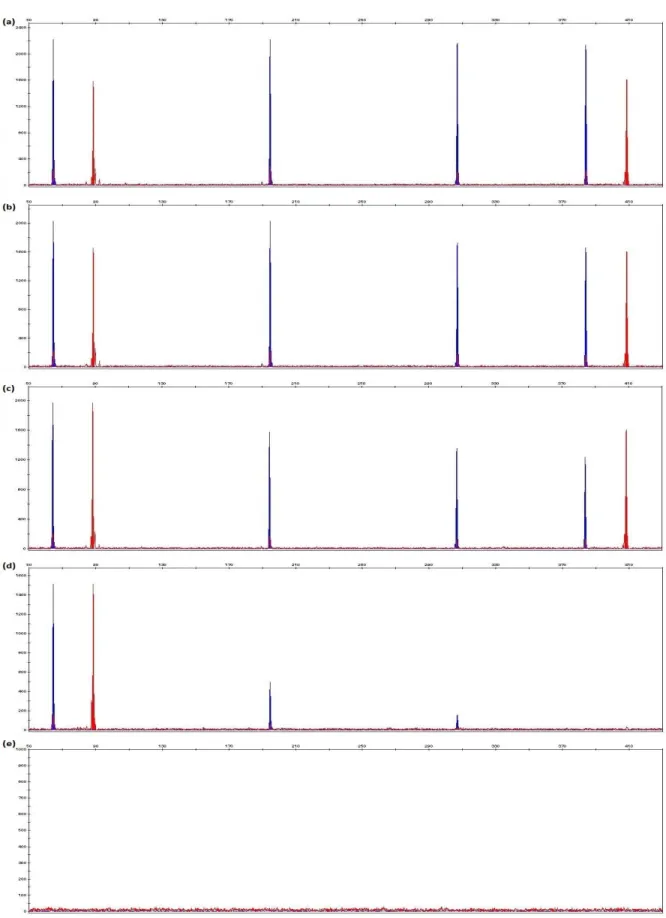
Figure 5.8 Examples of electropherograms generated from extracted DNA of rib bone samples recovered from animals that had been exposed to the environment for 3 months using pre-process technique and phenol-chloroform-isoamyl alcohol, DNeasy® Blood & Tissue Kit, ChargeSwitch® gDNA Plant Kit, PrepFiler® BTA Forensic DNA Extraction Kit and DNA IQTM System Kit extraction methods.
117
Figure 5.9 Examples of electropherograms generated from extracted DNA of rib bone samples recovered from animals that had been exposed to the environment for 1 year using pre-process technique and phenol-chloroform-isoamyl alcohol, DNeasy® Blood & Tissue Kit, ChargeSwitch® gDNA Plant Kit, PrepFiler® BTA Forensic DNA Extraction Kit and DNA IQTM System Kit extraction methods.
xix
Figure 5.10 Boxplots generated from the concentrations of DNA extracted from preserved fresh bone samples after 6 weeks, 6 months and 1 year using different extraction methods.
123
Figure 5.11 Boxplots generated from the concentrations of DNA extracted from preserved degraded bone samples after 6 weeks, 6 months and 1 year using different extraction methods.
125
Figure 5.12 Examples of electropherograms generated from DNA extracts of fresh rib bone samples preserved for 6 weeks using phenol-chloroform-isoamyl alcohol, ChargeSwitch® gDNA Plant Kit, DNeasy® Blood & Tissue Kit, PrepFiler® BTA Forensic DNA Extraction Kit and DNA IQTM System Kit extraction methods.
128
Figure 5.13 Examples of electropherograms generated from DNA extracts of fresh rib bone samples preserved for 6 months using (phenol-chloroform-isoamyl alcohol, ChargeSwitch® gDNA Plant Kit, DNeasy® Blood & Tissue Kit, PrepFiler® BTA Forensic DNA Extraction Kit and DNA IQTM System Kit extraction methods.
129
Figure 5.14 Examples of electropherograms generated from DNA extracts of fresh rib bone samples preserved for 1 year using phenol-chloroform-isoamyl alcohol, ChargeSwitch® gDNA Plant Kit, DNeasy® Blood & Tissue Kit, PrepFiler® BTA Forensic DNA Extraction Kit and DNA IQTM System Kit extraction methods.
130
Figure 5.15 Examples of electropherograms generated from DNA extracts of degraded rib bone samples preserved for 6 weeks using phenol-chloroform-isoamyl alcohol, ChargeSwitch® gDNA Plant Kit, DNeasy® Blood & Tissue Kit, PrepFiler® BTA Forensic DNA Extraction Kit and DNA IQTM System Kit extraction methods.
131
Figure 5.16 Examples of electropherograms generated from DNA extracts of degraded rib bone samples preserved for 6 months using phenol-chloroform-isoamyl alcohol, ChargeSwitch® gDNA Plant Kit, DNeasy® Blood & Tissue Kit, PrepFiler® BTA Forensic DNA Extraction Kit and DNA IQTM System Kit extraction methods.
xx
Figure 5.17 Examples of electropherograms generated from DNA extracts of degraded rib bone samples preserved for 1 year using phenol-chloroform-isoamyl alcohol, ChargeSwitch® gDNA Plant Kit, DNeasy® Blood & Tissue Kit, PrepFiler® BTA Forensic DNA Extraction Kit and DNA IQTM System Kit extraction methods.
132
Figure 6.1 Boxplots generated from the concentrations of DNA extracted after 6 weeks, 6 months and 1 year preserved fresh bone samples.
144
Figure 6.2 Boxplot generated from the concentrations of DNA extracted after 6 weeks, 6 months and 1 year preserved degraded bone samples.
146
Figure 6.3 Showing summary of results generated from DNA extracts of fresh rib bone samples preserved using freezing method for 6 weeks, 6 months, and 1 year. The bone samples were extracted using phenol-chlororom-isoamyl alcohol extraction method.
149
Figure 6.4 Showing summary of results generated from DNA extracts of fresh rib bone samples preserved using cell lysis solution (with 1% sodium azide) for 6 weeks, 6 months, and 1 year. The bone samples were extracted using phenol-chlororom-isoamyl alcohol extraction method.
149
Figure 6.5 Examples of electropherograms generated from DNA extracts of fresh rib bone samples preserved for 6 weeks using freezing, ethanol (96%), dehydration, room temperature and cell lysis solution (with 1% sodium azide) preservation methods. The bone samples were extracted using phenol-chlororom-isoamyl alcohol extraction method.
150
Figure 6.6 Examples of electropherograms generated from DNA extracts of fresh rib bone samples preserved for 6 months using freezing, ethanol (96%), dehydration, room temperature and cell lysis solution (with 1% sodium azide) preservation methods. The bone samples were extracted using phenol-chlororom-isoamyl alcohol extraction method.
151
Figure 6.7 Examples of electropherograms generated from DNA extracts of fresh rib bone samples preserved for 1 year using freezing, ethanol (96%), dehydration, room temperature and cell lysis solution (with 1% sodium azide) preservation methods. The bone samples were extracted using phenol-chlororom-isoamyl alcohol extraction method.
xxi
Figure 6.8 Showing summary of results generated from DNA extracts of degraded rib bone samples preserved using freezing method for 6 weeks, 6 months, and 1 year. The bone samples were extracted using phenol-chlororom-isoamyl alcohol extraction method.
154
Figure 6.9 Showing summary of results generated from DNA extracts of degraded rib bone samples preserved using cell lysis solution (with 1% sodium azide) for 6 weeks, 6 months, and 1 year. The bone samples were extracted using phenol-chlororom-isoamyl alcohol extraction method.
154
Figure 6.10 Examples of electropherograms generated from DNA extracts of degraded rib bone samples preserved for 6 weeks using freezing, ethanol (96%), dehydration, room temperature and cell lysis solution (with 1% sodium azide) preservation methods. The bone samples were extracted using phenol-chlororom-isoamyl alcohol extraction method.
155
Figure 6.11 Examples of electropherograms generated from DNA extracts of degraded rib bone samples preserved for 6 months using freezing, ethanol (96%), dehydration, room temperature and cell lysis solution (with 1% sodium azide) preservation methods. The bone samples were extracted using phenol-chlororom-isoamyl alcohol extraction method.
156
Figure 6.12 Examples of electropherograms generated from DNA extracts of degraded rib bone samples preserved for 1 year using freezing, ethanol (96%), dehydration, room temperature and cell lysis solution (with 1% sodium azide) preservation methods. The bone samples were extracted using phenol-chlororom-isoamyl alcohol extraction method.
157
Figure 6.13 Examples of electropherograms generated using DNA from lysate of cell lysis solution (with 1% sodium azide) which was used for fresh rib bone samples preservation for 6 weeks, 6 months, and 1 year.
159
Figure 6.14 Examples of electropherograms generated using DNA from lysate of cell lysis solution (with 1% sodium azide) which was used for degraded rib bone samples preservation for 6 weeks, 6 months, and 1 year.
160
Figure 7.1 Photographs of the bone samples collected from Malaysia with their marking.
168
Figure 7.2 Boxplots generated from the concentrations of DNA extracted using different extraction methods.
xxii
Figure 7.3 Boxplots generated from the concentrations of DNA extracted using different extraction methods.
172
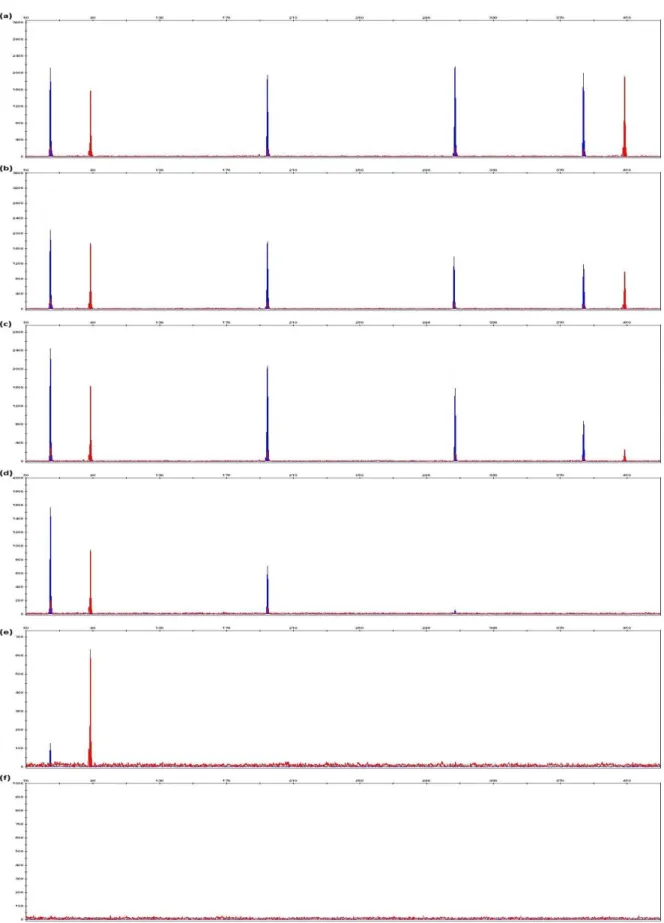
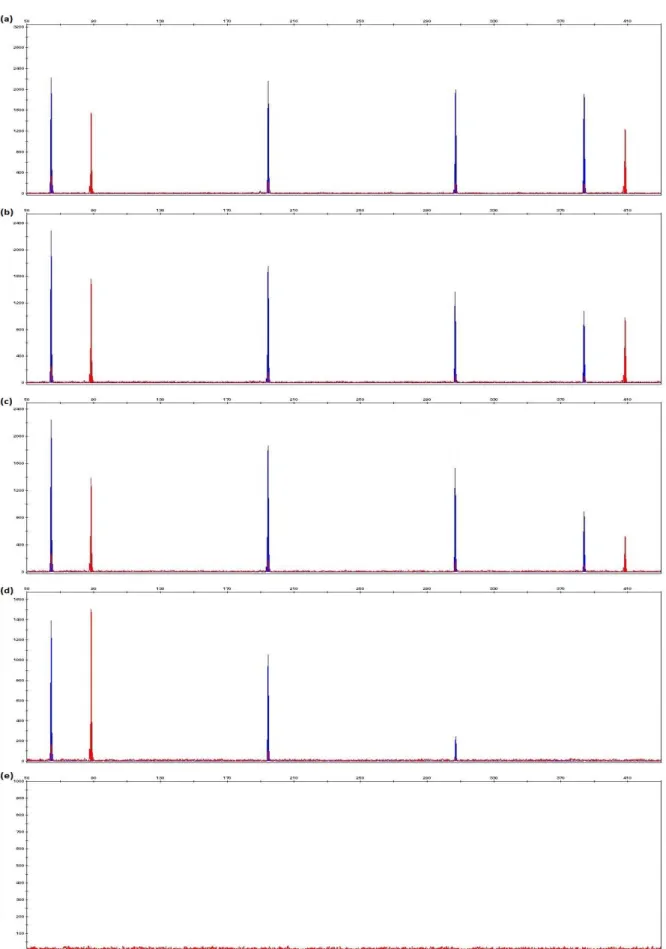
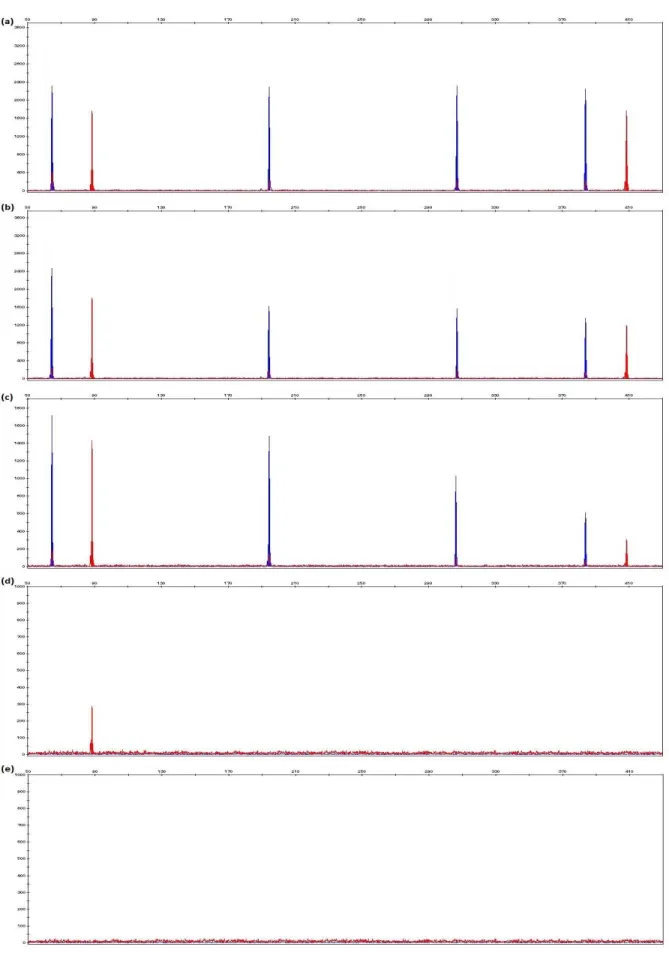
Figure 7.4 Electropherograms generated from bone sample 3 with extraction using phenol-chloroform-isoamyl alcohol, PrepFiler® BTA Forensic DNA Extraction kit, DNA IQTM System kit, DNeasy® Blood & Tissue kit and ChargeSwitch® gDNA Plant kit.
174
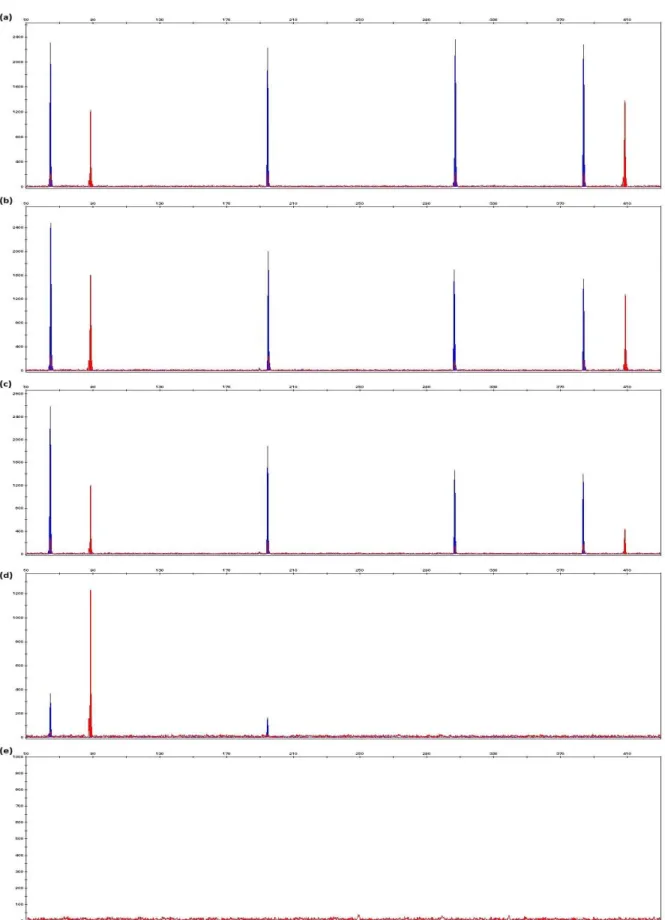
Figure 7.5 Electropherograms generated from bone sample 5 with extraction using phenol-chloroform-isoamyl alcohol, PrepFiler® BTA Forensic DNA Extraction kit, DNA IQTM System kit, DNeasy® Blood & Tissue kit and ChargeSwitch® gDNA Plant kit.
175
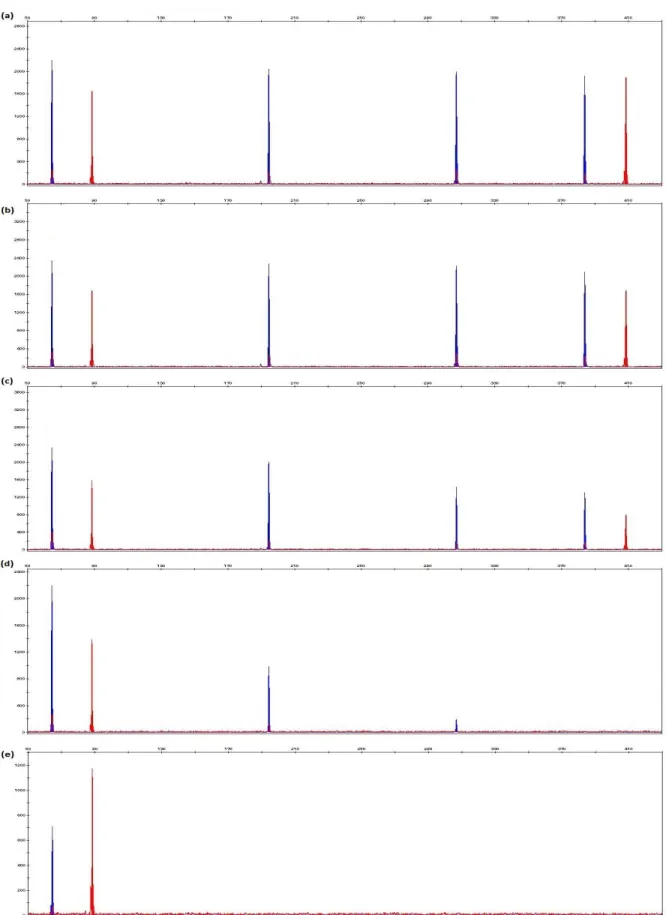
Figure 7.6 Electropherograms generated from bone sample 7 with extraction using phenol-chloroform-isoamyl alcohol, PrepFiler® BTA Forensic DNA Extraction kit, DNA IQTM System kit, DNeasy® Blood & Tissue kit and ChargeSwitch® gDNA Plant kit.
176
Figure 7.7 Electropherograms generated from bone sample 9 with extraction using phenol-chloroform-isoamyl alcohol, PrepFiler® BTA Forensic DNA Extraction kit, DNA IQTM System kit, DNeasy® Blood & Tissue kit and ChargeSwitch® gDNA Plant kit.
177
Figure 7.8 Electropherograms generated from bone sample 3 with extraction using phenol-chloroform-isoamyl alcohol, DNA IQTM System kit, DNeasy® Blood & Tissue kit and ChargeSwitch® gDNA Plant kit.
181
Figure 7.9 Electropherograms generated from bone sample 5 with extraction using phenol-chloroform-isoamyl alcohol, DNA IQTM System kit, DNeasy® Blood & Tissue kit and ChargeSwitch® gDNA Plant kit.
182
Figure 7.10 Electropherograms generated from bone sample 7 with extraction using phenol-chloroform-isoamyl alcohol, DNA IQTM System kit, DNeasy® Blood & Tissue kit and ChargeSwitch® gDNA Plant kit.
183
Figure 7.11 Electropherograms generated from bone sample 9 with extraction using phenol-chloroform-isoamyl alcohol, DNA IQTM System kit, DNeasy® Blood & Tissue kit and ChargeSwitch® gDNA Plant kit.
184
Figure 7.12 Electropherograms generated from extract of blood on cloth using direct amplification and 10-fold diluted sample amplification. 1 μl of each sample was used for amplification.
xxiii
ACKNOWLEDGEMENT
I would love to acknowledge with deep reverence, sincerity and heartiest gratitude to the people for their endless guidance and enthusiastic encouragement to make this thesis possible.
Firstly, I would like to thank my supervisor, Dr. William Goodwin and co-supervisor Dr. Sibte Hadi for their excellent advices and constructive suggestions during this entire PhD project. I would also like to thank Dr. Arati Iyengar and Dr. Judith Smith for their critical reviews and guidance to improve my project. Many thanks go to Professor Jaipaul Singh for his timely helps and moral supports.
Many thanks are due to the staff members of Forensic Anthropology, especially Peter Cross for providing samples from TRACES for my project and Dr. Colin Moffatt for his advice and assistance in statistical calculations.
I would also like to thank fellow friends from UCLan for providing me an excellent support and encouragement during my project especially Sharizah Alimat, Muhammad Shahid Nazir, Rashed Alghafri and Nur Haliza Hassan. Many thanks also go to others for keeping me updated with help and support throughout my entire staying in Preston.
Finally, I wish to express my deep and sincere thanks to my family especially my beloved parents for their love and affection. Big thanks go to my brothers for providing me love, inspiration and encouragement.
1
-CHAPTER 1
INTRODUCTION
_________________________________________________________________________
1.1 DNA PROFILING
Since Alex Jeffreys first developed deoxyribonucleic acid (DNA) profiling in 1985 (Jeffreys et al. 1985) it has played a central role in many forensic investigations; the polymerase chain reaction (PCR) based techniques (Mullis et al. 1986) further increased the scope of forensic DNA profiling allowing smaller degraded template to be analysed. In addition to crime scene analysis DNA profiling is widely used for human identification purposes after various kinds of tragic events such as mass disaster, war and other situations of armed conflict and terrorist attacks. The processing of these samples presents specific challenges (Taroni et al. 2013, Mundorff et al. 2009, Allouche et al. 2008, Gojanovic & Sutlovic 2007).
1.1.1 The processes of DNA profiling
Once in the laboratory, the biological samples go through several processes before DNA profiles are produced. These processes are extraction, quantification, amplification and electrophoresis (Lee et al. 2010). In the extraction stage, DNA is separated from cellular materials and other biological compounds. Extraction is an important process because it will determine the outcome of any downstream processes. Following extraction of forensic samples, the amount of DNA is typically estimated by quantification and an appropriate amount is added to a PCR for amplification. Using capillary electrophoresis, DNA is then separated according to the base pair sizes and a DNA profile generated
2
-(Hopwood et al. 2010, Jobling & Gill 2004). Both the crime and reference samples will undergo these processes separately to avoid cross contamination.
1.1.2 DNA profiling of challenging samples
Since the reference samples are fresh and typically contain high amounts of DNA, it is relatively easy to develop the DNA profiles from them. Because of the nature of crime samples, where samples are typically degraded, inhibited or contain little DNA, it can be very difficult to obtain a full DNA profile (Ballantyne et al. 2011). Thus research has been done and is on-going to improve the outcome of the crime samples analysis. This includes improvements not only in extraction methods, but also amplification techniques and electrophoresis enhancement (Liu et al. 2011, Vuichard et al. 2011, Hua Zhang et al. 2010, Kishore et al. 2006, Gill et al. 2005). One of the most challenging DNA samples to process is old bone (Alaeddini & Ahmadi 2011, Lee et al. 2010).
1.2 DNA DEGRADATION
1.2.1 Introduction
DNA degradation becomes rapid after the death. The common pathways for post-mortem DNA degradation is enzymatic degradation (Paabo et al. 2004). This is caused by the nuclease, namely DNase for DNA degradation. Nuclease causes DNA to degrade into smaller fragments. When the cell membranes rupture and release nutrient rich fluid, environmental microorganisms such as bacteria and fungi accelerate their growth. Most of the microorganisms also contain nuclease enzymes and are able to degrade nucleic acid (Hofreiter et al. 2001, Ogata et al. 1990, Antheunisse 1972).
Environmental conditions such as temperature and humidity also have influence on the DNA degradation. Hot and high temperature tends to degrade the DNA faster (Robins and
3
-Furey 2001) while more chilly and low temperature preserve DNA for longer time (Willerslev et al. 2004, Lindahl 1993). However, longer-term, DNA will continue to degrade through spontaneous degradation routes including depurination followed by breakage at apurinic sites by alkaline hydrolysis, destruction of deoxyribose residues, and hydrolytic cleavage of pyrimidine-glycosyl bonds (Dixon et al. 2006, Lindahl 1993). Conditions such as dry environment may help to reduces DNA degradation, however high humidity provides the substrate for hydrolytic enzymes to degrade DNA (Bender et al. 2004). Phenolic acid such as from soil humus provides low pH which reduces the DNA stability thus causes DNA degradation (Bender et al. 2004, Haglund 1996). Therefore, proper preservation methods could prevent the DNA degradation. More details of the DNA preservation to prevent the DNA degradation are explained in Section 1.6.
1.2.2 DNA persistence in bone
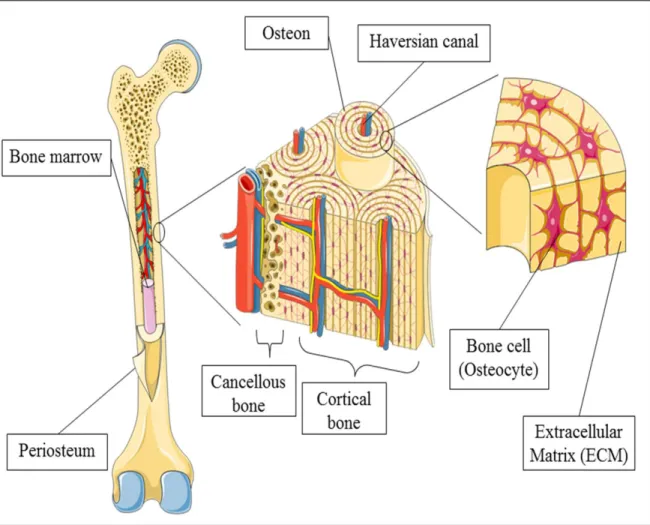
Compared to other biological materials, bone provides protection against DNA degradation (Brundin et al. 2013, Lindahl 1993). Bones are composed of two fundamental structural elements. Cortical or compact bone found primarily on the walls of bone surface and shafts, is made up of solid and dense bone. Trabecular or cancellous bone, also known as spongy bone, is lightweight with honeycomb like, porous structure located at inner surface as shown in Figure 1.1 (Bao et al. 2013).
4
-Figure 1.1: Schematic overview of bone, depicting gross overview and cellular distribution. [Taken from (Bao et al. 2013)]
5
-The molecular structure of bones is made up largely of mineralised Type I collagen. This collagen is a large organic protein molecule comprising of insoluble protein, giving a slightly elastic and flexible fibrous property (Collins et al. 2002). An inorganic type of bioapatite mineral called hydroxyapatite component reinforces it, giving the bone its rigidity and hardness (Campos et al. 2012). Despite wide study of ancient DNA using bone, relatively little known about the degradation of DNA in bone. At structural level the absorption of DNA to the hydroxyapatite and/or binding of DNA to Type 1 collagen may stabilise the DNA but the relative contribution of each and what other factor may be relevant are unclear (Campos et al. 2012). Brundin et al. (2013) said that the presence of hydroxyapatite, which forms the framework of bone, binds DNA and prevents it from degradation. Environmental conditions such as humidity and heat also may affect the DNA survival in the bones (Lee et al. 2010). However, cooler temperature may preserve the DNA longer. Hoss et al. (1996) found that nucleotide bases decomposition in bone decreased about 10 – 25 fold with a 20 °C reduction in temperature. The commonly used bones in DNA analysis are rib (Kemp, Smith 2005, Perry et al. 1988) and femur (Kitayama et al. 2010, Kaiser et al. 2008).
1.2.3 Degraded DNA sample analysis
Degraded DNA samples will produce either partial DNA profiles or negative results (Marjanovic et al. 2009). Usage of size specific clean-up columns such as Microcon® (Merck Millipore) and Amicon® (Merck Millipore) can assist in capturing bigger fragments and eliminate degraded smaller fragments which could inhibit the PCR process by competing with the target DNA (Noren et al. 2013, Seo et al. 2012, Kim et al. 2000). But this will still produce partial DNA profiles since the bigger fragments were degraded. Even though it is not possible to do much in the extraction process, degraded DNA samples can either be enhanced or applied to different amplification processes to produce better DNA profiles. There are many amplification kits in market now that improve the results from degraded DNA samples. A kit such as MiniFiler™ PCR Amplification Kit (Life Technologies™) is more robust with poor quality DNA because of the improved primer
6
-design, buffer composition and amplification conditions (Mulero et al. 2008, Loreille et al. 2007). This kit which has improved primers will bind to the primer binding sides which are closer to the target side thus even in degraded DNA samples, full DNA profiles could be obtained if the target side and the primer binding side are not degraded.
1.3 PCR INHIBITION
1.3.1 Introduction
PCR inhibition occurs when some samples are contaminated by chemicals that inhibit the amplification process, thereby preventing the generation of a DNA profile. PCR inhibitors generally have effects through direct interaction with DNA or interference with DNA polymerases (Mulero et al. 2008, Larkin & Harbison 1999, Katcher & Schwartz 1994). PCR inhibitors which interact with DNA can be co-purified together during extraction process and prevent the amplification of DNA (Alaeddini & Ahmadi 2011, Hudlow et al. 2011, Kim et al. 2000, Akane et al. 1994). Magnesium is a critical cofactor which is required during amplification process. PCR inhibitors which can reduce the Mg2+ availability or interfere the binding of Mg2+ to the DNA polymerase can inhibit the PCR. Common inhibitions are heme from blood (Hudlow et al. 2011, Akane et al. 1994), indigo from denim in jeans materials (Mulero et al. 2008, Larkin & Harbison 1999), humic acid from soil samples (Seo et al. 2013, Watson & Blackwell 2000), collagen from bones (Alaeddini & Ahmadi 2011, Kim et al. 2000) and phenol (Opel et al. 2010, Katcher & Schwartz 1994). The commonly known PCR inhibitors and their mechanism of inhibition are as shown in the Table 1.1.
7
-Table 1.1: Table below shows the commonly encountered PCR inhibitors, the inhibited samples and their mechanism of inhibition.
Inhibitor Effect of inhibition Inhibited
sample References
Calcium
Calcium ions compete with the magnesium ions which are required for the polymerase activity in the PCR reaction
Bone and teeth
Alaeddini & Ahmadi 2011, Opel et al. 2010, Kim et al. 2000, Abu Al-Soud & Radstrom 1998
Collagen
Interrupt the magnesium ions and polymerase interaction in the PCR reaction
Tissue, bone and teeth
Opel et al. 2010, Kim et al. 2001, Makino et al. 1995
Tannic acid Chelate with magnesium ions needed for the polymerase Leather
Schrader et al. 2012, Opel et al. 2010, Abbaszadegan et al. 1993
Humic acid
Chelate with magnesium ions needed for the polymerase and also limiting the available DNA template for amplification through sequence specific binding of DNA
Soil and plant material contaminated samples
Seo et al. 2013, Hudlow et al. 2011, Sutlovic et al. 2005, Watson & Blackwell 2000, Kreader 1996, Akane et al. 1994
Dye Intercalates with DNA
Textile dyes (e.g. indigo from denim)
Schrader et al. 2012, Opel et al. 2010, Mulero et al. 2008, Larkin & Harbison 1999, Shutler et al. 1999
Hematin
Ferric ions from heme unbalance the ions in the PCR reaction and inhibit the magnesium ions and polymerase interaction
Blood
Schrader et al. 2012, Al-Soud & Radstrom 2001, Al-Soud & Radstrom 2000
Phenol, ethanol,
isopropanol Degrade the polymerase
DNA extraction chemical
Schrader et al. 2012, Opel et al. 2010, Wiedbrauk et al. 1995, Katcher & Schwartz 1994
EDTA (Ethylene Diamine Tetraacetic Acid)
Chelating the magnesium ions which are required for the activity of polymerase DNA extraction chemical (e.g. TE buffer) Schrader et al. 2012, Rossen et al. 1992
8
-1.3.2 Detection of PCR inhibition
PCR inhibition can result in reduced product yield or complete failure. In a partial profile caused by PCR inhibitors, the smaller loci are preferentially amplified. But the same pattern also can be obtained from highly degraded DNA sample, thus inhibited sample are very often misidentified as degraded (Butler et al. 2003, Takahashi et al. 1997).
Even though it is difficult to differentiate inhibited DNA from degraded DNA, real-time quantification helps to detect the presence of inhibitors (Seo et al. 2012, Kontanis & Reed 2006). The use of multiplex real-time PCR system such as Quantifiler® uses internal positive control (IPC) to identify the presence of PCR inhibitors. It detects the PCR inhibitors by analyzing target amplification efficiency (Kontanis & Reed 2006). Together with autosomal targets of different sizes, it can simultaneously identify inhibition and degradation in a sample (Swango et al. 2006). This additional information can be very useful in processing the sample with better choices and produce better amplification success rates. Also the usage of Internal Amplification Controls (IACs) / Internal PCR Control (IPC) can indicate the presence of PCR inhibition in the samples from the generated DNA profiles (Nazir et al. 2013).
1.3.3 Prevention of PCR inhibition
The best way of avoiding PCR inhibitors is preventing them from being processed together with the DNA template. For the inhibitors which present within the samples such as blood and certain tissues, this is highly impossible (Hudlow et al. 2011, Akane et al. 1994). For samples present on materials containing the PCR inhibitors such as denim, leather and soil, it will be suitable to swab the samples rather than processing them together with the materials (Seo et al. 2013, Mulero et al. 2008, Watson & Blackwell 2000, Larkin & Harbison 1999,). PCR inhibition can be reduced during the extraction phase (Alaeddini 2012, Alaeddini & Ahmadi 2011), however, to do this without loss of DNA is a big challenge. Thus, DNA extraction methods which favour the inhibitions
9
-elimination should be preferred. Adding a separate clean-up also helps, for example, the use of the clean-up columns such as Microcon® (Merck Millipore), Amicon® (Merck Millipore), MinElute™ (Qiagen) or NucleoSpin® (Clontech) all aim to remove the inhibitors prior to amplification process (Noren et al. 2013, Seo et al. 2012, Kim et al. 2000).
For the extracted samples where the inhibitors are not eliminated, there are several options to overcome their effects during amplification process. The type of DNA polymerase plays big impact on inhibition resistance (Schrader et al. 2012, Wiedbrauk et al. 1995, Katcher & Schwartz 1994). Amplitaq Gold® DNA polymerase which is widely used in the commercial multiplex STR kits is among the most sensitive to inhibition (Schrader et al. 2012, Abu Al-Soud & Radstrom 1998). Increasing the amount of DNA polymerase or adding substance such as bovine serum albumin (BSA) will provide more resistance against PCR inhibitors (Schrader et al. 2012, Comey et al. 1994). Also adding less amount of DNA template into PCR reaction will also assist in reducing inhibitors and emphasize STR kit sensitivity as a key advantage in generating better profiles from inhibited samples (Alaeddini 2012).
1.4 MOLECULAR GENETIC TECHNIQUES FOR FORENSIC DNA
ANALYSIS
1.4.1 Polymerase Chain Reaction (PCR)
The Polymerase Chain Reaction (PCR) developed by Kary Mullis and co-workers in the mid-nineteen eighties is an enzymatic amplification of specific regions of DNA to yield several million copies of a particular sequence (Mullis et al. 1986, Saiki et al. 1985). It is a well-known technique in forensic DNA profiling (Weusten & Herbergs 2012). The PCR is ideally suited for the analysis of forensic samples containing degraded DNA, due to its sensitivity, speed and ability to produce multiple copies of target sequences of DNA (Kline et al. 2005, Schneider et al. 2004).
10
-1.4.2 Multiplex PCR Reaction
Multiplex PCR is a system where simultaneous amplification of multiple regions of template DNA occur (Guo et al. 2014, Chamberlain et al. 1988). Compared to single primer set PCR reaction, multiplex PCR faces great challenges. The optimisation and design of multiplex PCR primers are important because the annealing events in multiplex primer pairs need to occur without interfering with one another and to obtain a good balance between the amplicons (Ruitberg et al. 2001). Thus, multiplex PCR primer design and optimisation of primer annealing temperature, concentration of reaction buffer, polymerase and MgCl2 need to be carried out. The formation of primer-dimers which
occurs because of self-complementarities between primers should be avoided for a successful multiplex PCR reaction (Rachlin et al. 2005, Henegariu et al. 1997).
1.4.3 Internal Amplification Controls (IACs)
Internal Amplification Controls (IACs) are the DNA fragments co-amplified with the target DNA template in a PCR reaction. The sizes of the IACs DNA fragments usually differ from the size of the target DNA template. IACs are usually used to identify false results which may be caused by the PCR inhibitors (Nazir et al. 2013, Zahra et al. 2011, Sachadyn & Kur 1998). It is also useful to differentiate degraded DNA samples from inhibited samples. The presence of the IACs in the absence of the target PCR product demonstrates that the amplification conditions were appropriate, but the target DNA was absent. In competitive PCR reaction, the IACs and the target DNA are amplified with the same pairs of primers; while in non-competitive PCR, different pairs of primers are applied for IACs and target DNA (Huang et al. 2013, Zahra et al. 2011).
11
-1.5 DNA EXTRACTION
The main and ultimate aim of the extraction process is to obtain maximum amount of DNA from the samples submitted. At the same time, it is also important to get a pure DNA extraction by eliminating inhibitors which can reduce the efficiency of the amplification process, thus selection of the extraction technique is very important for samples containing PCR inhibitors.
1.5.1 Phenol-chloroform-isoamyl alcohol
Phenol-chloroform-isoamyl alcohol has been in use for the longest period of time and for many years was most widely used method for DNA extraction (Caputo et al. 2013, Kitayama et al. 2010, Gornik et al. 2002, Hochmeister et al. 1991). Phenol-chloroform-isoamyl alcohol extraction which sometimes is referred as organic extraction involves serial addition of several chemicals. First the cellular material is placed in a tube and proteinase K and detergent such as sodium dodecyl sulphate (SDS) are added to break open the cell membrane and break down the proteins that protect the DNA molecules. The phenol-chloroform mixture is added to separate the proteins from the DNA. The tube is then centrifuged to separate the organic phenol-chloroform phase and the aqueous phase because the DNA more soluble in the aqueous phase. The denatured proteins form a pellicle at the interface of these phases. Then using ethanol precipitation or clean-up columns, the DNA in the aqueous phase can be purified (Hudlow & Buoncristiani 2012, Jakubowska et al. 2012). Even though it is a preferred DNA extraction method for high molecular weight DNA, phenol potentially causes health problems because of its toxic nature (Wang et al. 2011).
12
-1.5.2 Silica-based extraction
Silica-based extraction can be divided into two types: silica column and silica resin (Phillips et al. 2012, Wang et al. 2011, Castella et al. 2006, Nagy et al. 2005, Greenspoon et al. 1998). In both the techniques, cellular material undergoes digestion and DNA binds to the silica surfaces. Silica column captures the DNA and the washing processes are carried out by centrifugal technique while for silica resin, a magnetic stand has to be used and the washing processes are carried out using pipetting. These washing steps only leave behind the clean DNA which is attached to them. Then the elution buffer will be placed to release the DNA into the buffer. Since the introduction of automated systems for DNA extraction, silica resin techniques are more preferred (Fregeau et al. 2010, Brevnov et al. 2009, Nagy et al. 2005, Greenspoon et al. 2004).
1.6 DNA PRESERVATION
Following mass fatality incidents, DNA profiling is essential for identification and re-association of fragmented, burnt or decomposed corpses. Since environmental conditions have more influence on DNA degradation compared to time elapsed since deposition of the biological samples, collection and preservation of biological material obtained from deceased individuals are very important (Graham et al. 2008). The constituents of DNA preservatives should play a role in arresting DNA degradation. Inefficient preservation methods can cause destruction of intact DNA and make it difficult for victim identification. There are number of physical and chemical treatments for successful preservation of biological samples (Graham et al. 2008, Dawson et al. 1998).
13
-1.6.1 Dehydration / freeze drying
Dehydration is based on the assumption that DNA is more stable when dry. By freeze drying process, the moisture in the biological samples will be frozen by reducing the surrounding pressure and then make the water sublimate directly from solid phase to the gas phase, thus drying them for storage (Anchordoquy & Molina 2007). Dehydration also can be carried out using other techniques. Sodium chloride is among one of the common preservatives which has been used for centuries. In solid form, it desiccates the sample which inactivates nucleases and slows microbial growth (Nagy 2010). When in an aqueous solution, sodium chloride denatures proteins including nucleases (Nagy 2010). Silica beads also have a similar effect as sodium chloride in desiccating the biological samples (Nagy 2010, Grassberger et al. 2005). The growth of bacteria occurs in the presence of water as moisture, which also provides a substrate for hydrolytic enzymes (Nagy 2010, Grassberger et al. 2005).
1.6.2 Ethanol
Ethanol works as preservative by removing water from the sample and denaturing proteins and nucleases (Flournoy et al. 1996; Seutin et al. 1991). Ethanol also acts as antimicrobial agent by protecting the biological samples against bacterial degradation (Seutin et al. 1991) and inhibits cellular enzymes (Penna et al. 2001).
1.6.3 Freezing
A preferred method of DNA preservation is freezing. It is done by freezing the biological samples over dry ice (-78 °C) or in liquid nitrogen (-196 °C) (Seutin et al. 1991). Biological sample storage at -20 °C also enhances DNA preservation but ultra-low temperature freezing is recommended for long-term storage (Nagy 2010). Freezing reduces bacterial
14
-activities, thus reduces the DNA degradation (Hosokawa-Muto et al. 2013). Freezing preservation method is the most common method of tissue preservation (Nagy 2010).
1.6.4 Cell lysis solution
Cell lysis buffer is another method for DNA preservation. Cell lysis solution readily permeates tissues, lyses the cells and binds the divalent cations which are required for nuclease activity (Caputo et al. 2011, Graham et al. 2008). Sodium azide can be added to inhibit any bacterial growth (Sadiq 1995). Nuclease activity also can be reduced by adding chelating agents like EDTA which bind to metal ions such as Mg2+ and Ca2+, which are required for normal function of nuclease activity on DNA (Giannakis et al. 1991, Seutin et al. 1991).
1.6.5 Room temperature storage
Room temperature storage is the easiest way to store the biological samples. Dried stains and skeletal remains can be stored at room temperature with low humidity environment (Budowle et al. 2005; Lee et al. 2012). Normally brief storage at room temperature for biological samples is preferred for DNA analysis (Burger et al. 1999). For longer storage adding some chemical such as glycerol will be essential to inhibit the bacterial and fungal growth (Giovani et al. 2006) and to keep the biological samples at dry stage (Lee et al. 2012).
15
-1.7 AIMS AND OBJECTIVES OF THE STUDY
The overall aims of this research were to develop a tool to provide more information than real-time PCR for the assessment of DNA extracts and to test on different types of challenging samples.
The specific objectives were:
1. Develop a new PCR assay by combining Internal Amplification Controls (IACs) with a 4-plex PCR assay to differentiate degraded and inhibited samples.
Attempts were taken to combine an existing 4-plex PCR assay with two previously designed Internal Amplification Controls (IACs) and thus develop a new multiplex PCR assay. This new multiplex was validated to study its sensitivity and capability in amplifying DNA of various concentrations.
2. Use the new PCR assay for quantification of DNA.
The PCR assay was used to amplify various concentrations of control DNA and by their peaks heights, plotted into a correlation graph for the purpose of quantification.
3. Assess the capability of five different extraction methods to extract DNA from fresh and decomposed bone samples.
Phenol-chloroform is the common technique to extract DNA from bone samples. This technique was compared with four other silica-based extraction methods to identify the best extraction method for fresh and decomposed bone samples, which gives a better DNA extract with less inhibition.
16
-4. Assess the efficiency of five different preservation methods to preserve fresh and decomposed bone samples.
A lot of research has been done on preservation of tissue but very limited studies have been undertaken on bone preservation. Therefore, this study attempted to establish a model for the effectiveness of preservation methods on fresh and decomposed bone samples.
5. Assess the new PCR assay on different types of forensic biological samples.
The optimised assay was assessed for it efficiency in identifying the degraded and inhibited biological samples.
17
-CHAPTER 2
GENERAL METHODS AND MATERIALS
2.1 OVERVIEW
The methods and materials described in this chapter have been applied in all the studies detailed in this thesis. Any specific methods which are applied to certain analyses have been described in the relevant chapters.
Good laboratory practices were adopted while doing this research. Clean lab coats and disposable gloves were worn during any laboratory work to reduce contamination. Each batch of extractions was carried out together with a reagent blank to identify any contamination during extraction process. Prior to any experiment, the bench top surface and the equipment were cleaned with ethanol. Sample preparation for PCR was carried out using dedicated pipettes in a PCR hood together with positive and negative controls. All samples in each experiment were prepared in triplicate and the final volume of the extracted samples was fixed at 100 µl unless stated otherwise. This allowed for easier comparisons between methods.
18
-2.2 HEALTH, SAFETY AND ETHICS
Risk assessments and COSHH training have been completed before the use of instruments and chemicals in any experiment (Appendix 1). Ethical approval was obtained from the University of Central Lancashire’s Health, Safety, and Ethics Committee prior to the experimental work (Appendix 2).
The permission to collect forensic samples from Malaysia was obtained from the Forensic Division, Department of Chemistry Malaysia (Appendix 3).
2.3 SAMPLES
2.3.1 Sample collection
Pig bones were used for all evaluation and preservation experiments. Fresh pig bones were purchased from a local butcher while decomposed bones were provided by UCLan’s experimental field site called TRACES (Taphonomic Research in Anthropology: Centre for Experimental Studies) in Burnley (Lancashire, UK).
Forensic samples involving human bones for casework study were collected from the Forensic Division, Department of Chemistry Malaysia and Department of Forensic Medicine, Penang General Hospital, Malaysia through permission and arrangement by Department of Chemistry Malaysia.
19
-2.4 BONE PRESERVATION
2.4.1 Sample preparation
Prior to preservation of bone samples, any soft tissue on the bone was removed. The bone was soaked in commercial bleach (5% sodium hypochloride) for 15 min, rinsed with water and then dried. Bone samples were cut on different days (fresh bones on 1st June 2012 and decomposed bones on 14th June 2012) to avoid cross contamination. Both fresh and decomposed bones were cut into small pieces approximately 1 cm3 using a bone saw. A total of 180 bone pieces (90 fresh and 90 decomposed) were prepared. Each piece was placed into a labelled 15 ml polypropylene tube. Each sample was prepared in triplicate.
2.4.2 Time frame
Samples were prepared to be extracted after 6 weeks, 6 months and 1 year of preservation.
2.4.3 Preservation methods
A total of 5 preservation methods were tested; cell lysis solution (with 1% sodium azide), dehydration/freeze drying, ethanol (96%), freezing and room temperature storage. Thirty-six bone pieces (9 fresh ribs, 9 fresh femurs and 18 decomposed bones (9 ribs and 9 femurs) taken from pigs that had been exposed to the environment at TRACES for three months) were used in each preservation method.
20
-2.4.3.1 Cell lysis solution (with 1% sodium azide)
Each bone piece was placed in a labelled 15 ml polypropylene tube and covered with approximately 3 ml of cell lysis solution (with 1% sodium azide) and stored in an incubator at 25 °C. This solution was prepared by dissolving 1 g of sodium azide (Sigma-Aldrich®, UK) into 100 ml of cell lysis solution (Qiagen, UK).
2.4.3.2 Dehydration / freeze drying
The bone pieces were freeze dried using Micro Modulyo® Freeze Dryer (Thermo Electron). Each bone piece was placed in a 15 ml polypropylene tube which was placed on a plastic tray with the top removed. A dome covering was placed over the tubes and once the machine cooled down, the vacuum was turned on. The tubes were left in the machine for 24 h. Once removed from the machine, the tubes were recapped and stored in the incubator at 25 °C.
2.4.3.3 Ethanol (96%)
Each bone piece was placed in a labelled 15 ml polypropylene tube and covered with approximately 3 ml of ethanol (96%) (Sigma