A fast gene selection method for multi-cancer classification using
multiple support vector data description
Jin Cao
a, Li Zhang
a,b,⇑, Bangjun Wang
a, Fanzhang Li
a, Jiwen Yang
a,b aSchool of Computer Science and Technology & Provincial Key Laboratory for Computer Information Processing Technology, Soochow University, Suzhou 215006, Jiangsu, China b
Collaborative Innovation Center of Novel Software Technology and Industrialization, Nanjing 210000, Jiangsu, China
a r t i c l e
i n f o
Article history:
Received 4 July 2014 Accepted 18 December 2014 Available online 27 December 2014
Keywords:
Support vector data description Gene selection
Multi-class classification Gene expression data Support vector machine
a b s t r a c t
For cancer classification problems based on gene expression, the data usually has only a few dozen sizes but has thousands to tens of thousands of genes which could contain a large number of irrelevant genes. A robust feature selection algorithm is required to remove irrelevant genes and choose the informative ones. Support vector data description (SVDD) has been applied to gene selection for many years. How-ever, SVDD cannot address the problems with multiple classes since it only considers the target class. In addition, it is time-consuming when applying SVDD to gene selection. This paper proposes a novel fast feature selection method based on multiple SVDD and applies it to multi-class microarray data. A recur-sive feature elimination (RFE) scheme is introduced to iteratively remove irrelevant features, so the pro-posed method is called multiple SVDD-RFE (MSVDD-RFE). To make full use of all classes for a given task, MSVDD-RFE independently selects a relevant gene subset for each class. The final selected gene subset is the union of these relevant gene subsets. The effectiveness and accuracy of MSVDD-RFE are validated by experiments on five publicly available microarray datasets. Our proposed method is faster and more effective than other methods.
Ó2014 Elsevier Inc. All rights reserved.
1. Introduction
Cancer classification is one of the conventional problems in microarray gene expression data[1–7]and includes tumor detec-tion and predicdetec-tion of some rare diseases[8–11]. Many methods have been applied to cancer classification, such as naive Bayes clas-sifier (NBC) [12], partial least squares discriminant analysis (PLSDA)[13], support vector Machines (SVMs)[14,15], andk near-est neighbor (kNN)[16].
The accuracy of cancer classification largely depends on the bio-logical relevance of genes[17]. Thus, gene selection can be viewed as a key stage for cancer classification based on microarray data and feature selection algorithms have been rapidly developed in the past few decades. For the gene expression data, the expression level of some genes is highly correlated, which plays an important role in biological evolution. When these genes are located on the same biological path, this correlation is more pronounced[18]. In this case, traditional feature selection methods ignore the relation-ships between genes, and choose only a few from these highly related genes. The irrelevant genes not only result in lower
classi-fication performance, but also add extra difficulties in finding informative genes[19,20].
As a general learner, SVM could be applied to the problems of classification [21], regression [22], and feature extraction [23]. Here, we focus on feature selection. Considering whether the evaluation criterion involves classification models, we can divide SVM-based feature selection methods into three groups: wrapper feature selection based on SVM, embedded feature selection based on SVM, and hybrid feature selection of filter and wrapper based on SVM.
Weston et al. proposed the wrapper feature selection algorithm based on SVM, which finds useful features by minimizing bounds on the leave-one-out error using gradient descent [24]. Guyon et al. proposed a SVM-RFE (recursive feature elimination) feature selection algorithm, which is the most representative algorithm
[23]. Duan et al. presented a gene selection method similar to SVM-RFE, called MSVM-RFE. At each step, MSVM-RFE trains multi-ple linear SVMs on subsammulti-ples of training data and computes the feature ranking scores from statistical analysis of the weight vec-tors[25]. However, MSVM-RFE is computationally more expensive than SVM-RFE. Embedded feature selection algorithms based on SVM are similar to other embedded methods. Li et al. proposed an embedded feature selection algorithm[26]that can adaptively identify important features through introducing data driven
http://dx.doi.org/10.1016/j.jbi.2014.12.009
1532-0464/Ó2014 Elsevier Inc. All rights reserved.
⇑ Corresponding author at: School of Computer Science and Technology & Provincial Key Laboratory for Computer Information Processing Technology, Soochow University, Suzhou 215006, Jiangsu, China.
Contents lists available atScienceDirect
Journal of Biomedical Informatics
j o u r n a l h o m e p a g e : w w w . e l s e v i e r . c o m / l o c a t e / y j b i nweights, which simultaneously implements classification and gene selection. However, this method requires adjusting more parame-ters, and its performance largely depends on those parameters. How to design the objective function based on the standard SVM is the key and difficult issue of this type of algorithm. Lee and Leu proposed a hybrid feature selection algorithm based on SVM for microarray data analysis [27]. Specifically, this method uses the genetic algorithm to generate a number of subsets of genes, the chi square test to select a proper number of the top-ranked genes for data analysis, and SVM to verify the efficiency of the selected genes.
Among the methods mentioned above, SVM-RFE has attracted considerable attention for its simplicity and intuition. However, since SVM-RFE can only be applied to binary classification prob-lems, Jeong et al. proposed feature selection algorithms based on support vector data description (SVDD) for one-class classification problems[28]. SVDD can describe a target data distribution, also called one-class SVM [29–31]. Two feature selection algorithms based on SVDD were presented in[28], or SVDD-radius-RFE and SVDD-dual-objective-RFE. SVDD-radius-RFE minimizes the bound-ary of target samples measured by its radius squared[28]. SVDD-dual-objective-RFE maximizes a dual-objective function of SVDD to provide a compact description boundary. However, it is very time-consuming to apply both SVDD-based methods to gene selection.
SVDD-based feature selection methods were proposed for one-class one-classification problems, and they cannot be applied to multi-class problems. Although SVM-RFE can be extended to multi-multi-class classification problems by using the strategies of one-against-all
[32], one-against-one[33], decision tree[34], and so on, its training speed is not optimistic.
To solve multi-class classification problems and reduce the time complexity of both SVM-RFE and the SVDD-based feature selection methods, we propose a multiple SVDD-RFE (MSVDD-RFE) method. Specifically, we first learn multiple feature selection models via multiple SVDD models, where each class has a corresponding model. For each model, we remove features according to the direc-tion energy of its center vector. If the energy in some direcdirec-tion is small, the feature corresponding to this direction is eliminated. In doing so, multiple feature subsets are obtained by multiple models. Then, we combine these subsets into the selected feature subset. The concept of MRFE can be generalized to SVDD-radius-RFE and SVDD-dual-objective-RFE when handling multi-class multi-classification problems. We validate that MSVDD-RFE provides more precise classification performance and less time consumption, by experiments on five public microarray datasets.
Section2introduces SVDD and two SVDD-based feature selec-tion algorithms, and proposes multiple SVDD for feature selecselec-tion. Simulation experiments are presented in Section3and our conclu-sions are presented in Section4.
2. Methods
We introduce SVDD and the two feature selection methods based on SVDD, and propose the multiple SVDD-based feature selection method.
2.1. Support vector data description
SVDD is a one-class classifier [29–31]. Compared with SVM, SVDD only allows learning from one-class data. SVDD can be implemented using hyperplane or hypersphere methods. The for-mer takes the origin as an abnormal point and makes an optimal hyperplane away from it as far as possible[35], and the latter con-structs a hypersphere to contain as many targets as possible
[29,31]. For SVDD, we only need one-class data or target samples
to construct the learning model expressed by a hypersphere. If a point falls within the hypersphere, it belongs to the target sample set; otherwise, it would be an abnormal point, or outlier.
Given a set of target samplesfxigni¼1, wherexi2RDdenotes the
target sample,Dis the dimensionality of the target sample, andnis the number of target sample, we try to find a hypersphere with minimum volume containing all (or most of) the data. To achieve this, we need to know two parameters, the hypersphere center,
a, and radius,R. The initial form of optimization problem is
min R;a;ni R2þCX n i¼1 ni s:t: kxiak 2 6R2þni;niP0;i¼1;. . .;n; ð1Þ
whereni is a slack variable, andC>0 is the penalty factor which
allows trade-off between the volume of hypersphere and the num-ber of target objects rejected.
Using the Lagrange multiplier technique, we obtain the dual programming form of (1), min a Xn i¼1 Xn j¼1
a
ia
jxTixj Xn i¼1a
ixTixi s:t: X n i¼1a
i¼1;06a
i6C;i¼1;. . .;n; ð2Þwhere
a
iis the Lagrange multiplier. The hypersphere center,a, andradius,R, can be expressed by Lagrange multipliers,
a¼X n i¼1
a
ixi; ð3Þ and R2ðxsvÞ ¼kxsvak2¼xTsvxsv2 Xn i¼1a
ixTsvxiþ Xn i¼1 Xn j¼1a
ia
jxTixj; ð4Þwherexsv is a support vector with its corresponding Lagrange
mul-tiplier 0<
a
sv<C.2.2. SVDD-based feature selection methods
Two SVDD-based feature selection methods were proposed in
[28]and are described briefly here. There are two cases, consider-ing either a few outliers and targets, or only considerconsider-ing targets. We will only discuss the latter.
2.2.1. SVDD-radius-RFE
The performance of SVDD strongly depends upon how com-pactly the constructed hypersphere describes the target samples, while discriminating outliers[28]. The size of hypersphere can be characterized by its radius. The criterion for feature selection in SVDD-radius-RFE is related to the hypersphere radius. The term
R2x
sv
ð Þin(4)is the radius square based onxsv. LetSVbe the
sup-port vector set. Then the average radius square,Jr, is defined as
Jr¼ X xsv2SV R2x sv ð Þ SV j j ; ð5Þ
which may be rewritten as
Jr¼ 1 SV j j X xsv2SV xT svxsv2 Xn i¼1
a
ixTsvxiþ Xn i¼1 Xn j¼1a
ia
jxTixj ! : ð6ÞLetJrðpÞbe the size of hypersphere excluding featurep. The worst feature is the one with the largestJrðpÞ. That is, featurep
has little effect on the size of the hypersphere. The worst feature
[28]is the one with the smallest value ofðJrJrðpÞÞ. Thus, the
p¼argmin
p¼1;...;D
JrJrðpÞ
ð Þ; ð7Þ
which implies that featurepshould be removed from the feature
set.
2.2.2. SVDD-dual-objective-RFE
LetJd andJdðpÞbe the value of the objective function in the dual programming of SVDD and the recalculated value of the objec-tive function without featurep, respectively. Thus, we have
Jd¼ Xn i¼1
a
ixTixi Xn i¼1 Xn j¼1a
ia
jxTixj; ð8Þ and JdðpÞ ¼ Xn i¼1a
ðpÞixðpÞ T ixðpÞi X n i¼1 Xn j¼1a
ðpÞia
ðpÞjxðpÞ T ixðpÞj; ð9ÞwhereðpÞdenotes that featurephas been removed. The effect of removing redundant features is calculated byðJdJdðpÞÞ.
Similarly, the criterion function of SVDD-dual-objective-RFE can be expressed as
p¼argmax
p¼1;...;D
JdJdðpÞ
ð Þ; ð10Þ
which also implies that featurepshould be removed from the
fea-ture set.
2.3. The proposed method
We propose a novel SVDD-based feature selection method for multi-class classification tasks. Distinct from SVDD-radius-RFE and SVDD-dual-objective- RFE, the center point is used to select features. Let the center point be a¼½a1;a2;. . .;aDT, where j jai
could represent the average magnitude in the i-th direction on all target samples. Leta2
i denote the energy of thei-th direction.
Largera2
i implies wider distribution of target data in thei-th
direc-tion. Conversely, ifa2
i is small, then the data must be compact in
thei-th direction. Our goal is to contain as many target points as possible. Compact data would produce a small hypersphere radius, which could not contain most target data. Thus, features in com-pact distribution direction(s) should be removed, and those in dis-persed distribution direction(s) should be retained.
Suppose we have a set of training samplesX¼ fxi;yig n
i¼1, where
xi2RD;Dis the dimensionality of samples,yi2 f1;2;. . .;cgis the
class label ofxi;c is the number of classes, andnis the number
of samples. Only one class is used to train an SVDD model without considering the other classes. We train an SVDD model for each class to make full use of the training samples.Fig. 1 gives the framework of MSVDD-RFE. We first divide the setXintocsubsets according to class labels, whereXjdenotes the subset containing
samples belonging to thej-th class. Then we train an SVDD model for thej-th class, producing feature subsetFj. Finally, these feature
subsets are combined to form the index subset,F.
Similar to SVM-RFE, we remove one feature from the feature set in each iteration. Using the subsetXj, we train an SVDD model and
obtain the center vector,aj, for thej-th class. Since aj i
2
represents the importance of thei-th feature in thej-th class, we can eliminate unimportant features based on the energy. We remove the feature with smallest aji 2from the current feature set and update the subsetXjwhich now contains less features. We repeat the
proce-dure until we obtain sufficient features. We combine thecindex subsets,Fj;j¼1;. . .;c, to generate the index subset,F, which could
contain more discriminating features than any individualFj, due to
all categories being considered. The detail algorithm is given in
Algorithm 1.
Feature subsets inAlgorithm 1are the index sets of selected features, i.e., these features are retained. We focus on the feature selection and obtain a new dataset with less features. Any suitable classifier, such as SVM,kNN, or neural network could be used to build a classification model on the resultant dataset.
Algorithm 1. MSVDD-RFE
Input: Training samplesfxi;yig n
i¼1, and the dimensionality of
the subspaced.
Output: Index subset of selected featuresF.
1 Forj¼1;2;. . .;c
2. For thej-th training set,Xj¼fxi;yi¼jg, initialize the
index set of selected features,Fj¼f1;2;. . .;Dg, and let m¼D.
3. Solve the dual programming (2), and obtain the center of thej-th hypersphere,aj¼ aj 1;a j 2;. . .;a j m h iT 2Rm.
4. Compute the energy of all feature directions
ðajiÞ2;i¼1;. . .;m.
5. Find the feature with smallest energy
p¼arg mini¼1;...;mðajiÞ
2
.
6. Letm¼m1, remove featurep, update the training set,
Xj¼fxi;yi¼jg;xi2Rm, and the index subset of selected
features,Fj¼Fjnp.
7. Ifm¼d, then saveFjand goto 1; otherwise goto 3.
8 End
9. LetF¼F1[F2[ [Fc, and output it.
2.4. Extension of other methods and analysis of computational complexity
SVM-RFE could be extended to multi-class classification prob-lems using the one-against-one, one-against-all, and/or decision tree methods. For these methods, we need multiple SVMs. For the one-against-all method,c SVM models would be required, while the one-against-one and decision tree methods, would require
ðcðc1Þ=2Þ and ð2c1Þ models, respectively. For each model, we can select a feature subset. However, for all these methods the training data must be repeatedly used, which results in irrelevant features. Since the one-against-one method is the faster of the three
[33], we used that as a comparator in our experiments. For simplic-ity, SVM-RFE with one-against-one is denoted by M-SVM-RFE.
The SVDD-radius-RFE and the SVDD-dual-objective-RFE meth-ods can also be extended to multi-class tasks using our concept. We can build multiple SVDD for both methods, and we call them MSVDD-radius-RFE and MSVDD-dual-objective-RFE, respectively. The selection criteria are unchanged. MSVDD-radius-RFE removes
the feature with the smallest ðJrJrðpÞÞ and
MSVDD-dual-objective-RFE removes the feature with the largestðJdJdðpÞÞ.
These two extended methods are compared with our proposed method.
We analyze the computational complexity for these multi-task methods. Without loss of generality, let n0¼n=c wheren0 is the
number of samples in each class. Since both SVM and SVDD are quadratic programs, their complexity is related to the number of variables. Let the computational complexity of single SVM be
ComQð2n0Þ Oð8n03Þ, and that of single SVDD be
ComQðn0Þ Oðn03Þ. When using SVM-RFE to select features, the
computational complexity of one model is OððDþ8n03ÞðDdÞÞ,
wheredis the dimensionality of the subspace. In MSVDD-RFE, a model has computational complexity OððDþn03ÞðDdÞÞ. When
applying MSVDD-radius-RFE and MSVDD-dual-objective-RFE, the computational complexity of a model isOððn02Dþn03ÞðDdÞÞ. The
total computational complexity is shown inTable 1. MSVDD-RFE can make full use of training data and simultaneously realize less computation load among SVDD-like methods. Compared to M-SVM-RFE, MSVDD-RFE would have a smaller computational complexity when the number of classescis larger than three or the iterationðDdÞis large enough.
3. Results and discussion
3.1. Datasets and experimental setting
Five publicly available gene microarray datasets were used to validate the performance of our proposed method, and summa-rized inTable 2. The first two datasets (Leukemia and colon Tumor) are two-class datasets, while the other three datasets (Leukemia3, Novartis, and Lung Cancer) are multi-class.
In these data sets, all genes are expressed as numerical values at different measurement levels. Since the value aj
i
2
is related to the value of genes, we normalize each gene on the interval½0;1, so that all genes can be measured on the same scale.
We also consider other feature selection methods. For two-class datasets, six methods were compared: SVM-RFE, SVDD-radius-RFE, SVDD-dual-objective-RFE, MSVDD-radius-RFE, MSVDD-dual-objective -RFE, and MSVDD-RFE. Note that, for SVDD-radius-RFE and SVDD-dual-objective-RFE, only one-class samples are sup-ported. We chose the class with the largest number of samples, or randomly chose the target class when each class had the same number of samples. For multi-class datasets we used only four methods: M-SVM-RFE, MSVDD-radius-RFE, MSVDD-dual-objec-tive-RFE, and MSVDD-RFE. In these methods, the parameterChas a vital influence on experimental result. Therefore, we use 5-fold cross validation to select C to achieve the best results. In the SVDD-like methods, the parameterCtakes five linearly and equally spaced values in the interval ½1=n;1, wheren is the number of training samples. For SVM, C takes values in the set
f0:1;1;10;100;1000g.
We use recalls to evaluate the performance of the methods. The recall of thej-th class is
Recallj¼ TPj TPjþFNj
; ð11Þ
whereTPj is the number of correctly classified samples, andFNjis
the number of incorrectly classified samples in thej-th class. We coded the problems in Matlab R2013a, and conducted the experi-ments using a Pentium PC with 2.8 GHz processor and 2 GB main memory.
3.2. Leukemia dataset
There are two types of leukemia: Acute Lymphoblastic Leuke-mia (ALL) and Acute Myeloid LeukeLeuke-mia (AML). We split the into two subsets: a training set used to select genes and adjust the parameters of classifiers, and a test set used to estimate the perfor-mance of the obtained system. All samples had 7129 features, cor-responding to some normalized gene expression values extracted from microarray images. We took ALL as the target samples and AML as negative samples. This dataset can be found in[36].
MSVDD-RFE, our proposed method, was compared with SVM-RFE, SVDD-radius-SVM-RFE, SVDD-dual-objective-SVM-RFE, MSVDD-radius-RFE, MSVDD-dual-objective-MSVDD-radius-RFE, and no feature selection. For SVM-RFE, SVDD-radius-RFE and SVDD-dual-objective-RFE meth-ods, we found 200 useful features. For RFE, MSVDD-radius-RFE and MSVDD-dual-objective-RFE methods, we used a separate SVDD model to select 100 features and combined these. Hence, we found at most 200 features for these methods.
As discussed above, after obtaining the feature subset, we can use any classifier to classify the reduced data. Here, we compare
knearest neighbor and SVM.
3.2.1. kNN classifier
kNN is a popular conventional classifier due to its simplicity and efficiency.kNN finds theknearest points in the training set for a new test point, and assigns it to the most common class among those neighbors, Sincek influences the classification accuracy, a 3-fold cross validation fork was performed on the training set. Considering the average recall of all methods, we setk¼5 in the following experiments.
Table 3 shows the classification results and running time of these methods.
MSVDD-RFE provides the best average recall, which means that the selected features are more discriminative. The recall rate of AML using MSVDD-RFE is 57% greater than that of MSVDD-dual-objective-RFE, and approximately 6 times that obtained by SVDD-radius-RFE. The average recall rate is also higher (approxi-mately 25%-35%) than the suboptimal result. Comparing computa-tional time, MSVDD-RFE takes significantly less time than all other feature selection methods.
MSVDD-RFE is outstanding among the methods listed here. The experimental results verify the feasibility and effectiveness of our method in feature selection.
3.2.2. SVM classifier
SVM is a state of the art classification system, and has been widely used for classification and regression problems. SVM tries to find an optimal hyperplane with maximal margin.
In the SVM classifier, linear and RBF kernels are used. The RBF kernel requires a kernel parameter, and so the regularization parameterCand kernel parameter were selected by 3-fold cross validation on the training set (Table 4). The advantage of MSVDD-RFE, our proposed method, compared with other methods is clear. The SVM classifier may more suitable for obtaining higher average recall across all the methods, but note that the average recall of MSVDD-RFE is higher withkNN (Table 3). However, the selection of hyperparameters in SVM is a common and difficult problem. Thus, we chosekNN to classify the selected features for its simplicity and efficiency.
Table 1
Comparison of computational complexity.
Method Computational complexity
M-SVM-RFE cðc1Þ=2ðOððDþ8n03ÞðDdÞÞÞ
MSVDD-radius-RFE cðOððn02Dþn03ÞðDdÞÞÞ
MSVDD-dual-objective-RFE cðOððn02Dþn03ÞðDdÞÞ
3.2.3. Selected genes
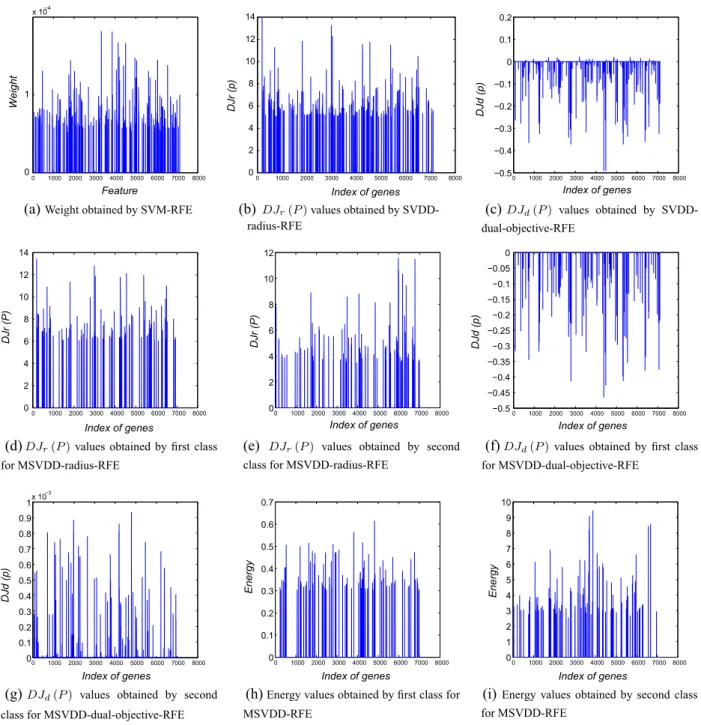
We compared the selected features obtained by these methods on the Leukemia dataset. The criterion function values of different methods (Fig. 2, criterion values are set to zero when they are not selected) were used to measure the significance of selected features.
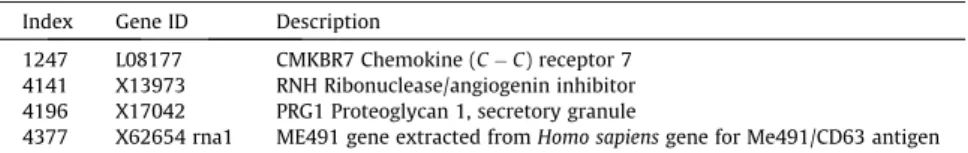
In [37]showed the 50 genes most highly correlated with the ALL-AML class distinction. We compared the feature selection methods with that list, to measure the accuracy of selection of important genes.Table 5shows the percentage of important genes among those selected by these methods. MSVDD-RFE (11.50%) and SVM-RFE (11.22%) are very close, but the other SVDD-based meth-ods select at most one important gene. MSVDD-RFE can not only quickly select genes, but also discriminate the AML and ALL classes well.Table 6gives the index, gene identity (Gene ID) and definition of four genes which are simultaneously selected by two SVDD models in our method.
3.3. Colon tumor dataset
Similar to the Leukemia dataset, the colon Tumor dataset also has two classes, or tumor and normal. Among them, 40 tumor biopsies are from tumors and 22 normal biopsies are from healthy parts of the colons of the same patients. Two thousand out of around 6500 genes were selected based on the confidence in the measured expression levels. We take the 40 tumor biopsies as the target samples and 22 normal biopsies as negative samples in colon Tumor. Since there is no defined training and test set, we randomly select training and test samples. In addition, our final result is the average on the 10 runs so as to avoid randomness. This dataset can be found in[38].
Experimental setting is the same as that in Section 3.2. The average results are shown inTable 7. On the colon Tumor dataset, MSVDD-RFE is inferior to MSVDD-dual-objective-RFE which achieves the best recall. MSVDD-dual-objective-RFE is an exten-sion method using the idea of our multiple SVDD models. However, MSVDD-RFE is much faster than MSVDD-dual-objective-RFE. In addition, MSVDD-RFE is inferior to SVM-RFE which has the least time cost. But the selected features by SVM-RFE are not so useful for classification. In summary, the method proposed here still has certain advantages. Note that the extend versions of SVDD-radius-RFE and SVDD-dual-objective-RFE get better recall rates than the original versions. It is reasonable that the two extend ver-sions have higher time costs since they need to address multiple hyperspheres. In addition, Table 8also gives the index, Gene ID and definition of six genes which are simultaneously selected by two SVDD models in our method.
MSVDD-RFE is inferior to MSVDD-dual-objective-RFE which achieves the best result at the cost of speed. This allows us to make more meaningful comparisons between the two methods. We respectively take the reduced dimension 50, 100, 400 and 800. The other experimental setting are not changed. FromFig. 3, we have the similar conclusion as those from Table 7. Although RFE has a worse classification performance than MSVDD-dual-objective-RFE, the running time of MSVDD-RFE is much less than that of MSVDD-dual-objective-RFE.
3.4. Multi-class datasets
The Leukemia3, Novartis, and Lung Cancer datasets are multi-class datasets. The first two datasets can be downloaded from
http://www.broadinstitute.org/cgi-bin/cancer/datasets.cgi, while
Table 2
Description of five datasets.
Dataset Class Gene Training set Test set
Leukemia 2(ALL/AML) 7129 38(27/11) 34(20/14)
Colon Tumor 2(Tumor/Normal) 2000 31(20/11) 31(20/11)
Leukemia3 3(B-ALL/T-ALL/AML) 999 20(10/4/6) 18(9/4/5)
Novartis 4(Breast/Prostate/Lung/Colon) 1000 52(13/13/14/12) 51(13/13/14/11)
Lung Cancer 5(ADEN/SQUA/COID/SCLC/NORMAL) 12,600 103(70/11/10/3/9) 100(69/10/10/3/8)
Table 3
Comparison of different methods on the Leukemia dataset withkNN. The bold values denote the best average recall among those obtained by the compared methods.
Feature selection method None SVM-RFE SVDD-radius-RFE SVDD-dual-objective-RFE MSVDD-radius-RFE MSVDD-dual-objective-RFE MSVDD-RFE
C1 – 100 1 0.28 1 0.28 0.037 C2 – – – – 1 0.09 0.32 Recall of ALL (%) 100.00 100.00 100.00 100.00 100.00 100.00 100.00 Recall of AML (%) 29.00 35.71 14.29 21.43 21.43 35.70 92.86 Average recall (%) 64.50 67.86 57.14 60.71 60.71 67.86 96.43 Running time (s) – 629.96 10359.75 9522.17 21,671 29,780 335.63
Note:‘‘none’’ means the method without feature extraction, ‘‘running time’’ means the time consumed on feature selection, and the symbol ‘‘–’’ denotes no result in an entry.
Table 4
Comparison of different methods on the the Leukemia dataset with SVM. The bold values denote the best average recall among those obtained by the compared methods.
Method Linear kernel RBF kernel
Recall of ALL (%) Recall of AML (%) Average recall (%) Recall of ALL (%) Recall of AML (%) Average recall (%)
None 100.00 57.14 78.57 100.00 28.57 64.29 SVM-RFE 100.00 57.14 78.57 100.00 64.29 82.14 SVDD-radius-RFE 100.00 50.00 75.00 100.00 35.71 67.86 SVDD-dual-objective-RFE 100.00 35.71 67.86 100.00 28.57 64.29 MSVDD-radius-RFE 100.00 35.71 67.86 100.00 42.86 71.43 MSVDD-dual-objective-RFE 95.00 71.43 83.21 100.00 21.43 60.71 MSVDD-RFE 95.00 92.86 93.93 95.00 92.86 93.93
the last can be downloaded from http://datam.i2r.a-star.edu.sg/ datasets/krbd/LungCancer/LungCancer-Harvard1.html. The Leuke-mia3 dataset[37]is from the previous-generation Human Genome HU6800 AffymetrixÓ microarray, and consists of bone samples obtained from acute leukemia patients at the time of diagnosis:
11 acute myeloid leukemia (AML) samples, 8 T-lineage acute lym-phoblastic leukemia (ALL) samples, and 19 B-lineage ALL samples. The Novartis multi-tissue dataset[39]consists of four distinct can-cer types: 26 breast, 26 prostate, 28 lung, and 23 colon samples, and was processed on the Human Genome U95 AffymetrixÓ
0 1000 2000 3000 4000 5000 6000 7000 8000 0 1 x 10⁻⁴ Feature Weight
(a)
Weight obtained by SVM-RFE0 1000 2000 3000 4000 5000 6000 7000 8000 0 2 4 6 8 10 12 14 Index of genes DJr (p)
(b)
DJr(P)values obtained by SVDD-0 1000 2000 3000 4000 5000 6000 7000 8000 −0.5 −0.4 −0.3 −0.2 −0.1 0 0.1 0.2 Index of genes DJd (p)(c)
DJd(P) values obtained by SVDD-dual-objective-RFE 0 1000 2000 3000 4000 5000 6000 7000 8000 0 2 4 6 8 10 12 14 Index of genes DJr (P)(d)
DJr(P)values obtained by first class for MSVDD-radius-RFE 0 1000 2000 3000 4000 5000 6000 7000 8000 0 2 4 6 8 10 12 Index of genes DJr (P)(e)
DJr(P) values obtained by second class for MSVDD-radius-RFE0 1000 2000 3000 4000 5000 6000 7000 8000 −0.5 −0.45 −0.4 −0.35 −0.3 −0.25 −0.2 −0.15 −0.1 −0.05 0 Index of genes DJd (p)
(f)
DJd(P)values obtained by first class for MSVDD-dual-objective-RFE 0 1000 2000 3000 4000 5000 6000 7000 8000 0 0.1 0.2 0.3 0.4 0.5 0.6 0.7 0.8 0.9 1x 10 −3 Index of genes DJd (p)(g)
DJd(P) values obtained by second class for MSVDD-dual-objective-RFE0 1000 2000 3000 4000 5000 6000 7000 8000 0 0.1 0.2 0.3 0.4 0.5 0.6 0.7 Index of genes Energy
(h)
Energy values obtained by first class for MSVDD-RFE 0 1000 2000 3000 4000 5000 6000 7000 8000 0 1 2 3 4 5 6 7 8 9 10 Index of genes Energy(i)
Energy values obtained by second class for MSVDD-RFEradius-RFE
Fig. 2.Values of ranking criteria obtained by different methods.
Table 5
Important selected genes proportion for selected genes.
Feature selection method Number of imported genes in 50 Important selected genes proportion for selected genes (%)
SVM-RFE 23 11.50 SVDD-radius-RFE 0 0 SVDD-dual-objective-RFE 1 0.5 MSVDD-radius-RFE 0 0 MSVDD-dual-objective-RFE 1 0.5 MSVDD-RFE 22 11.22
microarrays. The 203 specimens of the Lung Cancer dataset[40]
include 139 samples of lung adenocarcinomas (ADEN), 21 samples of squamous cell lung carcinomas (SQUA), 20 samples of pulmon-ary carcinoids (COID), 6 samples of small-cell lung carcinomas (SCLC) and 17 normal lung samples (NORMAL). Each sample is described by 12,600 genes for Lung Cancer.
For Leukemia3 and Novartis, we randomly selected training samples, with the balance as test samples, and repeated this pro-cess for 10 trials. We report the average results inTable 9(for Leu-kemia3) comparing M-SVM-RFE, MSVDD-dual-objective-RFE, and MSVDD-radius-RFE, and MSVDD-RFE. We performed two-tailed t-tests with significant level 0.05 to determine significant differ-ences between our proposed method and the others, also shown inTable 9. Our proposed method, MSVDD-RFE, is superior to the
other methods for both recall rate and time cost. Furthermore, MSVDD-RFE is significantly superior to MSVDD-radius-RFE.
Table 10summarizes the experimental results on the Novartis dataset. MSVDD-RFE achieves the second best average recall, after M-SVM-RFE. However, MSVDD-RFE choses useful features some-what more quickly. The main reason is that Novartis is a four-class dataset. Hence, M-SVM-RFE uses 6 binary SVM models, and RFE employs four hyperspheres for four classes. MSVDD-RFE is significantly superior to MSVDD-dual-objective-MSVDD-RFE. Consid-ering computational time, MSVDD-RFE is a good choice when the number of classes in a dataset is large, which supports the analysis of computational complexity.
Considering the high dimensionality of the Lung Cancer dataset, only 5 trials are performed. All four methods discussed above were
Table 6
Significant genes selected by MSVDD-RFE for discrimination of AML and ALL samples in the Leukemia dataset.
Index Gene ID Description
1247 L08177 CMKBR7 Chemokine (CC) receptor 7
4141 X13973 RNH Ribonuclease/angiogenin inhibitor
4196 X17042 PRG1 Proteoglycan 1, secretory granule
4377 X62654 rna1 ME491 gene extracted fromHomo sapiensgene for Me491/CD63 antigen
Table 7
Comparison of different methods on the colon Tumor dataset. Feature selection
method
None SVM-RFE
SVDD-radius-RFE SVDD-dual-objective-RFE MSVDD-radius-RFE MSVDD-dual-objective-RFE MSVDD-RFE C1 – 100 0.76 0.29 1 1 0.05 C2 – – – – 1 0.32 0.55 Recall of tumor (%) 94.50 ± 0.05 93.00 ± 0.05 88.00 ± 0.11 92.00 ± 0.06 91.00 ± 0.06 91.50 ± 0.03 94.00 ± 0.04 Recall of normal (%) 36.36 ± 0.18 34.55 ± 0.13 37.27 ± 0.21 30.91 ± 0.11 35.45 ± 0.15 63.64 ± 0.20 51.82 ± 0.18 Average recall (%) 65.43 ± 0.09 63.77 ± 0.06 62.64 ± 0.12 61.45 ± 0.05 63.23 ± 0.07 77.57 ± 0.10 72.91 ± 0.09 Running time (s) – 323.16 3140.4 3162.9 5321.1 5044.6 388.12
Note:‘‘none’’ means the method without feature extraction, ‘‘running time’’ means the time consumed on feature selection, and the symbol ‘‘–’’ denotes no result in an entry.
Table 8
Significant genes selected by MSVDD-RFE for discrimination of tumor and normal samples in the colon Tumor dataset.
Index Gene ID Description
98 H13194 ADP-RIBOSYLATION FACTOR-LIKE PROTEIN 2 (Homo sapiens)
465 L33075 Homo sapiensras GTPase-activating-like protein (IQGAP1) mRNA, complete cds
844 M63959 Human alpha-2-macroglobulin receptor-associated protein mRNA, complete cds
849 T54670 P13621 ATP SYNTHASE OLIGOMYCIN SENSITIVITY CONFERRAL PROTEIN PRECURSOR, MITOCHONDRIAL
1207 R39144 HEAT SHOCK FACTOR PROTEIN 2 (Homo sapiens)
1711 D21094 Human mRNA for motor protein, complete cds
0 100 200 300 400 500 600 700 800 20 30 40 50 60 70 80 90 Dimension Average recall (%) MSVDD−dual−objective−RFE MSVDD−RFE
(a) Aeverage recall
0 100 200 300 400 500 600 700 800 0 1000 2000 3000 4000 5000 6000 Dimension
Running time (sec.)
MSVDD−dual−objective−RFE MSVDD−RFE
(b) Running time Fig. 3.Results of different dimension for MSVDD-RFE and MSVDD-dual-objective-RFE.
compared methods initially, but we abandoned MSVDD-dual-objective-RFE and MSVDD-radius-RFE for their time complexity. The average recall and running time for the Lung Cancer dataset are presented inTable 11. These results are similar to those for Novartis. The average recall achieved by M-SVM-RFE, was not sig-nificantly better than for RFE. on the other hand, MSVDD-RFE shows significantly shorter computation time. Thus, again, our proposed method is a good choice when the number of classes on a dataset is large.
4. Conclusion
We propose a new fast gene selection method for multi-cancer classification using multiple SVDD models, MSVDD-RFE. This method can efficiently address classification tasks with a large
number of features and a small number of samples. MSVDD-RFEc-an eliminate feature redundMSVDD-RFEc-ancy MSVDD-RFEc-and realize feature dimension reduction simultaneously. The method also provides more com-pact and discriminative gene subsets.
We performed experiments on five real-world datasets, Leuke-mia, Colon Tumor, Leukemia3, Novartis and Lung Cancer. ThekNN classifier and SVM are used to measure the performance of feature selection. MSVDD-RFE provides good classification performance with less computation time compared to other approaches.
For the Leukemia, Colon Tumor, Leukemia3 and Novartis data-sets, we have average recalls at better than 90%. However, the result of the Lung Cancer dataset was unsatisfying. Since ensemble learning can improve classification performance, we will use ensemble learning to provide enhanced performance on this dataset.
Acknowledgments
We would like to thank three anonymous reviewers and Journal Manager Prabha B. Saikia for their valuable comments and sugges-tions, which have significantly improved this paper. We are also grateful to Professor Jinhui Xu for checking this paper. This work was supported in part by the National Natural Science Foundation of China under Grant Nos. 61373093 and 61033013, by the Natural Science Foundation of Jiangsu Province of China under Grant Nos. BK20140008, BK2011284 and BK201222725, by the Natural Sci-ence Foundation of the Jiangsu Higher Education Institutions of China under Grant No. 13KJA520001, and by the Qing Lan Project.
References
[1]Alizadeh A-A, Eisen M-B, Davis R-E, Ma C, Lossos I-S, Rosenwald A, et al. Distinct types of diffuse large b-cell lymphoma identified by gene expression profiling. Nature 2000;403(6769):503–11.
[2]Alon U, N B, Notterman D-A, Gish K, Ybarra S, Mack D, et al. Broad patterns of gene expression revealed by clustering analysis of tumor and normal colon Table 9
Comparison of different methods on the Leukemia3 dataset.
Feature selection method None M-SVM-RFE MSVDD-radius-RFE MSVDD-dual-objective-RFE MSVDD-RFE
C1 – 100 0.1 0.1 0.1 C2 – – 0.25 0.25 0.25 C3 – – 0.17 0.17 0.17 Recall of B-ALL (%) 98.89 ± 0.04 98.89 ± 0.04 98.89 ± 0.04 100.00 ± 0.00 98.89 ± 0.04 Recall of T-ALL (%) 95.00 ± 0.16 90.00 ± 0.17 87.50 ± 0.21 100.00 ± 0.00 100.00 ± 0.00 Recall of AML (%) 92.00 ± 0.14 78.00 ± 0.22 86.00 ± 0.19 80.00 ± 0.29 90.00 ± 0.11 Average recall (%) 95.30 ± 0.08 91.63 ± 0.08 88.13 ± 0.11 93.33 ± 0.08 96.30 ± 0.03 Running time (s) – 231.55 2458.4 1952.0 199.74 pvalue 0.647 0.0928 0.0251 0.278 –
Note:‘‘none’’ means the method without feature extraction, ‘‘running time’’ means the time consumed on feature selection, and the symbol ‘‘–’’ denotes no result in an entry.
Table 10
Comparison of different methods on the Novartis dataset.
Feature selection method None M-SVM-RFE MSVDD-radius-RFE MSVDD-dual-objective-RFE MSVDD-RFE
C1 – 100 0.31 0.54 0.31 C2 – – 0.31 0.54 0.31 C3 – – 0.30 0.54 0.30 C4 – – 0.31 0.54 0.31 Recall of Breast (%) 96.92 ± 0.04 96.92 ± 0.04 96.15 ± 0.07 99.23 ± 0.02 95.38 ± 0.05 Recall of Prostate (%) 100.00 ± 0.00 100.00 ± 0.00 100.00 ± 0.00 100.00 ± 0.00 100.00 ± 0.00 Recall of Lung (%) 97.14 ± 0.05 99.29 ± 0.02 92.86 ± 0.07 87.86 ± 0.04 99.29 ± 0.02 Recall of Colon (%) 100.00 ± 0.00 100.00 ± 0.00 100.00 ± 0.00 100.00 ± 0.00 100.00 ± 0.00 Average recall (%) 98.52 ± 0.02 99.05 ± 0.01 97.25 ± 0.02 96.77 ± 0.01 98.67 ± 0.02 Running time (s) – 875.06 2516.4 2176.1 249.70 pvalue 0.7341 0.4969 0.0975 0.0047 –
Note:‘‘none’’ means the method without feature extraction, ‘‘running time’’ means the time consumed on feature selection, and the symbol ‘‘–’’ denotes no result in an entry.
Table 11
Comparison of different methods on the Lung Cancer dataset.
Feature selection method None M-SVM-RFE MSVDD-RFE
C1 – 100 0.02 C2 – – 0.09 C3 – – 0.10 C4 – – 0.33 C5 – – 0.11 Recall of ADEN (%) 100.00 ± 0.00 100.00 ± 0.00 99.52 ± 0.01 Recall of SQUA (%) 46.67 ± 0.12 46.67 ± 0.05 36.67 ± 0.12 Recall of COID (%) 73.33 ± 0.15 100.00 ± 0.00 93.33 ± 0.06 Recall of SCLC (%) 0.00 ± 0.00 22.22 ± 0.19 33.33 ± 0.33 Recall of NORMAL (%) 67.17 ± 0.07 87.50 ± 0.00 87.50 ± 0.00 Average recall (%) 59.83 ± 0.02 71.28 ± 0.05 70.07 ± 0.06 Running time (s) – 31,650 8997.2 pvalue 0.0484 0.2653 –
Note:‘‘none’’ means the method without feature extraction, ‘‘running time’’ means the time consumed on feature selection, and the symbol ‘‘–’’ denotes no result in an entry.
tissues probed by oligonucleotide arrays. Proc Natl Acad Sci 1999;96(12):6745–50.
[3]Armstrong S-A, Staunton J-E, Silverman L-B, Pieters R, Boer M-L, Minden M-D, et al. Mll translocations specify a distinct gene expression profile that distinguishes a unique leukemia. Nat Genet 2002;30(1):41–7.
[4]Singh D, Febbo P-G, Ross K, Jackson D-G, Manola J, Ladd C, et al. Gene expression correlates of clinical prostate cancer behavior. Cancer Cell 2002;1(2):203–9.
[5]Fang Z, Yang J, Li Y, Luo Q-M, Liu L. Knowledge guided analysis of microarray data. J Biomed Inform 2006;39(4):401–11.
[6]Wong HS, Wang H-Q. Constructing the gene regulation-level representation of microarray data for cancer classification. J Biomed Inform 2008;41(1):95–105. [7]Wang H-Q, Wong HS, Zhu H, Yip T-T. A neural network-based biomarker association information extraction approach for cancer classification. J Biomed Inform 2009;42(4):654–66.
[8]Kononenko I. Inductive and bayesian learning in medical diagnosis. Appl Artif Intell 1993;7(4):317–37.
[9]Wolberg W-H, Street W-N, Mangasarian O-L. Machine learning techniques to diagnose breast cancer from fine-needle aspirates. Cancer Lett 1994;77:163–71.
[10]Wolberg W-H, Street W-N, Mangasarian O-L. Image analysis and machine learning applied to breast cancer diagnosis and prognosis. Anal Quant Cytol Histol 1995;17(2):77–87.
[11]Kurgan L-A, Cios KJ, Tadeusiewicz R, Ogiela M, Goodenday L-S. Knowledge discovery approach to automated cardiac spect diagnosis. Artif Intell Med 2001;23(2):149–69.
[12]Chandra B, Gupta M, Gupta M-P. Robust approach for estimating probabilities in Naive–Bayes classifier. Berlin, Heidelberg: Springer; 2007 [chapter: Pattern Recognition and Machine Intelligence] p. 11–16.
[13]Lutz U, Lutz R-W, Lutz WK. Metabolic profiling of glucuronides in human urine by lc-ms/ms and partial least-squares discriminant analysis for classification and prediction of gender. Anal Chem 2006;78(13):4564–71.
[14]Vapnik V. Statistical learning theory. New York: Wiley; 1998.
[15]Boser B-E, Guyon I-M, Vapnik V-N. A training algorithm for optimal margin classifiers. In: Proceedings of the fifth annual workshop on computational learning theory. ACM; 1992. p. 144–52.
[16]Li L, Weinberg C-R, Darden T-A, Pedersen L-G. Gene selection for sample classification based on gene expression data: study of sensitivity to choice of parameters of the ga/knn method. Bioinformatics 2001;17(12):1131–42. [17]Mao Z-Y, Cai W-S, Shao X-G. Selecting significant genes by randomization test
for cancer classification using gene expression data. J Biomed Inform 2013;46(4):549–601.
[18]Wang L, Zhu J, Zou H. The doubly regularized support vector machine. Statistica Sinica 2006;16(2):589–615.
[19]Oh IS, Lee J-S, Moon B-R. Hybrid genetic algorithms for feature selection. Pattern Anal Machine Intell 2004;26(22):1424–37.
[20]Saeys Y, Inza I, Larrañaga P. A review of feature selection techniques in bioinformatics. Bioinformatics 2007;23(19):2507–17.
[21]Zhang L, Zhou W. Density-induced margin support vector machines. Pattern Recogn 2011;44(7):1448–60.
[22]Zhang L, Zhou W, Jiao LC. Wavelet Support Vector Machine 2001;34(1):34–9.
[23]Guyon I, Weston J, Barnhill S, Vapink V. Gene selection for cancer classification using support vector machines. Machine Learning 2002;46(1–3):389–422. [24] Weston J, Mukherjee S, Chapelle O, Pontil M, Poggio T, Vapnik V. Feature
selection for svms: proc of neural information processing systems. In: USA: Denver; 2000. p. 668–74.
[25]Duan KB, Rajapakse JC, Wang H, Azuaje F. Multiple svm-rfe for gene selection in cancer classification with expression data. IEEE Trans Nanobiosci 2005;4(3):228–34.
[26]Li JT, Jia YM, Li WL. Adaptive huberized support vector machine and its application to microarray classification. Neural Comput Appl 2011;20(1):123–32.
[27]Lee C, Leu Y. A novel hybrid feature selection method for microarray data analysis. Appl Soft Comput 2011;11(1):208–13.
[28]Jeong YS, Kong IH, Jeong MK, Kong D. A new feature selection method for one-class one-classification problems. Systems Man Cybernet Part C: Appl Rev 2012;42(6):1500–9.
[29]Tax D, Duin R. Support vector domain description. Pattern Recogn Lett 1999;20(11):1191–9.
[30] Schölkopf B, Burges C, Vapnik V. Extracting support data for a given task. In: Proceedings of first international conference on know ledge discovery and data mining; 1995. p. 262–7.
[31] Tax D, Duin R. Data domain description using support vectors. In: ESANN; 1999. p. 251–6.
[32] Cortes C, Denker J, Drucker H, Guyon I, Jackel LD, LeCun Y, et al. Comparison of classifier methods: a case study in handwritten digit recognition. In: International conference on pattern recognition; 1994. p. 77–82.
[33] U K. Advances in kernel methods ł support vector learning. Cambridge: MIT Press; 1999. p. 255–68 [chapter: Pairwise Classification and Support Vector Machines].
[34]Zhang L, Zhou W, Su TT, Jiao LC. Decision tree support vector machine. Int J Artif Intell Tools 2007;16(1):1–16.
[35]Schölkopf B, Shawe-Taylor J, Smola A, Williamson R. Estimating the support of a high-dimensional distribution. Neural Comput 2001;13(7):1443–71. [36]Armstrong S, Staunton J, Silverman L, Pieters R, den Boer M, Minden M, et al.
Mll translocations specify a distinct gene expression profile that distinguishes a unique leukemia. Nat Genet 2002;30(1):41–7.
[37]Golub TR, Slonim DK, Tamayo P, Huard C, Gaasenbeek M, Mesirov JP, et al. Molecular classification of cancer: class discovery and class prediction by gene expression. Science 1999;286(5439):531–7.
[38] Alon U, Barkai N, Notterman D, Gish K, Ybarra S, Mack D, Levine A. Broad patterns of gene expression revealed by clustering analysis of tumor and normal colon tissues probed by oligonucleotide arrays. In: Proceedings of the national academy of sciences, vol. 96; 1999. p. 6745–50.
[39]Su AI, Cooke MP, Ching KA, Hakak Y, Walker JR, Wiltshire T, et al. Large-scale analysis of the human and mouse transcriptomes. Proc Natl Acad Sci 2002;99(7):4447–65.
[40] Bhattacharjee A, Richards W, Staunton J, Li C, Monti S, Vasa P, et al. Classification of human lung carcinomas by mrna expression profiling reveals distinct adenocarcinoma subclasses. Proc Natl Acad Sci USA 2001;98(24):13790–5.