Disrupted functional connectivity affects resting state based
language lateralization
Alex Teghipco
a, Ali Hussain
b, Madalina E. Tivarus
a,b,⁎
aRochester Center for Brain Imaging, University of Rochester, USA bDepartment of Imaging Sciences, University of Rochester, USA
a b s t r a c t
a r t i c l e i n f o
Article history: Received 28 June 2016
Received in revised form 10 September 2016 Accepted 20 October 2016
Available online 24 October 2016
Pre-operative assessment of language localization and lateralization is critical to preserving brain function after lesion or epileptogenic tissue resection. Task fMRI (t-fMRI) has been extensively and reliably used to this end, but resting state fMRI (rs-fMRI) is emerging as an alternative pre-operative brain mapping method that is inde-pendent of a patient's ability to comply with a task. We sought to evaluate if language lateralization obtained from rs-fMRI can replace standard assessment using t-fMRI. In a group of 43 patients scheduled for pre-operative fMRI brain mapping and 17 healthy controls, we found that existing methods of determining rs-fMRI lateraliza-tion by considering interhemispheric and intrahemispheric funclateraliza-tional connectivity are inadequate compared to t-fMRI when applied to the language network. We determined that this was attributable to widespread but nu-anced disturbances in the functional connectivity of the language network in patients. We found changes in in-terhemispheric and intrahemispheric functional connectivity that were dependent on lesion location, and particularly impacted patients with lesions in the left temporal lobe. We then tested whether a simpler measure of functional connectivity to the language network has a better relation to t-fMRI based language lateralization. Remarkably, we found that functional connectivity between the language network and the frontal pole, and su-perior frontal gyrus, as well as the supramarginal gyrus, significantly correlated to task based language lateraliza-tion indices in both patients and healthy controls. Thesefindings are consistent with prior work with epilepsy patients, and provide a framework for evaluating language lateralization at rest.
© 2016 The Authors. Published by Elsevier Inc. This is an open access article under the CC BY-NC-ND license (http://creativecommons.org/licenses/by-nc-nd/4.0/). Keywords:
Intrinsic functional connectivity Lesions
Language lateralization Resting state
1. Introduction
1.1. Resting state fMRI for pre-surgical brain mapping
Variability in the functional anatomy of the individual makes it es-sential to map the borders of the eloquent cortex prior to resection if functional tissue is to be preserved. Invasive subdural methods remain the gold standard of functional localization (De Witte and Mariën,
2013; Duffau et al., 2005; Miller et al., 2007), however neuroimaging
presents a useful and crucially non-invasive approach that can be lever-aged prior to surgery to help plan resection, shorten the surgery, and predict its outcome (e.g.,De Witte and Mariën, 2013; Petrella et al., 2006; Rabin et al., 2004; Rutten et al., 2002a,c; Tharin and Golby, 2007). Successful use of functional magnetic resonance imaging (fMRI) for pre-surgical functional mapping is established
(Bookheimer, 2007; Bizzi et al., 2008; Lehericy et al., 2000; Schiffbauer
et al., 2002; Voyvodic et al., 2009), but contingent on patient
participation in potentially difficult tasks that they may not be able to perform, or that may distract from avoiding movement and thus com-promise the quality of the data being collected. As a result, fMRI is often used in conjunction with intraoperative mapping procedures al-though they also rely on task participation (Bizzi et al., 2008). Recent ad-vances in thefield of neuroimaging may circumvent this issue by isolating complex neural networks in the brain at rest.
With resting-state functional magnetic resonance imaging (rs-fMRI), low-frequencyfluctuations in BOLD signal across the brain can be measured (although note resting state MEG and EEG methods exist as well; e.g.,Stam et al., 2007), and used to isolate a multitude of neural networks from a single scan thereby providing surgeons with greater information at a lower resource cost (Shimony et al., 2009). Indeed, ro-bust methods such as Independent Component Analysis (ICA), seed-based, and voxel-level functional connectivity have been used to extract sensorimotor, language, auditory, and visual networks (Baldassano et al., 2012; Biswal et al., 1995; Smith et al., 2009; Tomasi and Volkow,
2012a; Yeo et al., 2011), as well as default mode, executive, salience,
and attentional networks (Fox and Raichle, 2006; Power et al., 2011;
Raichle et al., 2001; Seeley et al., 2007). Particularly, recent studies
have demonstrated the feasibility of extracting the language network from rs-fMRI in healthy controls using ICA, and have suggested that
⁎ Corresponding author at: University of Rochester Medical Center, Department of Imaging Sciences, 601 Elmwood Ave, Box 648, Rochester, NY 14642, USA.
E-mail address:[email protected](M.E. Tivarus).
http://dx.doi.org/10.1016/j.nicl.2016.10.015
2213-1582/© 2016 The Authors. Published by Elsevier Inc. This is an open access article under the CC BY-NC-ND license (http://creativecommons.org/licenses/by-nc-nd/4.0/). Contents lists available atScienceDirect
NeuroImage: Clinical
this procedure is feasible for extracting the language network in pa-tients with lesions near language centers in the brain (Tie et al., 2014). Similarly, other researchers have shown that rs-fMRI can be successfully used to pre-surgically map the motor cortex (Liu et al., 2009a). Taken together all of thesefindings have generated much interest in rs-fMRI as a preferable method of pre-operative functional mapping (Bettus et al., 2010; Lang et al., 2014; Lee et al., 2016; Shimony et al., 2009; Fox
and Greicius, 2010-review; Fox and Raichle, 2006-review;Lee et al.,
2013-review; Martino et al., 2011; Van Den Heuvel and Pol,
2010-review). However it is still rarely used in the clinic due to a lack
of standardization in imaging procedures, and analysis pipelines (Fox
and Greicius, 2010; Lee et al., 2013; Lang et al., 2014; Tie et al., 2014).
1.2. Language network lateralization
The degree of lateralization in the language network is a useful met-ric by which decisions may be made regarding the selection of patients for subdural localization procedures, especially for patients with epilep-sy, a group that presents higher instances of atypical language laterali-zation (Rasmussen and Milner, 1977). The Wada test has been largely used for this purpose, however t-fMRI has been gaining traction as an al-ternative and non-invasive method by which to determine lateraliza-tion. For example, t-fMRI can be used to predict language lateralization as determined by Wada (Adcock et al., 2003; Binder et al., 1996; Desmond et al., 1995; Lehericy et al., 2000; Rutten et al.,
2002b; Woermann et al., 2003), but critically this is contingent on the
soundness of the task design and methodology employed during the t-fMRI (e.g.,Binder et al., 1999). Rs-fMRI has also been used for localiza-tion and lateralizalocaliza-tion in patients. On the basis of funclocaliza-tional connectiv-ity to the basal ganglia, the epileptogenic zone in patients with mesial temporal lobe epilepsy (MTLE) can be lateralized (Bettus et al., 2009). Rs-fMRI has also been successfully used to lateralize and localize senso-rimotor areas pre-surgically (Kokkonen et al., 2009; Zhang et al., 2009), but remarkably little work has been done on the use of rs-fMRI for pre-surgical localization or lateralization of the language network despite the advantages of this method over t-fMRI. Recently, some research has indicated that unique functional connectivity patterns in temporal lobe epilepsy patients may be able to predict language network lateral-ization derived from task (Doucet et al., 2015). These authors found that resting functional connectivity between regions of the inferior frontal gyrus and the mesial temporal lobe correlated with the degree of task language lateralization in epilepsy patients, but not in healthy controls, for whom they found it was functional connectivity to the bilateral fron-tal cortex that correlated with task based language lateralization. This presents the exciting possibility that intrinsic functional connectivity may be used in place of t-fMRI for presurgical lateralization of the lan-guage network.
1.3. Altered functional connectivity in the language network of patients with brain disease
Brain damage has been linked to disorganized topology of a variety of networks. Patients with left and right mesial temporal lobe epilepsy have weaker functional connectivity from the temporal lobe to the me-dial frontal cortex that corresponds to memory impairment (Doucet et
al., 2013a). Patients with gliomas have also shown a default mode
net-work (DMN) deficient in hippocampal and prefrontal regions, as a func-tion of lesion grade (Laufs et al., 2007). However, few studies have addressed language network topology as a function of lesion location using rs-fMRI, although there is mounting evidence that lesions may in-duce functional reorganization at rest (Bosma et al., 2008; Carpentier et al., 2001; Diessen et al., 2013; Douw et al., 2008; Doucet et al., 2013a,b; Duffau, 2005; Duffau et al., 2005; Goldmann and Golby, 2005; Haneef et al., 2014; Maccotta et al., 2013; Negishi et al., 2011; Partovi et al., 2012; Pittau et al., 2012; Voets et al., 2012; Waites et al., 2006; Woodward et
al., 2014). Those that have addressed this reorganization using fMRI
have supported the general pattern of results reported from MEG stud-ies (Bartolomei et al., 2006a,b;Guggisberg et al., 2008). In one study
Briganti et al. (2012)showed more diffuse disruptions in functional
connectivity, and more widespread reorganization of functional con-nectivity associated with the language networks of patients with left hemisphere lesions. In another fMRI study,Pravata et al. (2011) evalu-ated functional connectivity in patients with intractable epilepsy, and found reorganization in the language network, and reduced functional connectivity in brain regions spanning the left hemisphere, regardless of epileptogenic focus side.Doucet et al. (2013a)also reported that left hemisphere damage in mesial temporal lobe epilepsy was more dis-ruptive of functional connectivity than right hemisphere damage. More recently,Doucet et al. (2015)have reported that in temporal lobe epi-lepsy, strong left hemisphere language lateralization corresponds to high functional connectivity between the left inferior frontal cortex, and left frontal lobe areas.Kinno et al. (2015)have also looked at the ef-fect of frontal gliomas on functional connectivity, primarilyfinding changes in connectivity within several syntax-related networks follow-ing the ventral and dorsal streams (see alsoKinno et al., 2014). These
findings from MEG and fMRI showing global effects on functional con-nectivity from relatively isolated damaged brain tissue are consistent with a rich literature of clinicalfindings showing transient deficits in re-gions unrelated and proximally distant from the area of damage, also known as diaschisis (Nomura et al., 2010; Von Monakow, 1969), and provide evidence that suboptimal neural network architecture affects complex brain function (Heimans and Reijneveld, 2012for review).
We set out to evaluate whether resting state language lateralization is similar to task based language lateralization, and hypothesized on the basis of previous work showing diffuse and differential disruptions in functional connectivity of patients with brain lesions, that the degree of overlap between the two may differ as a function of lesion location. Here, we build on prior work in the domain of resting state lateralization in healthy subjects (Liu et al., 2009b) and apply the same methodology to the language network in a group of patients with lesions in various parts of the brain. This lateralization measure entails comparing the functional connectivity between two brain regions to the connectivity of their homologues, as well as their interhemispheric connections. In the same vein as previous research on epilepsy patients (Doucet et al., 2015), we also tested whether functional connectivity between brain regions that involve the language network, alone, may fare better in cor-responding to task based language lateralization within our group of pa-tients and healthy controls. In testing these measures we unpack the influence of lesion location on functional connectivity by comparing healthy controls to patient groups (i.e., patients with: left hemisphere lesions, right hemisphere lesions, left temporal lobe lesions, left frontal lobe lesions), and patient groups directly against each other. These be-tween-group comparisons are pursued to give context to the within-group evaluations of LLIs, and help explain why rs-fMRI based LLIs, or a simpler measure of FC to the language network, produces a measure of language lateralization more comparable to t-fMRI based language lateralization.
2. Methods
2.1. Participants
Twenty healthy controls were recruited and gave informed consent to be scanned at the Rochester Center for Brain Imaging following the guidelines of the IRB at the University of Rochester. One participant was excluded for not being a native English speaker, one participant withdrew from the study due to anxiety, and one participant was ex-cluded for taking psychoactive drugs. All remaining 17 healthy subjects (11 female; age range 18–33, mean age 21.2 years old, SD = 3) were right handed as determined by the Edinburgh Handedness Inventory
(Oldfield, 1971). All healthy controls performed resting state and
Forty-four native English-speaking patients referred for pre-surgical mapping of language or motor function were enrolled in the study and gave written informed consent following the guidelines of the IRB at the University of Rochester. Motor mapping was not analyzed here as it does not relate to the topic of language lateralization, but was per-formed during the same session as part of these patients' clinical care. One patient was excluded due to excessive head motion, leaving 43 pa-tients (23 female; age range 18–74, mean age 51 years old, SD = 17.5) with diverse diagnoses in the group (6 mesial temporal sclerosis-MTS; 13 vascular lesions, including 11 cavernomas and 2 arteriovenous malformations; 18 gliomas including 9 low grade oligodendroglioma, oligoastrocytoma, astrocytoma, and 9 high grade oligodendroglioma, oligoastrocytoma, astrocytoma, glioblastoma multiforme; 1 meningio-ma; 1 arachnoid cyst; 1 lung cancer metastasis; 3 no apparent lesion). Thirty-six patients were right handed, 5 were left-handed and 2 were ambidextrous as determined by the Edinburgh Handedness Inventory
(Oldfield, 1971). This reflects the heterogeneity of the typical patient
population encountered in clinical practice. The patient group was scanned as part of their clinical workup, and as a result all patients par-ticipated in a resting state scan, but 31 patients underwent language mapping while the others participated in motor mapping (not analyzed here). Correspondingly, the analysis we performed to compare resting state and task language lateralization indices were done over this small-er subset of patients who have had both resting state and language mapping, while group comparisons of intrinsic functional connectivity involved the entire dataset of patients independent of task fMRI.
Previous research has suggested that lesions significantly reorganize the topology of functional connectivity within the brain, including with-in the language network (Doucet et al., 2015; Briganti et al., 2012;
Pravata et al., 2011). Thus, all group comparisons of functional
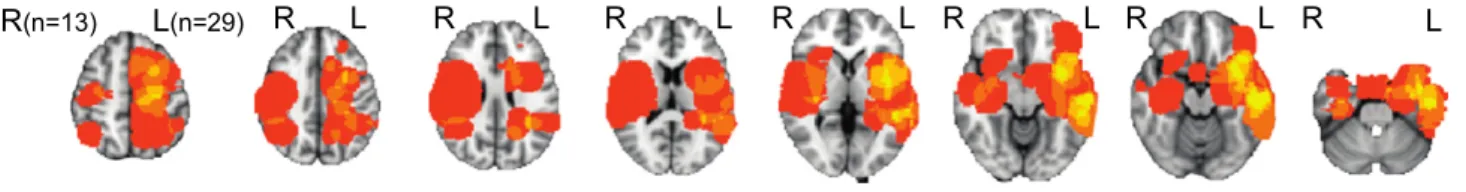
connec-tivity were done both across the entire patient group (n = 43), and also several smaller patient groups based on lesion location. Twenty-nine patients had damaged tissue in the left hemisphere, 13 patients had damaged tissue in the right hemisphere, 17 patients had damaged tis-sue in the left temporal lobe, and 9 patients had damaged tistis-sue in the left frontal lobe. Due to the low number of patients with right hemi-sphere frontal (n = 5) or temporal (n = 6) lesions, these smaller groups were not analyzed independently (seeTable 1for more details andFig. 1for visualization of lesion overlap across all 43 patients).
2.2. Language paradigms
The language tasks administered to both patients and healthy con-trols were presented visually and, included Definition Naming (DN), Word Generation in a Category (WGC), Word Generation from a Letter (WGL) and Verb Generation (VG). Healthy controls performed each of these tasks, but some patients could not complete all of the tasks. Of the patients undergoing language mapping, 29 performed WGC, 28 per-formed WGL, 31 perper-formed both VG, and DN.
For the DN task, participants viewed short descriptions of an object (e.g.,‘jewelry you wear on yourfinger’) presented for 3 s and were instructed to covertly name the object (‘ring’). Blocks of 34 s sentence
presentation were alternated with blocks of 20 s offixation cross for a total scan time of 4 min 8 s. During the VG task, participants viewed one concrete noun every 3 s and had to silently generate a semantically related verb (e.g.,‘car–drive’). Blocks of 30 s noun presentation alter-nated with control blocks (a string of the symbol‘#’, matched to the ap-proximate length of the nouns), for a total scan time of 3 min 30 s. During WGC task, participants viewed one word indicating a category and had to silently generate as many items in that category as they could in 30 s (e.g.,‘animals - dog, cat, cow, pig, lion, zebra, etc.’). Blocks of 30 s category presentation alternated with control blocks (a string of the symbol‘#’, matched to the approximate length of the words), for a total scan time of 3 min 30 s. During WGL task, participants viewed one letter and had to silently generate as many words beginning with that letter as they could in 30 s (e.g.,‘A - animal, arch, arrive, army, alphabet, etc.’). Blocks of 30 s letter presentation alternated with 30 sfixation cross blocks for a total scan time of 3 min 30 s. Finally, during the 5 min long resting state scan, the patients were asked to lie in the scanner with their eyes closed.
2.3. MRI data parameters
Patient imaging data was collected on a 3T GE Discovery MR750 MRI scanner (General Electric, Milwaukee WI, USA) equipped with an 8-channel head coil. Due to better availability, volunteer imaging data was acquired on a 3T Siemens MAGNETOM Trio MRI scanner (Siemens Healthcare, Erlangen, Germany) equipped with a 32-channel head coil. Imaging parameters were similar on both scanners. Since the two groups were evaluated separately, the use of different scanners was not considered critical. High resolution structural T1 contrast images were acquired using either MPRAGE (Siemens) or Bravo FSPGR (GE) se-quences (FOV = 256 mm, resolution 1 × 1 × 1 mm3). Functional images were acquired during each of the task paradigms described above using BOLD echo-planar imaging pulse sequence (TR = 2000/3000 ms, TE = 30 ms, resolution 4 × 4 × 4 mm3). Thefirst four imaging volumes were acquired to allow stabilization of longitudinal magnetization, and were discarded before data analysis.
2.4. fMRI analysis
Functional language and anatomical images were analyzed with FSL package (Jenkinson et al., 2012; Smith et al., 2004; Woolrich et al., 2009). Data preprocessing consisted of motion correction (Jenkinson
et al., 2002), slice-timing correction, non-brain signal removal (Smith,
2002), Gaussian spatial smoothing (FWHM 5 mm), intensity normaliza-tion, registration to the high resolution de-skulled anatomy and MNI space, and high-pass temporalfiltering. The general linear model (GLM) was used tofit beta estimates to events of interest, and each voxel's time series was prewhitened nonparametrically using FILM. Mo-tion was included as a regressor of no interest. Lesion masks were drawn manually and checked for accuracy and extent by CAQ certified neuroradiologist and co-author, AH. Edemas were excluded from the le-sion masks and either T1 or T2 images (with and without contrast) were Table 1
Patient characteristics. Group Number of
patients
Female Average age (std dev) Range of age Left hemisphere pathology Right hemisphere pathology
Number of right handed patients Lesion volume in mm (std dev) All patients 43 23 51 (17.5) 18–74 29 13 36 33,120 (37,859) Temporal lobe lesions 23 12 34 (12.1) 21–61 17 6 16 26,402 (27,004) Frontal lobe lesions 14 9 40 (15.3) 20–74 9 5 14 42,548 (49,075) Parietal lesions 5 2 39 (19.1) 18–71 3 2 2 11,140 (12,229) Other lesions 1 0 61 – – – 1 16,256 (–) MTS or epilepsy 6 2 42 (13.9) 25–63 5 1 6 –(–) Vascular lesions 6 2 30 (8.1) 21–44 4 2 3 10,453 (15,051)
used to guide the drawings on a case-by-case basis, which was deter-mined by the sequence used by clinicians in preparation for a particular surgery. The same sequence was used for outlining the borders of the le-sion. These lesion masks were registered in standard space and added for patients as pre-thresholding masks during statistical analysis. First level Z statistic images were thresholded using clusters determined by ZN2.3 and a corrected cluster significance threshold of p = 0.05.
Functional connectivity (FC) at rest was generated with the CONN toolbox (Whitfield-Gabrieli and Nieto-Castanon, 2012), relying on SPM (Penny et al., 2011) and MATLAB (MATLAB and Statistics Toolbox
Release, 2014). Preprocessing of resting state volumes included
realign-ment and normalization to MNI space. A component-based noise cor-rection method was employed for noise reduction. This allowed us to avoid global signal regression, and thereby also avoid spurious negative correlations and spurious group level region to region interactions (e.g.,
Murphy et al., 2009; Saad et al., 2012). Segmentation of T1 images was
performed to derive white matter, and cerebrospinal fluid masks. These masks were eroded to minimize partial volume effects, and regressed in the general linear model along with estimated subject movement (across 6 rotation/translation parameters and another 6 pa-rameters representing theirfirst-order temporal derivatives). After re-gression, a band-passfilter from 0.008 to 0.09 Hz was applied to the data. FC was calculated using a general linear model weighing the HRF and applying bivariate correlations to the BOLD signal at every voxel.
Whole brain FC was then computed from seed regions created by thresholding the activation maps selected from the Harvard-Oxford atlas distributed with FSL (http://www.fmrib.ox.ac.uk/fsl/), by 10%
(Fig. 2B). Regions of interest (ROIs) were selected from the language
network, and included the left inferior frontal gyrus (LIFG) and left su-perior temporal gyrus (STG). FC between ROIs and their homologues are necessary to determine resting state lateralization (Liu et al.,
2009b), so whole brain FC maps were also computed from the right
in-ferior frontal gyrus (RIFG) and right superior temporal gyrus (RSTG). All FC maps were Fisher r-to-z transformed, and masked with patient le-sions to avoid potential issues of lesion-induced changes in hemody-namic response of BOLD contrast near lesion tissue (e.g.,Giussani et
al., 2010; Wang et al., 2012).
2.5. Language laterality index analysis
Comparison of language lateralization indices using both rs-fMRI and t-fMRI was done by correlating the indices generated by each meth-od across a group of 31 patients and within smaller patient subgroups based on lesion location. From the subset of patients who underwent language mapping, 26 had left hemisphere lesions and 17 had lesions in the left temporal lobe. Because only 8 patients had lesions in the left frontal lobe, and 3 had lesions in the right hemisphere, these groups were not included in this analysis.
To calculate t-fMRI based language lateralization indices (LLI) we employed the most common threshold dependent method. A total of 6 large ROIs (Fig. 2A) were created from the probabilistic Harvard-Ox-ford structural atlas available in FSL, to account for possible atypical ac-tivation in the patient group and included areas known to be involved in language processing: all gray matter of the frontal lobe, posterior half of the inferior, middle and superior temporal lobe, and temporoparietal re-gions, angular gyrus and supramarginal gyrus (Backes et al., 2005;
Binder et al., 2008; Sabsevitz et al., 2003; Szaflarski et al., 2002). LLIs
were calculated for each participant and each task, using (L−R) / (L + R), where L and R are the number of voxels significantly activated (ZN2.3, p = 0.05) in the ROIs in each hemisphere. As in previous stud-ies, higher positive numbers correspond to left lateralized language (Binder et al., 1996;Backes et al., 2005; Szaflarski et al., 2002).
For rs-fMRI, we computed lateralization index measures as devel-oped byLiu et al. (2009b). To determine this lateralization index, intrahemispheric FC between language network ROIs and their right hemisphere homologues were used to calculate lateralization using:
LL−RL
ð Þ−ðRR−LRÞ LL
j j þj j þRL j jþjRR LRj
where LL = LIFG FC; RR = RSTG-to-RIFG FC; LR = LSTG-to-RIFG FC; and RL = LSTG-to-RIFG-to-LSTG (see Supplemental Fig. 1S, panel A). Higher positive indices indicate stronger left lateralization just as for task lateralization. One crucial difference between the methods we employed here and those ofLiu et al. (2009b)is our lack of global signal regression in the process of deriving FC. Global signal regression has been shown to affect functional connectivity patterns across the brain
(Weissenbacher et al., 2009), including lateralization of functional
con-nectivity (McAvoy et al., 2015), likely as a result of ignoring the locus of neural signal (Scholvinck et al., 2010). We then correlated resting state
L
(n=29)R
(n=13)R
L
R
L
R
L
R
L
R
L
R
L
R
L
Fig. 1.Lesion overlap in patient group. Lesion masks in MNI space corresponding to all 43 patients. Brighter red colors correspond to more lesion overlap across the patient group.
LIFG LSTG
B: ROIs used for functional connectivity
A: ROIs used for calculation of t-MRI language laterality indices
left temporoparietal left frontal left temporal
Fig. 2.Regions of interest. A: Large ROIs were created from the probabilistic Harvard-Oxford structural atlas available in FSL, to account for possible atypical activation in the patient group. B: Smaller language ROIs (left superior temporal gyrus, and left inferior frontal gyrus) were also atlas derived and used for FC calculations.
LLIs to task LLIs in our group of patients and healthy controls to evaluate if resting state LLIs can replace standard task LLIs.
2.6. Group comparisons of functional connectivity
The pairwise FCs used to calculate resting lateralization indices were compared between patients and healthy controls to determine how FC within the language network is disrupted in patients with brain damage, and to evaluate the resting language lateralization index in a more nuanced manner by decomposing it into individual FCs. In particular, we characterized patterns of interhemispheric and intrahemispheric FC within the language network and its homologues as function of lesion location using two-tailedt-tests. We compared the magnitude of difference between each patient group (i.e., patients with lesions in the left hemisphere, right hemisphere, left temporal lobe, and left frontal lobe) and healthy controls to determine whether certain lesion groups showed more impaired FC.
In a subsequent analysis, differences in brain connectivity to the lan-guage network were explored using the whole brain FC maps created using the same language network seed regions and their homologues. We compared whole brain FC maps by applying two-tailedt-tests to FC at every voxel in the brain between pairs of patient groups. To test how FC differed as a result of damage to a hemisphere, we compared FC between patients with lesions in the left and right hemispheres. To test how location within hemisphere impacted FC, we then tested pa-tients with lesions in the left temporal and frontal lobes. This resulted in whole braint-statistic maps showing significant differences in FC be-tween the language network and all other voxels of the brain. These maps were thresholded at pb0.01 (cluster threshold pb0.05). In order to address patient group differences that may attributable to le-sion volume, functional connectivity in these regions was also correlat-ed across subjects to their lesion volume as defined by the mm volume of their lesion mask, and reported in the table associated with eachfi g-ure (p-values only reported for significant relationships).
2.7. Functional connectivity as an index of language network lateralization
Finally, in light of recent research suggesting FC predicts language lateralization in epilepsy patients (Doucet et al., 2015) we also correlat-ed whole brain FC computcorrelat-ed from the language network and its homo-logues, to task based LLIs. FC from a seed to every voxel of the brain was extracted for every patient and healthy control, and correlations were performed across subjects (including separately in each patient group), between this measure and task based LLIs. The resulting whole brain correlation maps were thresholded at pb0.05 (cluster thresholded pb0.05), and again the influence of lesion volume was evaluated in the resulting effects by correlating LLIs directly to lesion volume (see Supplemental sectionLesion Volume Analysis on page 55).
Doucet et al. (2015)report different regions for patients and healthy
controls that exhibit functional connectivity that correlates with that groups' corresponding language lateralization index. In our analysis we were also interested in determining whether some regions of the brain show functional connectivity to the language network that could replace language lateralization across both healthy controls and pa-tients. As a result, we identified voxels with FC to the language network that correlated significantly to language lateralization both in patients and controls. The effect that lesions have on task activation, and there-fore t-fMRI based language lateralization, may correspond to altered functional connectivity within that region of the brain, allowing for a spatial overlap between the healthy and diseased brain that exhibits functional connectivity related to task based language lateralization. De-termining brain regions that show this relationship consistently across diverse populations would help facilitate employment of similar ap-proaches in the clinic as this would not require specialized treatment of patient groups.
3. Results
3.1. Language lateralization indices in patients and healthy controls
Consistent with previous studies, when using task fMRI we found typical left-sided dominance for language in most participants (across
all tasks:2 of 31 patients had LIb0.1). LLIs were consistent across
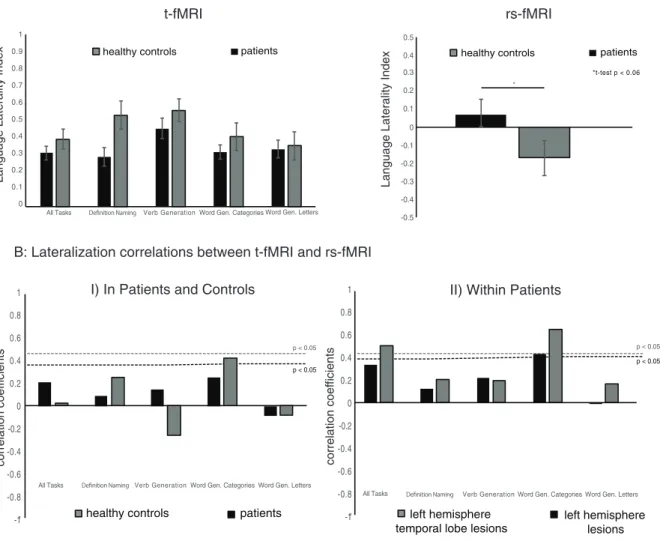
tasks but the VG task elicited the strongest left lateralization both in pa-tients and healthy controls (Fig. 3A). We also generated combined task LLIs, as prior research has suggested that language lateralization analy-sis over several tasks may produce more reliable results (Ramsey et al., 2001). Two-tailt-tests did not reveal any between-group differences in t-fMRI based LLIs. Comparison of rs-fMRI LLIs between patients (n = 31) and healthy controls (n = 17) revealed a difference trending to-wards significance (t(58) = 1.97, pb0.06). It is worth noting that in comparison to t-fMRI LLIs, the rs-fMRI LLIs were generally low, indicat-ing more bilateral language representation (Fig. 3A).
We found significant correlations between resting state and task LLIs only for WGC (Fig. 3BI), which elicited more bilateral language activity
(seeFig. 3A). Although there was no effect across the entire patient
group (Fig. 3BI), we tested correlations between t-fMRI and rs-fMRI based LLIs within our two largest patient groups: patients with lesions in the left hemisphere and patients with lesions in the left temporal lobe. This analysis yielded a significant correlation between rs-fMRI based LLIs and language lateralization during WGC in patients with le-sions in the left hemisphere (r(24) = 0.43; pb0.05), and in patients with lesions in the left temporal lobe (r(17) = 0.66; pb 0.004;
Fig. 3BII). Patients with lesions in the left temporal lobe also showed a
significant relationship between rs-fMRI LLIs and language lateraliza-tion indices generated from activalateraliza-tions across all 4 t-fMRI scans (r(17) = 0.51; pb0.04), but again this LLI was more bilateral relative to individual tasks. In healthy controls the relationship between rs-fMRI LLIs and LLIs from WGC approached significance (r(17) = 0.42; pb0.1), and the stronger correlation in patients is consistent with the
finding that patients showed a general trend for weaker left lateralized language representation during task than healthy controls (seeFig. 3A). Tasks that elicited more left lateralized language activity, such as VG, produced LLIs that correlated weakly with rs-fMRI. Thus, a clear picture emerges showing that rs-fMRI LLIs may correlate to t-fMRI LLIs for tasks that exhibit more bilateral language network activation.
3.2. Group comparisons of functional connectivity in the language network 3.2.1. Patients vs. healthy controls
Comparisons between patient groups and healthy controls were then investigated to determine whether altered interhemispheric or intrahemispheric FC in the language network (as used for the rs-fMRI LLI measure) may be affected by lesion location and thus help explain the correspondence between bilateral LLIs from t-fMRI, and LLIs from rs-fMRI for certain patient lesion groups. Intrahemispheric FC between the right homologues of the language network was lower in the patient group relative to controls (Fig. 4A; decrease of 0.12 in FC from RIFG to RSTG:t(41) = 2.9; pb0.006 and decrease of 0.1 in FC between RSTG and RIFG:t(41) = 2.7; pb0.01), but interhemispheric FC between the left language network ROIs and their right hemisphere homologues was significantly higher (Fig. 4A; increase of 0.11 in FC from RIFG to LSTG:t(41) = 3.7; pb0.0007 and increase of 0.14 in FC from LSTG to RIFG:t(41) = 3.1; pb0.004). We also found that correlations between the timecourse of a whole ROI in the language network, or its homo-logues, and voxels within that ROI itself (i.e., intraregional functional connectivity) were significantly lower in patients, describing generally depressed FC in the patient group (Fig. 4A; LIFG: decrease of 0.11 in FC
t(41) = 4; pb0.0003; LSTG decrease of 0.11:t(41) = 3.4; pb0.002; RIFG decrease of 0.14:t(41) = 3.8; pb0.0006; RSTG decrease of 0.16:
3.2.2. Patient lesion groups vs. healthy controls
Patients with lesions in the right hemisphere had more disrupted FC in the right hemisphere language network homologues than patients with left hemisphere lesions when we compared each of these groups to healthy controls (Fig. 4B;patients with lesions in the right hemisphere:
decrease of 0.15 in FC between RSTG and RIFG:t(11) = 2.7; pb0.02 and decrease of 0.14 in FC between RIFG and RSTG:t(11) = 2.8; pb0.02;
pa-tients with lesions in the left hemisphere:decrease of 0.08 in FC between
RSTG and RIFG:t(27) = 2.1; pb0.05 and decrease of 0.1 in FC between RIFG and RSTG:t(27) = 2.3; pb0.04). Patients with lesions in the left hemisphere had more disrupted interhemispheric connectivity be-tween the language network and its homologues than patients with right hemisphere lesions, when compared to healthy controls (patients
with lesions in the right hemisphere:increase of 0.11 in FC from LSTG to
RIFG:t(11) = 2.4; pb0.04;patients with lesions in the left hemisphere:
increase of 0.14 in FC between LSTG and RIFG:t(27) = 3.6; pb0.002; increase of 0.13 in FC between RIFG and LSTG:t(27) = 3.9; pb0.0006).
Intrahemispheric FC changes in patients with lesions in the left hemisphere were stronger for patients with lesions in the temporal lobe, who showed larger changes in FC when compared to controls than patients with lesions in the frontal lobe did (patients with lesions
in the left temporal lobe:decrease of 0.1 in FC between LSTG and LIFG:
t(15) = 2.4; pb0.04 and decrease of 0.1 in FC between LIFG and LSTG:t(15) = 2.3; pb0.04;patients with lesions in the left frontal lobe:
no significant intrahemispheric differences in the left hemisphere). Conversely, patients with lesions in the left frontal lobe showed more disrupted interhemispheric connectivity than patients with lesions in the left temporal lobe when compared to healthy controls (patients
with lesions in the left frontal lobe:increase of 0.07 in FC from RSTG to
LSTG:t(7) = 2.7; pb0.04; increase of 0.13 in FC between RIFG and LSTG:t(7) = 2.6; pb0.04; and an increase of 0.15 in FC between LSTG and RIFG:t(7) = 3.3; pb0.02;patients with lesions in the left
tem-poral lobe:increase of 0.12 in FC from RIFG to LSTG:t(15) = 3.3;
pb0.005; increase of 0.14 in FC between LSTG and RIFG:t(15) = 3.3; pb0.005).
3.2.3. Patients with lesions in the left versus right hemispheres
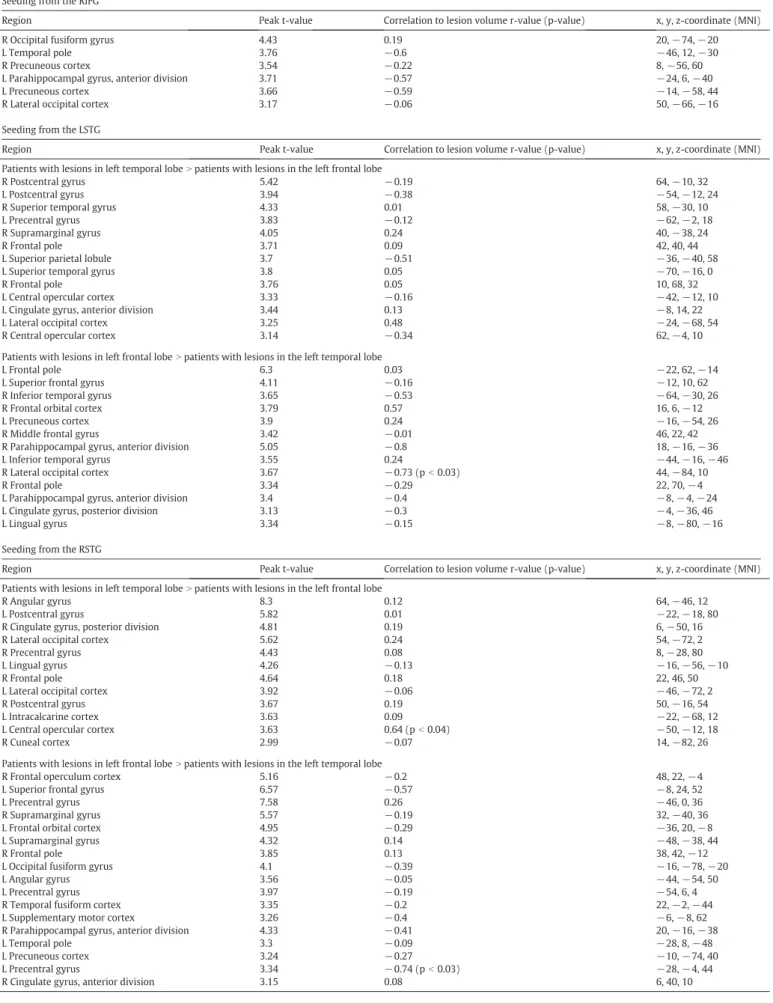
In a whole brain contrast analysis, we observed differences in FC generated from the language network and its homologues between pa-tients with lesions in the right and left hemispheres. When seeding from the LIFG, we found significantly higher connectivity primarily to bilater-al postcentrbilater-al gyri (PostCG; though the peak coordinate in the right hemisphere is in the central opercular cortex), bilateral frontal poles (FP), and bilateral occipital poles (OP) in patients with lesions in the
t-fMRI
0 0.1 0.2 0.3 0.4 0.5 0.6 0.7 0.8 0.9 1All Tasks Verb Generation Word Gen. Categories Word Gen. Letters
healthy controls patients
rs-fMRI
x ed nI yti l ar et a L e g a u g n a L x e d nI yti l ar et a L e g a u g n a Lhealthy controls patients
0 0.1 0.2 0.3 0.4 0.5 -0.1 -0.2 -0.3 -0.4 -0.5
A. Definition naming is insensitive to language lateralization in patients
B: Lateralization correlations between t-fMRI and rs-fMRI
healthy controls patients
-1" -0.8 -0.6 -0.4 -0.2 0 0.2 0.4 0.6 0.8 1
All Tasks Verb Generation Word Gen. Categories Word Gen. Letters
left hemisphere temporal lobe lesions
left hemisphere lesions -1" -0.8 -0.6 -0.4 -0.2 0 0.2 0.4 0.6 0.8 1
All Tasks Verb Generation Word Gen. Categories Word Gen. Letters
st n ei cif f e o c n oit al er r o c st n ei cif f e o c n oit al er r o c
II) Within Patients
I) In Patients and Controls
p < 0.05 p < 0.05 *t-test p < 0.06 p < 0.05 p < 0.05 *
Fig. 3.Language lateralization in patients and controls. A: The panel on the left presents task language lateralization indices for patients and controls, across each task and collapsing across all tasks. The panel on the right shows resting state language lateralization indices for patients and controls. Verb Generation is most strongly lateralized in patients and healthy controls. B: Panel I presents correlations between task based lateralization indices and resting state lateralization indices across patients and healthy controls separately. There are no significant relationships between rs-fMRI and t-fMRI based language lateralization indices in the healthy control or patient group as a whole (panel I), however word generation from categories, which elicits more bilateral language activity, produces language lateralization indices in patients with left hemisphere, and left hemisphere temporal lobe lesions, that are related to rs-fMRI based language lateralization indices, which are also bilateral (panel II). Dotted lines indicate significance for groups in both panels.
left hemisphere relative to patients with lesions in the right hemisphere
(Table 2,Fig. 5). In order to address whether any of the effects within
these regions are related to lesion volume, a correlation was performed across subjects between functional connectivity within each cluster, and lesion volume. This analysis suggests that the greater connectivity from the LIFG to the LFP for patients with lesions in the left hemisphere is related to lesion volume such that patients with smaller lesions have higher FC (r =−0.52; pb0.02). In contrast, patients with lesions in the right hemisphere showed higher connectivity from the LIFG to the right inferior temporal gyrus (RITG) (Table 2,Fig. 5). When whole brain FC
was computed seeding from the RIFG, we found higher FC to the periarcheocortex bilaterally, including subcallosal cortices (SC) and parahippocampal gyri (PHG), but also to the right posterior cingulate gyrus (RPCG) in patients with left hemisphere lesions. Greater connec-tivity from the RIFG to the right supplemental motor area (RSMA), right temporal occipital fusiform cortex (RTOF), RITG, and right precuneus (RP) was observed in patients with right hemisphere lesions (Table 2,
Fig. 5).
When seeding from the LSTG we found that the FC to the ITG bilat-erally, as well as to the right parietal lobe, including right supramarginal
A. Regions with higher FC in healthy controls compared to all patients
B. Regions with higher FC in healthy controls compared to left and right hemisphere lesion patients
p < 0.05
0 0.1 0.2
-0.1 -0.2
Change in Fisher transformed r values (functional connectivity)
-0.12 RSTG LSTG RIFG LIFG LIFG LSTG RIFG RSTG
Targets
Seeds 0.22 0.17 0.13 0.16 -0.13 0.03 0.080.16 -0.12 RSTG LSTG RIFG LIFG LIFG LSTG RIFG RSTGTargets
Seeds Seeds Seeds 0.17 0.13 0.03 0.15 -0.12 RSTG LSTG RIFG LIFG LIFG LSTG RIFG RSTGTargets
0.14 0.17 0.29 * 0.03 -0.14 0.1 0.13 -0.12 RSTG LSTG RIFG LIFG LIFG LSTG RIFG RSTGTargets
0.17 0.03 0.07 0.08 -0.14 0.1 0.1 0.14 0.09 0.14 0.11 -0.12 0.16Compared to all patients
-0.12 RSTG LSTG RIFG LIFG LIFG LSTG RIFG RSTG
Targets
Seeds 0.22 0.17 0.14 0.16 -0.09 0.03 0.16 0.1 -0.13 0.1 p < 0.05 0 0.1 0.2 -0.1 -0.2 Change in F isher transformed r values (func
tional c onnec tivit y) 0.11 0.11 -0.11 -0.14 0.12 0.17 0.17 -0.15 -0.13 -0.07 0.11 0.11 -0.11
Compared to patients with
left hemisphere lesions
Compared to patients with
right hemisphere lesions
Compared to patients with
left hemisphere temporal lesions
Compared to patients with
left hemisphere frontal lesions
C. Regions with higher FC in healthy controls compared to left hemisphere temporal and frontal lobe tumor patients
Fig. 4.Functional connectivity in the language network and its homologues. A: Pairwise FC between the language network and its right hemisphere homologues that is significantly different between patients and healthy controls. Color corresponds to difference in functional connectivity (i.e., FC for patients–FC for healthy controls). Green colors show regions with FC higher in controls than patients, and blue colors show regions with FC higher in patients than controls. Significant differences are designated by a black box around that pairwise FC, and the difference between FC shown within this box in white text. B: Pairwise FC between the group of patients with lesions in the left hemisphere vs. healthy controls (on the left), and the group of patients with lesions in the right hemisphere vs. healthy controls (on the right). C: Pairwise FC between the group of patients with lesions in the left temporal lobe vs. healthy controls (on the left), and the group of patients with lesions in the left frontal lobe vs. healthy controls (on the right).
Table 2
Peak differences in FC between patients with lesions in the left hemisphere and patients with lesions in the right hemisphere. Seeding from the LIFG
Region Peak t-value Correlation to lesion volume r-value (p-value) x, y, z-coordinate (MNI) Patients with lesions in left hemisphereNpatients with lesions in the right hemisphere
R Frontal orbital cortex 3.63 0.12 14, 20,−18
R Occipital pole 4.18 0.32 22,−96,−24
L Postcentral gyrus 4.03 −0.08 −68,−2, 18
R Frontal pole 3.27 0.1 24, 40, 0
R Intracalcarine cortex 3.77 −0.21 8,−82, 2
R Central opercular cortex 3.29 −0.06 56,−4, 6
L Lateral occipital cortex 3.75 −0.18 −50,−70,−20
L Occipital pole 3.34 0.16 −10,−98, 2
L Frontal orbital cortex 3.16 0.2 −18, 18,−16
R Paracingulate gyrus 3.01 −0.06 0, 38,−8
L Frontal medial cortex 3.2 0.32 −8, 34,−18
L Lingual gyrus 3.44 −0.14 −4,−84,−10
L Frontal pole 3.62 −0.52 (pb0.02) −18, 70, 14
L Insular cortex 3.12 0.08 −32, 12,−12
R Middle frontal gyrus 3.75 −0.32 38, 2, 68
L Intracalcarine cortex 3.08 −0.27 −10,−72, 10
L Temporal pole 2.94 −0.33 −58, 8, 0
R Frontal orbital cortex 3.41 0.03 38, 28,−8
L Frontal medial cortex 2.99 0.45 (pb0.04) −12, 42,−14 Patients with lesions in right hemisphereNpatients with lesions in the left hemisphere
R Precuneous cortex 3.32 −0.31 6,−58, 48
L Parahippocampal gyrus, anterior division 3.61 0.17 −32,−4,−26
R Postcentral gyrus 4.16 −0.28 30,−36, 46
R Cingulate gyrus, posterior 3.67 −0.92 (pb0.0005) 8,−42, 50
L Lingual gyrus 4.27 0.06 −8,−42,−10
R Precentral gyrus 4.32 0.23 22,−14, 44
R Frontal pole 3.7 −0.1 14, 60, 16
R Inferior temporal gyrus, anterior division 4.24 −0.02 56, 4,−42 R Temporal fusiform cortex 3.34 −0.26 30, 10,−46
R Precuneous cortex 3.28 −0.43 16,−60, 24
R Temporal occipital fusiform cortex 3.11 −0.07 42,−62,−10 L Occipital fusiform gyrus 3.22 −0.1 −30,−70,−8 L Temporal fusiform cortex 3.02 −0.28 −34, 8,−42 Seeding from the RIFG
Region Peak t-value Correlation to lesion volume r-value (p-value) x, y, z-coordinate (MNI) Patients with lesions in left hemisphereNpatients with lesions in the right hemisphere
R Cingulate gyrus, posterior division 4.52 0.04 0,−56, 12
R Subcallosal cortex 4.07 −0.02 0, 14, 0
L Parahippocampal gyrus, posterior division 3.83 0.26 −22,−22,−14
R Occipital pole 4.11 −0.04 12,−100,−18
L Parahippocampal gyrus, anterior division 3.67 −0.1 −18,−14,−32
R Frontal orbital cortex 4.12 0.02 36, 34,−16
L Intracalcarine cortex 3.4 −0.14 −22,−70, 10
L Lateral occipital cortex 3.23 0.05 −28,−76, 28
L Frontal pole 3.3 0.02 −16, 58, 36
L Intracalcarine cortex 3.28 −0.15 −8,−84, 4
L Lingual gyrus 3.15 0.01 −2,−70,−6
R Frontal pole 3.18 −0.08 22, 46, 4
R Parahippocampal gyrus, posterior division 3.38 −0.09 14,−34,−10
R Subcallosal cortex 3.31 −0.12 10,−84,−54
Patients with lesions in right hemisphereNpatients with lesions in the left hemisphere
R Frontal pole 4.09 −0.26 30, 42, 26
R Supplementary motor area 3.6 0.09 10,−8, 56
R Superior frontal gyrus 3.71 −0.65 6,−2, 72
L Temporal fusiform cortex 4.21 −0.25 −30, 8,−48
R Precuneous cortex 4.95 −0.26 14,−58, 46
R Parahippocampal gyrus, anterior division 3.9 0.41 38,−8,−18
L Middle temporal gyrus 3.96 −0.21 −70,−42,−4
L Frontal pole 3.3 −0.2 −26, 54, 12
R Postcentral gyrus 4.52 −0.4 8,−46, 66
R Cingulate gyrus, anterior division 3.88 −0.14 18, 30, 20 R Temporal occipital fusiform cortex 3.86 0.24 40,−48,−10 L Cingulate gyrus, anterior division 3.36 0.19 −10, 20, 24
L Inferior temporal gyrus 3.14 0.39 −48,−6,−40
R Supramarginal gyrus 3.45 −0.06 26,−32, 36
R Occipital fusiform gyrus 3.22 0.31 18,−80,−24
gyrus (RSG), as well as the right superior parietal lobe (RSPL), was higher in patients with lesions in the right hemisphere (Table 2,Fig. 5). Mainly medial regions of the surface of the brain showed higher FC in patients with lesions in the left hemisphere, including bilateral ante-rior cingulate gyrus (ACG), frontal medial cortex (FMC), and frontal
orbital cortex (OFC; but note that the peaks for these regions are in the left hemisphere). Higher FC in left hemisphere lesion patients was observed in the LPHG, and right middle temporal gyrus (RMTG) also
(Table 2,Fig. 5). Meanwhile, seeding from the RSTG generated higher
FC to precentral gyrus (PreCG), PostCG, PHG, and cingulate gyrus (CG) Seeding from the LSTG
Region Peak t-value Correlation to lesion volume r-value (p-value) x, y, z-coordinate (MNI) Patients with lesions in left hemisphereNpatients with lesions in the right hemisphere
L Cingulate gyrus, anterior division 3.95 −0.22 −14,−16, 30
L Frontal medial cortex 4.79 0.06 −2, 42,−24
L Frontal orbital cortex 4.08 0.33 −20, 18,−2
L Parahippocampal gyrus, dposterior division 5.11 0.13 −12,−24,−10
L Frontal orbital cortex 3.83 −0.02 −36, 30,−18
L Paracingulate gyrus 3.64 0.42 (pb0.05) −48,−14,−9.6
L Subcallosal cortex 3.7 0.16 −6, 20,−12
L Superior frontal gyrus 4.01 0.02 −2, 66, 28
L Frontal pole 3.7 −0.1 −32, 66,−6
L Precentral gyrus 3.18 0.21 −2,−26, 76
R Middle temporal gyrus, posterior division 3.65 −0.31 6,−18,−12 L Parahippocampal gyrus, anterior division 3.38 0.36 −44,−24,−4 R Temporal fusiform cortex 4.07 −0.11 36,−26,−40
R Frontal pole 3.28 −0.27 12,−12,−50
L Occipital pole 3.06 0.01 −10,−102,−22
L Lateral occipital cortex 3.1 −0.03 −62,−58, 18 Patients with lesions in right hemisphereNpatients with lesions in the left hemisphere
R Supramarginal gyrus 3.76 −0.05 44,−34, 28
R Temporal fusiform cortex 3.89 −0.17 24,−42,−18
R Occipital fusiform gyrus 3.61 0.4 26,−66,−24
L Superior frontal gyrus 5.04 0.23 −18,−8, 52
L Inferior temporal gyrus 3.57 −0.22 −48,−50,−20
L Precuneous cortex 3.52 −0.5 −22,−56, 22
R Precuneous cortex 3.4 −0.46 10,−46, 46
R Superior parietal lobule 3.57 0.03 48,−42, 64
R Middle frontal gyrus 3.48 0.11 38, 24, 56
L Precentral gyrus 3.53 −0.74 (pb0.03) −30,−24, 38
L Precuneous cortex 3.26 −0.23 −6,−66, 58
R Superior frontal gyrus 3.25 0.18 28, 4, 72
Seeding from the RSTG
Region Peak t-value Correlation to lesion volume r-value (p-value) x, y, z-coordinate (MNI) Patients with lesions in left hemisphereNpatients with lesions in the right hemisphere
L Precentral gyrus 4.32 0.07 −8,−18, 76
R Precentral gyrus 3.71 0.3 58,−2, 22
R Postcentral gyrus 4.26 0.22 64,−14, 44
L Planum temporale 3.47 0.06 −52,−32, 12
R Cingulate gyrus, anterior division 4.2 −0.17 0, 30, 6 R Parahippocampal gyrus, posterior division 4 −0.2 16,−26,−8
R Subcallosal cortex 3.4 0.24 14, 20,−6
L Postcentral gyrus 4.14 −0.31 −60,−16, 54
L Parahippocampal gyrus, posterior division 3.66 0.07 −18,−28,−8
R Superior temporal gyrus 3.94 0.14 42,−26,−4
L Temporal fusiform cortex 5.01 −0.38 −34,−28,−38
L Insular cortex 3.2 0.25 −32,−20, 6
L Cingulate gyrus, posterior division 4.25 −0.47 (pb0.03) −8,−24, 20
L Paracingulate gyrus 3.78 0.04 −12, 36,−10
L Parahippocampal gyrus, anterior division 3.96 0.11 −22,−16,−40
L Postcentral gyrus 2.95 0.16 −28,−30, 68
Patients with lesions in right hemisphereNpatients with lesions in the left hemisphere
L Lateral occipital cortex 3.93 −0.18 −42,−86,−18 R Inferior temporal gyrus 4.54 −0.03 48,−18,−42
R Middle frontal gyrus 3.94 −0.02 18, 4, 52
L Inferior temporal gyrus 4.34 −0.1 −58,−44,−32 R Occipital fusiform gyrus 3.76 −0.05 44,−66,−20
R Superior frontal gyrus 3.31 −0.2 20, 4, 66
R Frontal pole 3.39 0.03 42, 60, 6
R Lateral occipital cortex 3.31 0.16 44,−80,−20
L Frontal pole 3.09 0.32 −26, 58,−14
R Middle temporal gyrus, temporooccipital part 3.78 −0.18 56,−44,−8 L Occipital fusiform gyrus 3.3 0.04 −24,−66,−20
L Middle frontal gyrus 3.12 0.1 −30, 16, 40
L Supramarginal gyrus, posterior division 3.26 −0.17 −48,−44, 62
R Inferior temporal gyrus 3.01 0.07 58,−44,−18
R Lateral occipital cortex 3.45 −0.15 28,−82,−4 Table 2(continued)
bilaterally (although note that connectivity to the left cingulate gyrus was correlated with lesion volume; r =−0.47, pb0.03), as well as to other portions along RSTG in patients with lesions in the left hemi-sphere. Patients with lesions in the right hemisphere showed higher connectivity from the RSTG primarily to ITG and lateral occipital cortex (LOC) bilaterally, but also to regions in the right frontal lobe including MFG, and superior frontal gyrus (SFG) (Table 2,Fig. 5).
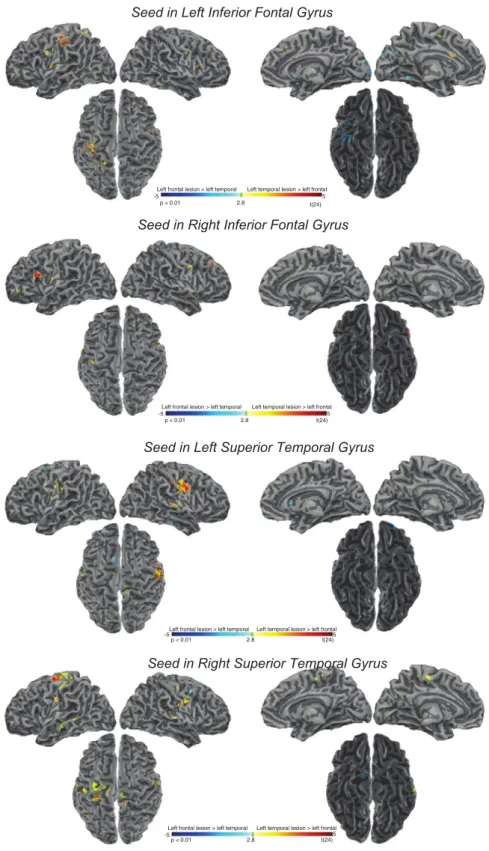
3.2.4. Patients with lesions in the left temporal versus frontal lobes
The comparison between FC in the group of patients with left frontal lobe lesions, and the group of patients with left hemisphere temporal lobe lesions is shown inTable 3,Fig. 6. Seeding from the LIFG, we found widespread patterns of higher connectivity in patients with left hemisphere temporal lobe lesions. These patients had higher connectiv-ity from the LIFG to the left and right PreCG, LPostCG, LMTG, LSTG, right frontal orbital cortex (RFOC), RMFG, LACG, left supplementary motor area (LSMA) and RIFG. In contrast, patients with lesions in the left fron-tal lobe had higher functional connectivity in the left inferior anterior temporal regions, and visual areas including LOC and ITG (Table 3,Fig. 6). Connectivity from the RIFG was higher to the LIFG, LPostCG, bilateral PreCG, RFOC, and RSFG in patients with lesions in the left temporal lobe, and higher connectivity to the right postcentral gyrus, RSPL, right supramarginal gyrus (RSG), RPHG, and ITG bilaterally in patients with lesions in the left frontal lobe. In patients with lesions in the left tempo-ral lobe FC from the LSTG was higher to bilatetempo-ral PostCG, the LPreCG, bi-lateral STG, and areas in the parietal and occipital lobes. Patients with lesions in the frontal lobe meanwhile showed higher FC from the LSTG to regions in the frontal lobe particularly frontal poles (FP), as well as ITG, bilaterally. When seeding from the RSTG we found a similar pattern of FC. Patients with lesions in the left temporal lobe showed higher FC to the right parietal lobe (right angular gyrus), right frontal lobe (RFP), oc-cipital lobe bilaterally (LOC), and PostCG bilaterally. Patients with le-sions in the left frontal lobe showed fewer areas of increased FC from the RSTG on the cortex, but included the right frontal lobe (RFP).
3.3. Functional connectivity to the language network that is related to task lateralization both in patients and healthy controls
We evaluated what brain regions show FC to the language network or its homologue that correlates to task based lateralization indices in both patients, and controls (Table 4). This analysis was performed over all tasks (i.e., LLIs generated by collapsing activation across all tasks patients performed) and VG as this particular index was most strongly left lateralized inFig. 3. Clusters of overlap were generally con-sistent across these two measures, and particularly implicated FC from the language network to parietal and frontal lobes.
Intrahemispheric FC from the language network to the frontal lobe consistently correlated with LLIs derived from the combined BOLD-con-trast of all four language tasks we employed. FC from LIFG, LSTG, RIFG and RSTG to the frontal lobe significantly correlated with language later-alization derived from all tasks (FC from LIFG to LFP in patients:r = 0.47, pb0.008and healthy controls:r = 0.68, pb0.003;FC from LSTG to LFP in
patients:r = 0.46, pb0.01and healthy controls:r = 0.52, pb0.04;FC
from RIFG to RMFG in patients:r = 0.47, pb0.008and healthy controls:
r = 0.58, pb0.02;FC from LSTG to RFP in patients:r = 0.51, pb0.004
and healthy controls:r = 0.62, pb0.008). VG based LLIs also correlated
with FC from the language network to the frontal lobe, but this effect was limited to the IFG (FC from LIFG to LFP in patients: r = 0.44,
pb0.02and healthy controls:r = 0.59, pb0.009;FC from RIFG to LSFG
in patients:r = 0.52, pb0.03and healthy controls:r = 0.55, pb0.02).
Another present effect limited to the IFG included a significant correla-tion between all-task based LLIs and interhemispheric connectivity from the IFG to the temporal lobe (FC from LIFG to RSTG in patients:
r = 0.49, pb0.006and healthy controls:r = 0.51, pb0.04;FC from
RIFG to LSTG in patients:r = 0.51, pb0.004and healthy controls:r =
0.58, pb0.02). Otherwise FC from the language network to regions of
the temporal lobe tended not to correlate with LLIs, however interest-ingly we didfind that intra-regional FC in the LSTG (i.e. between the timecourse of the entire LSTG ROI, and individual voxels of the LSTG ROI) correlated significantly with LLIs derived from VG (FC from LSTG
to LSTG in patients:r = 0.63, pb0.0002and healthy controls:r = 0.49,
pb0.05). VG based LLIs also correlated with FC between LSTG and the RITG (FC from LSTG to RITG in patients:r = 0.37, pb0.05and healthy
con-trols:r = 0.75, pb0.0006).
Connectivity between the language network's right hemisphere ho-mologues and the left parietal lobe, specifically LSG, also significantly correlated to VG based LLIs (FC from RIFG to LSG in patients: r = 0.39,
pb0.03and healthy controls:r = 0.68, pb0.02); (FC from RSTG to LSG
in patients:r = 0.44, pb0.02and healthy controls:r = 0.53, pb0.03).
FC to the parietal lobe also correlated to LLIs derived from all tasks pa-tients and healthy controls performed, but the relationship was only present when seeding from the LSTG, and implicated the parietal lobe bilaterally (FC from LSTG to LSG in patients:r = 0.42, pb0.02and healthy
controls:r = 0.62, pb0.008;FC from LSTG to RSG in patients:r = 0.44,
pb0.02and healthy controls:r = 0.6, pb0.01). In the occipital cortex,
the LOC was identified to show FC to the language network that corre-lated with LLIs derived from all the language tasks we employed. FC from the LIFG to bilateral LOC correlated with LLIs across all tasks (FC
from LIFG to LLOC in patients:r = 0.42, pb0.02and healthy controls:
r = 0.49, pb0.05;FC from LIFG to RLOC in patients:r = 0.48, pb0.007
and healthy controls:r = 0.49, pb0.05), as well as FC from the LSTG to
the RLOC (FC from LSTG to RLOC in patients:r = 0.43, pb0.02and healthy
controls:r = 0.59, pb0.02).
4. Discussion
In this study we evaluated whether rs-fMRI can be used to generate language lateralization indices that are comparable to the current stan-dard of t-fMRI. Resting state is an attractive alternative to t-fMRI for nu-merous reasons such as shorter scan times that reduce participant movement, and the ability to administer the task to patients that may otherwise perform poorly on task fMRI due to inability to comply with complex task demands. Here we found that a previously proposed method of determining lateralization (Liu et al., 2009b) produces indi-ces suggesting bilateral language network, and as such is inadequate for determining the degree of lateralization in this network. While we did observe some relationship between this resting state language later-alization index and task based language laterlater-alization indices in patients with left hemisphere lesions, this was only the case for tasks that elicited bilateral language activation in the scanner, and thus would be inappropriate for clinical consideration. In contrast, we found no corre-spondence between this resting state language lateralization method and task based language lateralization in healthy controls. We traced this effect to the underlying FC of the language network, where we found that relative to healthy controls, patients had increased inter-hemispheric connectivity to the LSTG, and decreased intrainter-hemispheric connectivity. However, FC between regions in the language network may still be used in place of t-fMRI. In line with previous research on ep-ilepsy, we evaluated FC to the language network that correlated with t-fMRI language lateralization indices,finding that intrahemispheric con-nectivity involving the frontal cortex, and interhemispheric connectivi-ty involving the left parietal cortex produces potential candidates for language lateralization measures across patients with lesions, and healthy controls.
4.1. Increased functional connectivity to the left superior temporal gyrus in lesion patients
One surprisingly consistent pattern we found was increased inter-hemispheric connectivity between the LSTG and the RIFG across patient lesion groups, which suggests that this may be a general compensatory mechanism induced by lesion pathology within the language network.
Intrahemispheric hyperconnectivity has been found ipsilateral to epi-leptogenic sites in temporal lobe epilepsy (Maccotta et al., 2013), and between subregions of the hippocampus in patients with left medial temporal lobe epilepsy (Bettus et al., 2009). It has also been previously found in childhood survivors of brain lesions, but only in frontal
functional networks using ICA (Chen et al., 2016), and in the motor cor-tex of juvenile myoclonic epilepsy patients (Vollmar et al., 2011). Pat-terns of hyperconnectivity have also been observed in psychiatric illness, for example patients with schizophrenia show hyperconnectivity in the default mode network correlated to subpar
Seed in Left Inferior Fontal Gyrus
Seed in Right Inferior Fontal Gyrus
2.715 -5
p < 0.01
Left hemisphere tumors > Right Right hemisphere tumors > Left
2.71
5 -5
p < 0.01
Left hemisphere tumors > Right Right hemisphere tumors > Left
Seed in Left Superior Temporal Gyrus
2.71
5 -5
p < 0.01
Left hemisphere tumors > Right Right hemisphere tumors > Left
Seed in Right Superior Temporal Gyrus
2.71
5 -5
p < 0.01
Left hemisphere tumors > Right Right hemisphere tumors > Left
t(41) t(41) t(41) t(41)
Fig. 5.Brain regions with higher FC in patients with lesions in the left hemisphere than patients with right hemisphere lesions. A two-sample, two-tailedt-test was performed across subjects on every voxel of the brain, between FC from a seed region in the language network to that voxel (and its homologues) in patients with lesions in the left hemisphere, and patients with lesions in the right hemisphere. Blue colors correspond to regions where FC in patients with lesions in the right hemisphere was significantly greater than FC in patients with lesions in the left hemisphere. Red colors show the reverse, where FC is significantly higher in patients with lesions in the left hemisphere. This analysis is performed across FC maps seeding from all regions of the language network and their right hemisphere homologues.
Table 3
Peak differences in FC between patients with lesions in the left temporal lobe and patients with lesions in the left frontal lobe. Seeding from the LIFG
Region Peak t-value Correlation to lesion volume r-value (p-value) x, y, z-coordinate (MNI) Patients with lesions in left temporal lobeNpatients with lesions in the left frontal lobe
L Postcentral gyrus 5.17 −0.09 −38,−34, 58
L Superior temporal gyrus 5.18 −0.02 −70,−18, 2
R Inferior frontal gyrus, pars opercularis 5.07 0.05 34, 24, 16
R Frontal orbital cortex 4.05 0.2 42, 28,−10
R Precentral gyrus 4.03 0.29 50, 6, 32
L Precentral gyrus 3.9 0.42 −48, 0, 30
L Cingulate gyrus, anterior division 3.75 0.26 −4, 14, 26
L Temporal pole 4.28 −0.46 −60, 10,−6
L Frontal pole 3.3 −0.14 −48, 54, 0
R Postcentral gyrus 3.57 0.31 46,−16, 46
L Supplementary motor area 3.76 0.35 −6,−6, 50
L Inferior frontal gyrus, pars triangularis 3.88 −0.25 −38, 24, 12 R Paracingulate gyrus 3.56 −0.7 (pb0.02) 6, 30, 36 R Insular cortex 4.43 0.76 (pb0.007) 42,−2,−2 R Temporal occipital fusiform cortex 4.08 0.11 22,−32,−26
R Frontal pole 3.45 −0.32 42, 54, 0
L Middle frontal gyrus 3.61 −0.13 −34, 28, 28
R Frontal pole 3.13 −0.17 24, 40, 24
R Supramarginal gyrus 3.5 0.12 46,−38, 40
R Superior frontal gyrus 3.54 0.56 36,−30, 32
R Middle frontal gyrus 3.48 −0.21 18, 16, 52
R Frontal pole 3.08 −0.14 16
Patients with lesions in left frontal lobeNpatients with lesions in the left temporal lobe
R Inferior temporal gyrus 4.52 0.03 42,−12,−40
R Occipital pole 4.13 −0.37 12,−96, 8
L Lingual gyrus 4.21 −0.71 (pb0.04) −6,−80,−8 L Temporal occipital fusiform cortex 4.22 0.1 −26,−52,−12
R Precuneous cortex 4.67 −0.44 30,−50, 10
R Temporal pole 3.58 0.22 46, 10,−42
L Temporal pole 3.76 0.01 −34, 20,−42
L Cingulate gyrus, posterior division 4.09 0.46 −16,−46, 8 R Lateral occipital cortex, inferior division 5.04 −0.28 30,−72, 6
R Middle frontal gyrus 3.65 −0.25 30, 0, 68
L Middle temporal gyrus, posterior division 4.48 −0.22 −62,−6,−36
R Cuneal cortex 3.42 −0.29 0,−78, 30
R Middle frontal gyrus 3.65 −0.25 30, 0, 68
L Middle temporal gyrus, posterior division 4.48 −0.22 −62,−6,−36
R Cuneal cortex 3.42 −0.29 0,−78, 30
L Frontal pole 3.3 0.16 −30, 48, 38
L Superior frontal gyrus 3.2 0.48 −10, 30, 62
R Temporal occipital fusiform cortex 3.47 −0.05 40,−48,−2
R Lingual gyrus 3.59 −0.22 32,−38,−4
L Occipital fusiform gyrus 3.28 −0.46 −20,−72,−6
R Occipital fusiform gyrus 3.18 0.2 32,−64,−14
L Lateral occipital cortex, superior division 3.15 0.01 −54,−68, 40
L Precuneous cortex 3.23 0.03 −16,−50, 22
Seeding from the RIFG
Region Peak t-value Correlation to lesion volume r-value (p-value) x, y, z-coordinate (MNI) Patients with lesions in left temporal lobeNpatients with lesions in the left frontal lobe
R Inferior frontal gyrus, pars triangularis 5.09 −0.35 30, 34, 12
L Precentral gyrus 5.78 −0.01 −64, 12, 20
R Precentral gyrus 4.4 0.38 46,−2, 34
R Superior frontal gyrus 4.06 −0.18 20, 38, 42
L Frontal pole 3.92 0.27 −50, 46,−8
L Precentral gyrus 4.12 −0.18 −34,−14, 74
L Postcentral gyrus 3.59 −0.27 −46,−22, 54
R Angular gyrus 3.79 −0.71 (pb0.02) 66,−54, 36
L Planum polare 3.46 −0.12 46, 2,−6
R Inferior frontal gyrus, pars triangularis 3.6 −0.73 (b0.02) 50, 28, 10
L Precentral gyrus 3.23 0.01 −44,−8, 34
R Frontal orbital cortex 3.36 0.35 40, 32,−2
L Inferior frontal gyrus, pars opercularis 3.52 0.26 52, 18, 10
L Postcentral gyrus 3.03 −0.48 −40,−34, 62
Patients with lesions in left frontal lobeNpatients with lesions in the left temporal lobe
R Inferior temporal gyrus 3.56 0.41 46,−18,−36
R Superior parietal lobule 3.56 0.21 28,−38, 44
L Temporal pole 3.91 −0.37 −38, 4,−42
R Supramarginal gyrus 4.06 0.38 64,−22, 24
L Lingual gyrus 4.08 0.26 −4,−80,−10
Table 3(continued) Seeding from the RIFG
Region Peak t-value Correlation to lesion volume r-value (p-value) x, y, z-coordinate (MNI)
R Occipital fusiform gyrus 4.43 0.19 20,−74,−20
L Temporal pole 3.76 −0.6 −46, 12,−30
R Precuneous cortex 3.54 −0.22 8,−56, 60
L Parahippocampal gyrus, anterior division 3.71 −0.57 −24, 6,−40
L Precuneous cortex 3.66 −0.59 −14,−58, 44
R Lateral occipital cortex 3.17 −0.06 50,−66,−16 Seeding from the LSTG
Region Peak t-value Correlation to lesion volume r-value (p-value) x, y, z-coordinate (MNI) Patients with lesions in left temporal lobeNpatients with lesions in the left frontal lobe
R Postcentral gyrus 5.42 −0.19 64,−10, 32
L Postcentral gyrus 3.94 −0.38 −54,−12, 24
R Superior temporal gyrus 4.33 0.01 58,−30, 10
L Precentral gyrus 3.83 −0.12 −62,−2, 18
R Supramarginal gyrus 4.05 0.24 40,−38, 24
R Frontal pole 3.71 0.09 42, 40, 44
L Superior parietal lobule 3.7 −0.51 −36,−40, 58
L Superior temporal gyrus 3.8 0.05 −70,−16, 0
R Frontal pole 3.76 0.05 10, 68, 32
L Central opercular cortex 3.33 −0.16 −42,−12, 10 L Cingulate gyrus, anterior division 3.44 0.13 −8, 14, 22
L Lateral occipital cortex 3.25 0.48 −24,−68, 54
R Central opercular cortex 3.14 −0.34 62,−4, 10
Patients with lesions in left frontal lobeNpatients with lesions in the left temporal lobe
L Frontal pole 6.3 0.03 −22, 62,−14
L Superior frontal gyrus 4.11 −0.16 −12, 10, 62
R Inferior temporal gyrus 3.65 −0.53 −64,−30, 26
R Frontal orbital cortex 3.79 0.57 16, 6,−12
L Precuneous cortex 3.9 0.24 −16,−54, 26
R Middle frontal gyrus 3.42 −0.01 46, 22, 42
R Parahippocampal gyrus, anterior division 5.05 −0.8 18,−16,−36 L Inferior temporal gyrus 3.55 0.24 −44,−16,−46 R Lateral occipital cortex 3.67 −0.73 (pb0.03) 44,−84, 10
R Frontal pole 3.34 −0.29 22, 70,−4
L Parahippocampal gyrus, anterior division 3.4 −0.4 −8,−4,−24 L Cingulate gyrus, posterior division 3.13 −0.3 −4,−36, 46
L Lingual gyrus 3.34 −0.15 −8,−80,−16
Seeding from the RSTG
Region Peak t-value Correlation to lesion volume r-value (p-value) x, y, z-coordinate (MNI) Patients with lesions in left temporal lobeNpatients with lesions in the left frontal lobe
R Angular gyrus 8.3 0.12 64,−46, 12
L Postcentral gyrus 5.82 0.01 −22,−18, 80
R Cingulate gyrus, posterior division 4.81 0.19 6,−50, 16
R Lateral occipital cortex 5.62 0.24 54,−72, 2
R Precentral gyrus 4.43 0.08 8,−28, 80
L Lingual gyrus 4.26 −0.13 −16,−56,−10
R Frontal pole 4.64 0.18 22, 46, 50
L Lateral occipital cortex 3.92 −0.06 −46,−72, 2
R Postcentral gyrus 3.67 0.19 50,−16, 54
L Intracalcarine cortex 3.63 0.09 −22,−68, 12
L Central opercular cortex 3.63 0.64 (pb0.04) −50,−12, 18
R Cuneal cortex 2.99 −0.07 14,−82, 26
Patients with lesions in left frontal lobeNpatients with lesions in the left temporal lobe
R Frontal operculum cortex 5.16 −0.2 48, 22,−4
L Superior frontal gyrus 6.57 −0.57 −8, 24, 52
L Precentral gyrus 7.58 0.26 −46, 0, 36
R Supramarginal gyrus 5.57 −0.19 32,−40, 36
L Frontal orbital cortex 4.95 −0.29 −36, 20,−8
L Supramarginal gyrus 4.32 0.14 −48,−38, 44
R Frontal pole 3.85 0.13 38, 42,−12
L Occipital fusiform gyrus 4.1 −0.39 −16,−78,−20
L Angular gyrus 3.56 −0.05 −44,−54, 50
L Precentral gyrus 3.97 −0.19 −54, 6, 4
R Temporal fusiform cortex 3.35 −0.2 22,−2,−44
L Supplementary motor cortex 3.26 −0.4 −6,−8, 62 R Parahippocampal gyrus, anterior division 4.33 −0.41 20,−16,−38
L Temporal pole 3.3 −0.09 −28, 8,−48
L Precuneous cortex 3.24 −0.27 −10,−74, 40
L Precentral gyrus 3.34 −0.74 (pb0.03) −28,−4, 44 R Cingulate gyrus, anterior division 3.15 0.08 6, 40, 10
working memory performance (Whitfield-Gabrieli et al., 2009). Pa-tients with mild TBI also show hyperconnectivity in fronto-parietal task-related networks (Mayer et al., 2011). To the extent of our knowl-edge this is thefirst study showing hyperconnectivity in the lan-guage network of lesion patients. The pattern of interhemispheric connectivity we observed suggests that right hemisphere brain
regions may be coming online to support left hemisphere language function lost due to pathology. This is supported by thefinding that generally, lesioned patients showed decreased intrahemispheric FC, thus interhemispheric hyperconnectivity may reflect an internal compensatory mechanism to this decreased connectivity in the lan-guage network.
Seed in Left Inferior Fontal Gyrus
Seed in Right Inferior Fontal Gyrus
2.85 -5
p < 0.01
Left temporal lesion > left frontal Left frontal lesion > left temporal
2.8
5 -5
p < 0.01
Left temporal lesion > left frontal Left frontal lesion > left temporal
Seed in Left Superior Temporal Gyrus
2.8 5
-5 p < 0.01
Left temporal lesion > left frontal Left frontal lesion > left temporal
Seed in Right Superior Temporal Gyrus
2.8 -5
p < 0.01
Left temporal lesion > left frontal Left frontal lesion > left temporal
5 t(24)
t(24)
t(24)
t(24)
Fig. 6.Brain regions with higher FC in patients with left hemisphere lesions in the temporal lobes than frontal lobes. A two-sample, two-tailedt-test was performed across subjects on every voxel of the brain, between FC from a seed region in the language network to that voxel (and its homologues) in patients with lesions in the left temporal lobe, and patients with lesions in the left frontal lobe. Blue colors correspond to regions where FC in patients with lesions in the left frontal lobe was significantly greater than FC in patients with lesions in the left temporal lobe. Red colors show the reverse, where FC is significantly higher in patients with lesions in the left temporal lobe. This analysis is performed across FC maps seeding from all regions of the language network and their right hemisphere homologues.
However, it should be noted that these patterns of interhemispheric and intrahemispheric connectivity in our patient group were contingent on lesion location. For example, lesions in the right hemisphere elicited a weaker interhemispheric effect within the language network, and lesions in the left hemisphere frontal lobe showed most widespread changes in interhemispheric language network connectivity. That right hemisphere lesion patients showed this compensatory hyperconnectivity at rest may be explained by the fact that their lesions still induced decreased left hemispheric FC in the language network. This phenomenon is consistent with the general model of connectional diaschisis (seeCarrera and Tononi, 2014for review), with lesions show-ing distal effects on functional connectivity that may be independent of task activation in the same regions (e.g.,Campo et al., 2012). Interhemi-spheric hyperconnectivity and decreased left hemisphere connectivity in the language network may be related, and occurred even in patients with lesions in the right hemisphere. Thesefindings parallel recent re-search showing increased FC in multiple sclerosis correlates with im-pairment (Hawellek et a