Knowledge discovery and sequence-based prediction of pandemic
influenza using an integrated classification and association rule mining
(CBA) algorithm
Fatemeh Kargarfard
a, Ashkan Sami
a,⇑, Esmaeil Ebrahimie
b,c,d,⇑ aDepartment of Computer Science and IT, School of Electrical Engineering and Computer Science, Shiraz University, Shiraz, Iran b
School of Information Technology and Mathematical Sciences, Division of Information Technology, Engineering and the Environment, University of South Australia, Adelaide, Australia
cInstitute of Biotechnology, Shiraz University, Shiraz, Iran
dDepartment of Genetics and Evolution, School of Biological Sciences, The University of Adelaide, Adelaide, Australia
a r t i c l e
i n f o
Article history:
Received 3 October 2014 Revised 9 July 2015 Accepted 27 July 2015 Available online 30 July 2015
Keywords:
Association rule mining CBA algorithm
Pandemic influenza prediction
a b s t r a c t
Pandemic influenza is a major concern worldwide. Availability of advanced technologies and the nucleo-tide sequences of a large number of pandemic and non-pandemic influenza viruses in 2009 provide a great opportunity to investigate the underlying rules of pandemic induction through data mining tools. Here, for the first time, an integrated classification and association rule mining algorithm (CBA) was used to discover the rules underpinning alteration of non-pandemic sequences to pandemic ones. We hypoth-esized that the extracted rules can lead to the development of an efficient expert system for prediction of influenza pandemics. To this end, we used a large dataset containing 5373 HA (hemagglutinin) segments of the 2009 H1N1 pandemic and non-pandemic influenza sequences. The analysis was carried out for both nucleotide and protein sequences. We found a number of new rules which potentially present the undiscovered antigenic sites at influenza structure. At the nucleotide level, alteration of thymine (T) at position 260 was the key discriminating feature in distinguishing non-pandemic from pandemic sequences. At the protein level, rules including I233K, M334L were the differentiating features. CBA effi-ciently classifies pandemic and non-pandemic sequences with high accuracy at both the nucleotide and protein level. Finding hotspots in influenza sequences is a significant finding as they represent the regions with low antibody reactivity. We argue that the virus breaks host immunity response by mutation at these spots. Based on the discovered rules, we developed the software, ‘‘Prediction of Pandemic Influenza’’ for discrimination of pandemic from non-pandemic sequences. This study opens a new vista in discovery of association rules between mutation points during evolution of pandemic influenza.
Ó2015 Elsevier Inc. All rights reserved.
1. Introduction
Influenza virus has three types designated A, B, and C. Influenza A is the most virulent human pathogen among these types, causing major outbreaks and pandemics [1,2]. Pandemic influenza has caused high morbidity and mortality during recent history[2]. A
pandemic occurs when the human population has low immunity against newly emerged influenza sequences[3,4]. In the 20th cen-tury, pandemic influenza resulted in significant mortality and social disruption through Spanish Flu in 1918, Asian Flu in 1957 and Hong Kong Flu in 1968. The recent 2009 pandemic influenza was caused by new H1N1 influenza sequences which resulted in significant fear and many deaths worldwide[3,5].
Different positions (spots) on influenza proteins have different impacts on antibody reactivity[6]. Even minor changes (1–2 amino acids) in the hemagglutinin surface protein of H1N1 influenza have the potential to dramatically alter antigenic properties[6]. This can lead to a significant reduction in the effectiveness of vaccines and the ability of sera (host response) to recognize the virus [7]. Identification of the regions/positions (hot spots) with significant impact on host immunity response is a major task with a critical
http://dx.doi.org/10.1016/j.jbi.2015.07.018
1532-0464/Ó2015 Elsevier Inc. All rights reserved.
⇑ Corresponding authors at: Department of Computer Science and IT, School of Electrical Engineering and Computer Science, Shiraz University, Shiraz, Iran. Tel.: +98 9173142062; fax: +98 71 36274605 (A. Sami). School of Information Technol-ogy and Mathematical Sciences, Division of Information TechnolTechnol-ogy, Engineering and the Environment, University of South Australia, Adelaide, Australia. Tel.: +61 883132252; fax: +61 8 8313 2252 (E. Ebrahimie).
E-mail addresses:[email protected](A. Sami),[email protected]
(E. Ebrahimie).
Contents lists available atScienceDirect
Journal of Biomedical Informatics
role in implementation of antiviral strategies, prioritization of vac-cination, and planning of health infrastructure.
To find the key pandemic (low immunological) governing spots, most studies have concentrated on visual alignment of small sub-sets (less than 50) of sequences and/or immunological tests (such as ELISA or western blot) to monitor decreased antigen–antibody reactivity after spot alteration [7]. Modified qRT-PCR technique has also been used to identify the occurrence of point mutations in the genome of the 2009 H1N1 pandemic influenza [8]. Examination of the 3D-structure of the hemagglutinin segment of pandemic H1N1 virus revealed structural changes in 2009 pan-demic influenza[9]. It has been reported that changes at amino acid positions 222 and 225 of hemagglutinin contributed to the emergence of the 2009 influenza pandemic[3,9–13]. These muta-tions influenced receptor binding, pathogenesis and transmissibil-ity. These known modulating spots are of major importance for virologists because of their key roles in antibody reactivity. However, there is a clear need to develop approaches for the dis-covery of a comprehensive set of hotspots for better understanding of pandemic induction. Large-scale analysis of pandemic and non-pandemic sequences can result in the discovery of key pan-demic/low immunity-governing spots and, more importantly, has the potential to uncover apposite associations between spots.
Statistical and data mining analysis are routinely used for better understanding of the nature of various phenomena and enhancing the efficiency of prediction [14]. Supervised learning algorithms have been used in prediction of influenza host rang and subtypes [15–18]. As example, 2154 H1, H2, H3, N1and N2sequences were used to construct a J48 decision tree[16]. They identified 78 infor-mative positions for HA subtype detection and 63 for NA subtype detection[16]. In another analysis, protein sequences of all 8 seg-ments of swine and human hosts of 2009 pandemic influenza viruses were used to construct SVM model for prediction of viral host[17]. Association rules have been also employed to discrimi-nate the viral host (human, avian, or swine)[18].
A considerable number of deposited sequences from the 2009 pandemic provided the opportunity of large scale data mining and labeling of sequences in distinct pandemic and non-pandemic classes. One of the main aims of this study was to search for combinatorial (interactive) hotspots in H1N1 2009 pan-demic influenza.
In this study, we compared the 2009 pandemic sequences against all previous H1N1 epidemic sequences (from 1900). Our objective was to uncover how the co-occurrence (interaction) of altering spots may lead to pandemic influenza. We developed a classifier utilizing both classification rule mining and association rule mining to predict the pandemic phenotype based on either its amino acid or nucleotide sequences. An integrated classification and association rule mining algorithm (CBA) was applied to uncover the underlying rules and identify pandemic sequences. To this end, big datasets, including 5373 sequences from the 2009 H1N1 (HA segment) pandemic and non-pandemic influenza nucleotide and protein sequences, were collected and analyzed. We discovered some new rules (identifying mutational hotspots) which potentially reveal undiscovered antigenic sites. Based on these rules, we developed a software, ‘‘Prediction of Pandemic Influenza’’ for distinguishing between pandemic and non-pandemic sequences. This study resulted in an increased knowledge for selection of the key spots and their co-occurrence patterns (based on association rules) in pandemic sequences.
The rest of this paper is organized as follows. In Section2, the generation of the dataset is illustrated and a brief review of CBA algorithm is given to explain the concepts. In Section3, the results of classification and the developed software are explained. Discussion is provided in Section4 and conclusion is presented in Section5.
2. Material and methods
To develop a robust predictor, the following steps need to be undertaken: (1) generating a valid dataset to train and test the pre-dictor; (2) representing the samples with an effective formulation to accurately reflect their intrinsic correlation with the target; (3) developing a powerful algorithm to conduct the prediction; (4) establishing a user-friendly software or web-server for application of the predictor.
Supplementary Fig. 1illustrates an overview of the implemen-tation process in developing the ‘‘influenza prediction software’’ based on the discovered key spots.
2.1. Data collection
A dataset of the HA (encoded in the 4th segment of the influ-enza viral genome) was generated including 5373 H1N1 sequences. In this dataset, 3621 of sequences were pandemic and 1752 were non-pandemic. The dataset included both nucleotide and protein sequences. Only complete sequences were used in this study. The average length of sequences before alignment was 565 for proteins and 1698 for nucleotides. These sequences were divided into two parts: pandemic and non-pandemic. Pandemic sequences were related to the 2009 flu pandemic. The data were downloaded from the Influenza Research Database (IRD) which is a resource for the influenza virus research community to facilitate understanding of the influenza virus and how it interacts with the host organism [19]. In order to select the 2009 pandemic sequences, the parameter ‘‘Type’’, ‘‘Host’’, ‘‘Protein’’, ‘‘Subtype’’, ‘‘Complete Segments Only’’, and ‘‘Include only pH1N1 proteins’’ were set to ‘‘A’’, ‘‘Human’’, ‘‘HA’’, ‘‘H1N1’’, ‘‘Yes’’, and ‘‘Yes’’ respec-tively. Similarly, to download the non-pandemic sequences, the parameter ‘‘Exclude all pH1N1 proteins’’ was set to ‘‘Yes’’ and the other parameters were the same as for the pandemic sequences. These parameter settings were similar for both protein and nucleo-tide sequences.
In fact, all Available 2009 pandemic sequences as well as non-pandemic sequences were used. After the 2009 pandemic, the number of pandemic sequences that have been added to the Influenza Research Database (IRD), NCBI or similar databases was far greater than non-pandemic sequences. We used all of the avail-able sequences (which not participant in rule extraction phase-training phase-) regardless class ratio as test data.
It should be noted that sequences of the previous pandemics such as H2N2-1957, or H3N2-1968 are not available in large scale as the sequencing technologies were not developed sufficiently those days. Very few sequences related to these (previous) pan-demics are reported (only 100 sequences are available for the human H2N2 subtype across the world from 1900 to the present day). Therefore, it is not possible to classify sequences into pan-demic and non-panpan-demic for rule extraction in supervised data mining and large-scale analysis. Consequently, 2009 is the only pandemic which provided the essential large scale labeled sequences.
2.2. Pre-processing on dataset 2.2.1. Multiple sequence alignment
As a pre-processing step, multiple alignments of sequences are essential in this study. The MUSCLE algorithm commonly applies for multiple sequences and is one of the most popular multiple alignment packages for protein and nucleotide sequences[20]. By choosing maximum number of iterations and diagonal optimiza-tion, MUSCLE has a better average accuracy and higher speed in comparison to other multiple alignment tools such as CLUSTALW
[21]or T-Coffee[22]. MUSCLE has three phases[23,24]. At the end of each phase the multiple alignment can be obtained and the algo-rithm can be terminated. Phase 1 is draft progressive during which a progressive alignment is built. This phase includes the following steps:
Similarity measure: The similarity of each pair of sequences is calculated by using k-mer counting.
Distance estimate: A triangular distance matrix is built by using pair-wise similarities.
Tree construction: A tree is created based on the distance matrix.
Progressive alignment: A progressive alignment is constructed by the branching order of the tree.
Phase 2 is improved progressive. This stage tries to improve the tree and constructs a new progressive alignment based on this tree. Phase 2 includes: similarity measure, tree construction, tree com-parison, and progressive alignment. This phase may be iterated [20]. The final phase (phase 3) executes iterative improvement based on tree-dependent restricted partitioning[25].
In this study, the parameters of ‘maximum iteration’ and ‘max-imum memory’ in MUSCLE software were set to 2 and 3000 MB, respectively. The alignment parameters were: ‘‘gap open cost’’ of 10 and ‘‘gap extension cost’’ of 1. Because of the large size of data-sets, only the first two iterations of the algorithm were performed. These HA sequences are very similar to each other in different influenza strains which allows highly accurate alignments. It should be noted that this study is focused on the HA (4th) segment of influenza which is very similar in different viruses. The differ-ence is commonly only 5–7 amino acids. All sequdiffer-ences were aligned before rule extraction, so the position in rules was kept strictly constant.
2.2.2. Data preparation
CBA assumes that the dataset is a normal relational table, which consists of N instances described bykdistinct attributes. These N instances have been classified into c known classes. According to our dataset, features or attributes represent the nucleotide or amino acid at each position of sequence (for example Att286 means 286th position of sequence). After sequences alignment, the average lengths of nucleotide and protein sequences were 1754 and 586, respectively.
To convert fasta format to relational table, we converted it to tab-delimited format. Then a comma was applied as separator between amino acids or nucleotides. Finally, sequences were stored in relational table. For application of CBA tool, we converted the data into C4.5 format.
2.3. The classification based on associations (CBA) algorithm Classification rule mining and association rule mining are two important data mining techniques. These techniques in combina-tion can result in a more robust classifier. The goal of classifica-tion rule mining is to discover a small set of descriptive rules that can accurately classify the entire data [26,27]. Association rule mining finds all rules in data which are acceptable with respect to minimum support and minimum confidence con-straints[15]. In association rule mining, the label target of min-ing is not pre-determined, whereas in classification rule minmin-ing there is one and only one pre-determined target. Both classifica-tion rule mining and associaclassifica-tion rule mining have practical appli-cations. CBA is an integrated classification and association rule mining algorithm.
2.3.1. Association rule
An association rule has the form LHS (Left Hand Side))RHS (Right Hand Side), where LHS and RHS areitemsets.Itemsetscan be defined in terms of transactions[28]. The following definitions foritemsetsand association rules were used in this study:
Definition 1.
(1) Given a set S of items, any nonempty subset ofSis called an ‘itemset’. Also, de-note D as a set of transactions, where each transaction T represents a set of items such that TS is well known.
(2) Given anitemsetI and a set T of transactions, the ‘support’ of I with respect to T, denoted by support (T(I)), is the number of transactions in T that contains all the items in I.
(3) Given anitemsetI, a set T of transactions and a positive inte-ger
a
, I is a ‘frequentitemset’ with respect to T anda
if sup-port (T(I))Pa
. We refer toa
as the ‘minimum support’.Definition 2.
(1) The ‘support’ of the association rule LHS)RHS with respect to a transaction set T is thesupportof theitemsetLHS[RHS with respect to T.
(2) The ‘confidence’ of the rule LHS)RHS with regards to a transaction set T is the ratio support (LHS[RHS) /support (LHS)[28].
Definition 3.
(1) Given Y a set of class labels. A ‘class association rule’ (CAR) is an implication of the form I)Y, where I is anitemset[29]. In fact each CAR is a LHS)RHS where the RHS is subset of Y set and LHS is I.
(2) The support and confidence of ‘class association rule’ calcu-late as same as definition 2, part 1 and 2.
CBA has 2 parts: a rule generator (called CBA-RG), defined based on algorithm Apriori for finding association rules[15]and a classi-fier builder (called CBA-CB).
The main central operation of CBA-RG is getting allruleitems which have support aboveminsup
<condset;y>
wherecondsetis a set of items, y2Y is a class label.Ruleitemsthat satisfyminsupare called frequentruleitems, while reminders named infrequentruleitems. For example, the following is aruleitem: <fðA;1Þ;ðB;1Þg;ðclass;1Þ>
where A and B are attributes. If the support count of thecondset {(A, 1), (B, 1)} is 3, the support count of theruleitemis 2, and the total number of cases in S is 10, then the support of theruleitemis 20%, and the confidence is 66.7%. Ifminsupis 10%, then the rulei-temsatisfies theminsupcriterion. We say it is a frequentruleitem [29].
In the current context S is a set of nucleotides or amino acids. For nucleotide sequences S = {A, C, T, G}, any member of S is an item. For protein sequences, S includes 20 members such as A, R, N, D, C, Q. Each protein or nucleotide sequence represents a trans-action. Each transaction is a subset of S. Entire sequences construct D set. Y set contains 2 member pandemic and non-pandemic or 0, 1, in this study.
2.3.2. The CBA-RG algorithm
The CBA-RG algorithm generates all frequentruleitemsby mak-ing multiple passes over the data. At first pass, it calculates the support of individual ruleitem and determines whether it is frequent. In each subsequent pass, it starts with the seed set of ruleitemsfound to be frequent in the previous pass. It employs this seed set to generate new possibly frequent ruleitems (candidate ruleitems). The actual supports for these candidate ruleitems are calculated during the pass over the data. At the end of the pass, it detects which of the candidateruleitemsare actually frequent. These rules determine class variables, so they called class association rules (CARs)[15,29].
2.3.3. The CBA-CB algorithm
The CBA-CB algorithm builds a classifier using CARs (prCARs). To produce the best classifier out of the whole set of rules, a min-imum number of rule sets would be selected to cover the training dataset and minimize the lowest error rate. There are 2msuch sub-sets, wheremis the number of rules. The number of rules can be more than 10,000, which is clearly infeasible. Therefore, this algo-rithm is a heuristic one. However, the built classifier performs very well as compared to that built by C4.5[29]. A CBA classifier is con-structed based on a dataset coverage pruning strategy, which is applied after all CARs are produced. In the first phase of pruning, all CARs are ranked by the algorithm and then arranged in a descending order. Ranking operation is as follows: suppose two rulesriandrj,ri>rj, if:
(1) Confidence (ri) > confidence (rj);
(2) confidence (ri) = confidence (rj), but support(ri) > support(rj); (3) confidence (ri) = confidence (rj) and support (ri) = support
(rj); however,riis generated beforerj.
Each training instance is classified by the rule which satisfies that training instance. Also, the rank of rules was considered and the rule which had the greatest rank for training instance was selected. The pruning method tries to choose a minimum number of rule sets, with classifying training instance correctly, to achieve the minimum error rate. The default class is selected as the major-ity class in the remaining instance that is not satisfied by any rule in the final classifier[30].
CBA algorithm is clearly different from some classification sys-tems, such as C4.5[27]and CART[26], which only generate a small set of biased rules. CBA produces the complete set of potential clas-sification rules. As first step it finds all the rules, and then selects the best rules to cover the training instances. Evaluation results have demonstrated that CBA classifier performs better than that built by C4.5. CBA is intimately related to association rule mining [15]. The Apriori algorithm [15] has been extracted CARs. In CBA-RG, itemset (a set of items) was not use as in algorithm Apriori. Instead, ruleitem was employed which encompasses a set of items and a class. Also the rule pruning technique was applied[27]to prune off those non-predictive and overfitting rules which is not used in association rule mining. More description about the CBA algorithm is provided inSupplementary Table 1. 2.4. Prediction software
In order to assist the task of predicting pandemic flu sequences, we developed a prediction tool for the human H1N1 influenza A virus, which is now available at http://www.predictionofpan demicinfluenza.ir. The prediction tool was developed using the extracted rules in this paper. By inserting the HA sequences in the software, the software can classify the pandemic or non-pandemic type of sequence accurately. Rapid identification of the type of sequence offer new possibilities in preparation
against influenza pandemics via vaccine development. The inter-face of the developed software is illustrated in Supplementary Fig. 2. The manual (guide) is provided with software.
2.5. Validation of CBA method and prediction software
We used 995 human H1N1 protein sequences to evaluate the ‘‘prediction pandemic influenza software’’ and the extracted rules. We named this ‘‘test data’’ since none of the sequences was partic-ipated on the extracting rule process. In this test data, 942 were pandemic sequences and the remainder were non-pandemic (53). The data were downloaded from the Influenza Research Database (IRD) and fasta sequences were imported into the software. Then, the predicted results were compared with the real data.
3. Results
3.1. Rule generation
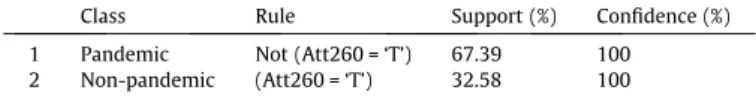
The CBA algorithm was applied to both nucleotide and protein sequence datasets. In the CBA algorithm, the minimum support for generation of frequent itemsets was set to 10%, and the mini-mum confidence for association rules was set to 90%. These thresh-olds were experimentally selected by examining different values. Table 1presents the extracted rules of the CBA model on nucleo-tide sequences, andTable 2displays the extracted rules on protein sequences.
As mentioned before, CBA generates some rules in the first step which are then pruned. One of the strengths of the CBA algorithm is that this model is not sensitive to the number of features (num-ber of nucleotides or amino acids). The CBA-RG algorithm gener-ates all frequent ruleitems by making multiple passes over the data. The reason for this capability is that CBA employs a pruning method to considerably reduce the number of generated rules. To produce the best classifier out of the whole set of rules, a minimum number of rule sets was selected to cover the training dataset and minimize the error rate. The computational cost was decreased due to this rule pruning. So, generating rule at the protein or nucleotide level in longer sequences was not expensive.
For empirical evaluation of CBA algorithm, Ma [31] used 26 datasets, from UCI Machine Learning Repository to assess accuracy, number of rules with/without pruning, and execution time. The results showed that without or with rule pruning the accuracy of the CBA was almost the same. Thus, those prCARs (class association rules after pruning) are sufficient for building accurate classifiers. Also, the average numbers of rules generated by algorithm CBA-RG with pruning was 15 times smaller than without pruning. With pruning, algorithm CBA-RG runs almost at the same time. Altogether, pruning strategy maintains the performance of classi-fier without increasing the execution time. The summarization of this comparison was shown inTable 3.
Furthermore, in this study, we evaluated the efficiency of the pruning strategy on our dataset (protein and nucleotide sequences). The number of rules in protein sequences was 127175 before pruning while this number decreased to 10003 after pruning. Also the number of rules in nucleotide sequences was 173580 and 11572 before and after pruning, respectively. Error
Table 1
Rules extracted from human H1N1 viral sequences in differentiating pandemic influenza from and non-pandemic nucleotide sequences.
Class Rule Support (%) Confidence (%) 1 Pandemic Not (Att260 = ‘T’) 67.39 100 2 Non-pandemic (Att260 = ‘T’) 32.58 100
rate in protein sequences was 0.0002 before pruning whereas it was 0.0003 after pruning. However, error rate was same before and after pruning in nucleotide sequences.
At the nucleotide level, rule 1 says that in 67.39% of the nucleo-tide sequences, when the 260th position isnot‘T’ (Thymine), the sequence is pandemic (Table 1). Rule 2 states that when this posi-tion is ‘T’, then the sequence is non-pandemic. Interestingly, 67.39% of the original sequences were pandemic. In other words, based on developed rules in Table 1 (Att260 = ‘T’ or not), all sequences (excepting one sequence) were classified correctly. Interestingly, this rule has not been reported before, emphasizing the power of large scale data mining in uncovering influenza evolution.
Table 2displays the extracted rules in protein sequences. Rule 1 states that if the 286th position is ‘D’ (Aspartic Acid)andthe 334th is ‘L’ (Leucine)orif the 223th is ‘Y’ (Tyrosine)andthe 233th is ‘I’ (Isoleucine), then the sequence is pandemic. Table 2 represents main sets of rules that are extracted by CBA in protein dataset. Similar to the nucleotide sequences, the support for rule 1 in pro-tein dataset was 67.42%. This level of support indicates that the generated rule can cover all pandemic parts (only two of the non-pandemic sequences were not detect). Similarly, rules 3 and
4 cover all of the non-pandemic sequences. The distinguishing power of the generated rules by CBA algorithm is noticeable.
As shown inTable 2, two of the rules in protein level were com-plement to each other. The reason is that these two rules cover all of the dataset and the inverse of each one covers the opposite one. Therefore, the complement of one rule leads to another one. This issue is applicable for nucleotide sequences as well. Fig. 1 and Supplementary Fig. 3represent the key discovered mutation spots on H1N1 strain in discrimination of pandemic from non-pandemic at protein and nucleotide sequences.
The extracted rules in this study were from simple set. For example in this rule: (Att286 = D and Att334 = L), the importance of Att286 and Att334 were equal and synchronously were able to identify potential pandemic sequences.
3.2. Classification accuracy assessment 3.2.1. Train data
In applying the CBA algorithm (described in Section2.3), we uti-lized 5373 H1N1 pandemic and non-pandemic sequences at both the nucleotide and protein levels. The overall classification errors of the extracted rules of the CBA algorithm were 0.01 for nucleo-tide sequences and 0.02 for protein sequences. We also measured sensitivity in terms of true positive rate (TPR) (also called recall in some fields) and false positive rate (FPR) on test data. TPR and FPR were 0.9958 and 0.0816 for TPR and FPR respectively. When TPR is close to 1, FPR will be close to zero, and this is the best per-formance for classification.
3.2.2. Test data
As described in Section 2.5, independent data was used to assess and validate the prediction software. Also, test data (unseen
Table 2
Rules extracted from human H1N1 viral strain to discriminate protein sequences of pandemic influenza from non-pandemic ones.
Class Rule Support (%) Confidence (%)
1 Pandemic (Att286 = D and Att334 = L) or (Att223 = Y and Att233 = I) 67.42 100 2 Pandemic NOT ((Att513 = ‘S’ and Att14 = ‘A’) or (Att322 = ‘E’ and Att14 = ‘A’) Or (Att274 = ‘L’)
Or (Att273 = ‘A’ and Att256 = ‘T’))
67.46 100 3 Non-pandemic (Att513 = ‘S’ and Att14 = ‘A’) or (Att322 = ‘E’ and Att14 = ‘A’)
or (Att322 = ‘E’ and Att513 = ‘S’) or (Att274 = ‘L’) or (Att273 = ‘A’ and Att256 = ‘T’)
32.53 100 4 Non-pandemic NOT ((Att286 = D and Att334 = L) or (Att223 = Y and Att233 = I)) 32.57 100
Table 3
Summary of the result of evaluating the efficiency of pruning on CBA in terms of accuracy, number of rules with/without pruning and execution time. The evaluation utilized 26 datasets, from UCI Machine Learning Repository.
Criteria Before pruning strategy After pruning strategy Accuracy 84.3 84.2
Number of rules 35,140 2377 Execution time (s) 6.35 6.44
Fig. 1.Schematic presentation of the key discovered mutation spots on the H1N1 strain that discriminate pandemic from non-pandemic sequences. (a) Nucleotide sequences. (b) Protein sequences.
sequences) were employed for rule discovery to prevent over fit-ting. Table 4 presents the characteristic of train and test data. After importing fasta sequences and prediction by software, we compared the software prediction results with the real data. For evaluating the result of software, four criteria were applied. They defined as: Accuracy¼ TPþTN TPþTNþFPþFN precision¼ TP TPþFP Sensitivity¼ TP TPþFN Specificity¼ TN TNþFP
whereTPis the number of true positives,TNis the number of true negatives,FPis the number of false positives, andFNis the number of false negatives. The software achieved to 99.60% for accuracy, 100% for sensitivity, 92.45% for specificity, and 99.58% for precision.
4. Discussion
Accurate and fast detection of pandemic influenza can signifi-cantly improve influenza surveillance and vaccine development. In this study, the rules which governed the 2009 pandemic influenza were extracted at both the nucleotide and protein levels through analyzing 5373 sequences. This amount of sequences cannot be analyzed by visual alignment. The ability to deal with a large num-ber of influenza sequences, compared with the common approach of considering a small number of sequences, is a significant strength of data mining based approaches. Furthermore, visual alignment is not able to statistically detect the association rule (co-occurrence) between mutation spots which is successfully addressed by the CBA algorithm in this study.
This study is the first which applies the CBA model to distin-guish the pandemic and non-pandemic H1N1 influenza sequences. We developed an accurate pandemic prediction system via gener-ating descriptive new rules for quick detection of pandemic sequences in 2009 H1N1 influenza sequences. Integration of classi-fication rule mining and association rule mining provided the pos-sibility to discover the new rules governing pandemic influenza which increased the prediction accuracy.
Several studies have investigated pandemic influenza from dif-ferent aspects. Sato et al.[32]performed the classification of influ-enza (between 1918 and 2009) by using a measure called entropic chaos degree. A phylogenetic analysis of influenza proteins demon-strated that a pandemic or a severe epidemic with high mortality was phylogenetically various from previous pandemic and severe epidemic strains. This study merely classified sequences into different lineages without identification any hotspots [32]. In addition, Finkelstein and et al., determined host-specific amino acid markers essential for an avian influenza virus to function in humans through multiple-sequence alignment and statistical testing of each aligned amino acid. These spots can be caused pandemic influenza in human [33]. Current study focused on coincident mutation spots on H1N1 pandemic influenza and data mining solution to discover coincident. In contrast, previous studies have focused on highly ranked residues that discriminate pandemic H1N1 from other type of influenza[34,35].
It should be noted that in future pandemics, it is reasonable to assume that influenza virus may again employ some of its
successful 2009 pandemic mutations/re-assortments. It is not probable that influenza completely starts from beginning in pan-demic induction as it needs more time and energy. It can be assumed that influenza will use the 2009 rules and add a couple of new rules. Mutation is random and a new virus may evolve by multiple pathways. However, the existence of variants closely related to previous pandemic types in populations may make the production of novel pandemic viruses more likely, or speed up the process. Also, it is reasonable to assume that the genetic muta-tion and re-assortment pattern allowed virus to infect human, swine, and birds and more importantly, it acquired the life-treating ability to transmit from human to human without the need to intermediate swine or bird. Consequently, unraveling the underlying layers of 2009 pandemic induction, extraction of rules, and developing an expert system for detection of 2009 pan-demic influenza provide an early platform for scanning the poten-tial pandemic influenza sequences and also clues for finding the influenza sequences with host transmission ability.
For ease of prediction of pandemic H1N1 influenza, we devel-oped the software, ‘‘Prediction of Pandemic Influenza’’. This soft-ware achieved a high accuracy of 99.58% on unseen data where the true positive rate was 0.9958 and the false positive rate was 0.0816. It should be noted that due to possible contributions of other segments of the influenza genome in pandemic induction, the approach presented in this study can be extended to analyze the roles of other segments in future studies.
An important finding of this study was the discovery of new rules of pandemic induction. These new rules can potentially dis-close undiscovered antigenic sites of H1N1 sequences. This study is a pioneering investigation in the application of data mining methods to discover potential hotspots for diagnosing pandemic sequences. These hotspots were central in the prediction of pan-demic sequences using the CBA algorithm. The role of some rules such as D222G, D225G, and G222N mutations in pandemic induc-tion has been previously reported through laboratory experiments [3,9–13]. The biological consequence of change at position 222 of the HA segment is alteration in receptor binding, pathogenesis and transmissibility of the influenza virus[11]. Also, mutation at position 225 in HA of pandemic influenza H1N1 virus has been reported to enhance virulence in mice[12]. Here, we developed an alternative data mining-based approach for identifying these spots as well as searching for new undiscovered hotspots.
Data mining methods such as CBA are able to investigate a large number of viruses across the world. This data mining based study revealed 10 potential candidate spots the protein level compared with only two positions from all previous studies. Identification of these spots will provide the required information for future lab-oratory investigations. Mutation is random and a new virus may evolve by multiple pathways. However, the existence of variants closely related to previous pandemic types in populations may make the production of novel pandemic viruses more likely, or speed up the process. Unraveling the underlying layer of 2009 pandemic induction, extraction of rules, and developing an expert system for detection of 2009 pandemic influenza provide an early platform of scanning the potential pandemic influenza sequences in future pandemics.
Vaccine design and antiviral strategies are evolving rapidly due to the advent of novel approaches such as genome-wide survey and genome-based antigen selection. Reverse vaccinology employs in silico prediction of vaccine antigen candidates using the genetic sequence, without the need of cultivating the pathogen. Indeed, pathogenic genome can be screened in a high-throughput system to be evaluated for protective immunity and vaccine development [36,37]. Identification of the hot spots in the current study opens a new avenue for finding the immunity spots and more importantly, combination of immunity-affecting as a target for vaccine
Table 4
Number of sequences that were used for rule extraction and prediction of H1N1 pandemic influenza.
Sequences No. pandemic sequences
No. seasonal sequences
No. total sequences Train data (Protein) 3621 1752 5373 Train data (Nucleotide) 3621 1752 5373
development. In other words, we are now able to screen the func-tionality of some positions by discriminating pandemic H1N1 influenza from non-pandemic sequences by CBA. The analysis can be used in reverse vaccine approach to help to prevent future influenza pandemics.
Classification based on association rule mining algorithms such as CBA can be used to address similar problems including host range detection of influenza and other viruses, and may also be applied to other diseases. The computational and financial cost of this method is very low whereas the speed, scope and accuracy are remarkably high. Also, these methods can be used as prepro-cessing steps before expensive and lengthy laboratory experimen-tation. The only requirement of these methods is reliable and extensive sequence data that are becoming increasingly available in the public domain.
5. Conclusion
The novelty of our approach relies on its association rule strat-egy and its ability to identify combinations of hotspots in influenza evolution. We developed efficient software with accuracy higher than 99% for discrimination of pandemic from non-pandemic influ-enza sequences at both nucleotide and protein levels. We suggest that statistically-based discovery of hotspots in sequences via the CBA method has the potential to increase the accuracy compared with commonly used clustering approaches. Supervised data min-ing approaches provide the opportunity to firstly discover signifi-cant rules with respect to label variable (here pandemic), and to apply these rules in pandemic prediction of strains. This opportu-nity is missed by unsupervised clustering methods since they do not calibrate themselves with label variable.
This study opens a new avenue in discovery of mutation spots during evolution of pandemic influenza and provides an approach to the prediction of the configuration of future influenza sequences. Regarding the co-occurrence of multiple mutations in nature, the discovered rules by CBA are more appropriately applied in studies of biological sequences.
Conflict of interest
The authors declare that there is no conflict of interest.
Availability
The software, ‘‘Prediction of Pandemic Influenza’’, which was developed using the extracted rules’ is available athttp://www. predictionofpandemicinfluenza.irand also https://dl.dropboxuser content.com/u/90445867/Prediction%20Pandemic%20Influenza.rar.
Acknowledgments
The data mining analysis carries out at Department of Genetics and Evolution, School of Biological Sciences of The University of Adelaide and School of Electrical Engineering and Computer, Shiraz University. We greatly thank Professor Jeremy Timmis and Dr Morgan Newman at School of Biological Sciences of The University of Adelaide for editing the manuscript and their thoughtful comments. We thank Ms. Shirin Mirloohi, Chinese Academy of Science, for her valuable help in data preparation.
Appendix A. Supplementary material
Supplementary data associated with this article can be found, in the online version, athttp://dx.doi.org/10.1016/j.jbi.2015.07.018.
References
[1]G. Neumann, T. Noda, Y. Kawaoka, Emergence and pandemic potential of swine-origin H1N1 influenza virus, Nature 459 (7249) (2009) 931–939. [2] G. Lu, et al., Influenza a virus informatics: genotype-centered database and
genotype annotation, in: Computer and Computational Sciences, IEEE, 2007, pp. 76–83.
[3]A. Melidou et al., Molecular and phylogenetic analysis of the haemagglutinin gene of pandemic influenza H1N1 2009 viruses associated with severe and fatal infections, Virus Res. 151 (2) (2010) 192–199.
[4]E.D. Kilbourne, Influenza pandemics of the 20th century, Emerg. Infect. Dis. 12 (1) (2006) 9–14.
[5] Swine Influenza, 2009 [cited 2009 April]; Available from: <http://www.who. int/csr/don/2009_04_27/en/index.html>.
[6]M. Ebrahimi et al., Understanding the underlying mechanism of HA-subtyping in the level of physic-chemical characteristics of protein, PLoS ONE 9 (5) (2014) e96984.
[7]M. Strengell et al., Minor changes in the hemagglutinin of influenza A(H1N1)2009 virus alter its antigenic properties, PLoS ONE 6 (10) (2011) e25848.
[8]M. Hindiyeh et al., Rapid detection of influenza A pandemic (H1N1) 2009 virus neuraminidase resistance mutation H275Y by real-time reverse transcriptase PCR, J. Clin. Microbiol. 48 (5) (2010) 1884–1887.
[9]H. Yang, P. Carney, J. Stevens, Structure and receptor binding properties of a pandemic H1N1 virus hemagglutinin, PLoS Curr. 2 (2010).
[10] F. Baldanti et al., Severe outcome of influenza A/H1N1/09v infection associated with 222G/N polymorphisms in the haemagglutinin: a multicentre study, Clin. Microbiol. Infect. 17 (8) (2011) 1166–1179.
[11]J.A. Belser et al., Effect of D222G mutation in the hemagglutinin protein on receptor binding, pathogenesis and transmissibility of the 2009 pandemic H1N1 influenza virus, PLoS ONE 6 (9) (2011) e25091.
[12]B. Zheng et al., D225G mutation in hemagglutinin of pandemic influenza H1N1 (2009) virus enhances virulence in mice, Exp. Biol. Med. 235 (8) (2010) 981– 988.
[13]Y. Liu et al., Altered receptor specificity and cell tropism of D222G hemagglutinin mutants isolated from fatal cases of pandemic A (H1N1) 2009 influenza virus, J. Virol. 84 (22) (2010) 12069–12074.
[14] A. Sivathayalan, Comparison of Clustering and Classification Methods Combined with Dimension Reduction Using Gene Expression Data, Carleton University, 2009.
[15] R. Agrawal, R. Srikant, Fast algorithms for mining association rules in large databases, in: Proceeding of the 20th International Conference on Very Large Data Bases, VLDB, Santiago, Chile, 1994.
[16]J. He, M.W. Deem, Low-dimensional clustering detects incipient dominant influenza strain clusters, Protein Eng. Des. Sel. 23 (12) (2010) 935–946. [17] P.K. Attaluri, et al., Applying Machine Learning Techniques to Classify H1N1
viral Strains Occurring in 2009 flu Pandemic, BIOT-2009, 2009, p. 21. [18] F.F. Sherif, M. El Hefnawi, Y. Kadah, Genomic signatures and associative
classification of the Hemagglutinin protein for Human versus Avian versus Swine Influenza A viruses, in: Radio Science Conference (NRSC), 2011 28th National, IEEE, 2011.
[19]Influenza Research Database (IRD). 2012 [cited 2012 September]; Available from: <http://www.fludb.org/brc/home.do?decorator=influenza>.
[20] R.C. Edgar, MUSCLE: multiple sequence alignment with high accuracy and high throughput, Nucleic Acids Res. 32 (5) (2004) 1792–1797.
[21]M. Larkin et al., Clustal W and Clustal X version 2.0, Bioinformatics 23 (21) (2007) 2947–2948.
[22]C. Notredame, D.G. Higgins, J. Heringa, T-Coffee: a novel method for fast and accurate multiple sequence alignment, J. Mol. Biol. 302 (1) (2000) 205–217. [23]O. Gotoh, Significant improvement in accuracy of multiple protein sequence
alignments by iterative refinement as assessed by reference to structural alignments, J. Mol. Biol. 264 (4) (1996) 823–838.
[24]K. Katoh et al., MAFFT: a novel method for rapid multiple sequence alignment based on fast Fourier transform, Nucleic Acids Res. 30 (14) (2002) 3059–3066. [25]M. Hirosawa et al., Comprehensive study on iterative algorithms of multiple
sequence alignment, Computer Appl. Biosci.: CABIOS 11 (1) (1995) 13–18. [26]L. Breiman et al., Classification and Regression Trees, CRC Press, 1984. [27]J.R. Quinlan, C4. 5: Programs for Machine Learning, vol. 1, Morgan Kaufmann,
1993.
[28]S. Doddi et al., Discovery of association rules in medical data, Med. Inform. Internet Med. 26 (1) (2001) 25–33.
[29] W.H. Bing Liu, Yiming Ma, Integrating classification and association rule mining, in: Proceedings of the Fourth International Conference on Knowledge Discovery and Data Mining (KDD-98, Plenary Presentation), New York, USA, 1998.
[30] W.-C. Chen, C.-C. Hsu, Y.-C. Chu, Increasing the effectiveness of associative classification in terms of class imbalance by using a novel pruning algorithm, Expert Syst. Appl. 39 (17) (2012) 12841–12850.
[31] B.L.W.H.Y. Ma, Integrating classification and association rule mining, in: Proceedings of the Fourth International Conference on Knowledge Discovery and Data Mining, 1998.
[32]K. Sato, T. Tanabe, M. Ohya, How to classify influenza a viruses and understand their severity, Open. Syst. Inf. Dyn. 17 (03) (2010) 297–310.
[33]D.B. Finkelstein et al., Persistent host markers in pandemic and H5N1 influenza viruses, J. Virol. 81 (19) (2007) 10292–10299.
[34]K. Tharakaraman et al., Antigenically intact hemagglutinin in circulating avian and swine influenza viruses and potential for H3N2 pandemic, Sci. Rep. 3 (2013) 1822.
[35]D. Meroz et al., Putative amino acid determinants of the emergence of the 2009 influenza A (H1N1) virus in the human population, Proc. Natl. Acad. Sci. USA 108 (33) (2011) 13522–13527.
[36]R. Rappuoli, Reverse vaccinology, a genome-based approach to vaccine development, Vaccine 19 (17) (2001) 2688–2691.
[37]I. Delany, R. Rappuoli, K.L. Seib, Vaccines, reverse vaccinology, and bacterial pathogenesis, Cold Spring Harbor Perspect. Med. 3 (5) (2013) a012476.