3
1
Organizing a Cost-Reduction
Program
The Bottom Line
You need a multidisciplinary team to attain signifi cant cost reduction. Support from the top helps greatly. You will encounter resistance to the cost-reduction effort and there are risks associated with cost-reduction activities, but these issues can be overcome. The team needs to prioritize cost-reduction opportunities, assess the necessity of all costs, quantify projected savings, identify implementation costs and risks for each proposed action, meet at least once a week and maintain an action plan to create and sustain cost-reduction momentum.
Key Questions
Do we have a cost-reduction effort in place? Do we have cost-reduction targets?
How do we identify and eliminate unnecessary costs?
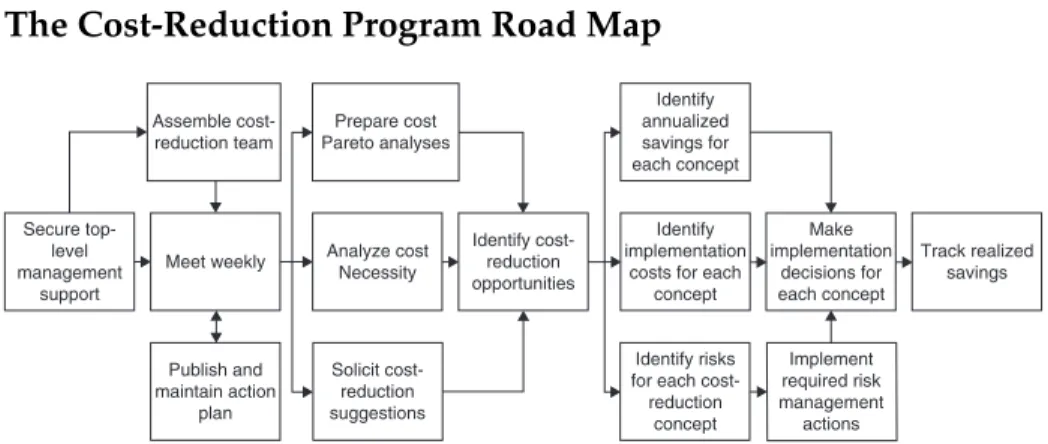
The Cost-Reduction Program Road Map
Secure top-level management support Assemble cost-reduction team Meet weekly Publish and maintain action plan Prepare cost Pareto analyses Analyze cost Necessity Identify cost-reduction opportunities Identify implementationcosts for each concept Identify annualized savings for each concept Make implementation decisions for each concept Track realized savings Identify risks for each
cost-reduction concept Implement required risk management actions Solicit cost-reduction suggestions
Figure 1.1 The cost-reduction road map.
Teamwork
If you want to reduce costs in your company, you can’t do it by yourself. There are cost-reduction opportunities in every department. Identifying and implementing these cost reductions requires the enthusiastic cooperation of people in sales, fi nance, engineering, manufacturing, quality assurance, pur-chasing, facilities, and human resources. Even if you wish to limit cost reduc-tions to a single area, you’ll still need help from the people in that area and probably the fi nance organization. You can’t mandate cost reduction. You have to have help from the people who will make it happen.
Senior management support will help to make the cost-reduction effort successful. If your interest in cost reduction is the result of a directive from the organization’s chief executive, you already have the senior-level support you need. If your effort is self-initiated, support from the person at the top is a great asset. You need support from other cost-reduction team members, but if the chief execu-tive is on board, others will be more enthusiastic about supporting the effort.
The best way to identify and implement cost reductions is to build a team with one or two people from each area who believe in the mission. This team should be made up of people who are already in the company. You don’t need to hire more people for this (in fact, a recurring theme throughout this book will be to keep the headcount as low as possible).
Resistance to Change
Most people are naturally resistant to change, and cost reduction will involve change (sometimes big change). Department managers and others may resist cost-reduction–related changes for any of several reasons:
The idea was not theirs. •
The idea will involve effort on their part. •
They did not think of the idea fi rst, and perhaps that is a source of •
embarrassment.
The idea has implementation and operational risks. •
There may be turf issues, where the team is recommending eliminating or •
modifying a pet project, or the affected managers don’t like the idea of some-one else suggesting how their departments should operate.
All of these resistance-to-change factors are likely to be encountered as the cost-reduction effort proceeds. All of these arguments must be overcome if the cost-reduction effort is to succeed. It’s a lot easier for people to accept change if the general manager or company president is visibly and consistently behind it. That’s not the only requirement for overcoming resistance to change, but with-out top-level support, it will be harder to overcome.
The Cost-Reduction Team
If the chief executive asks you to head up a cost-reduction effort, you are in a good position. The most important thing you should ask for is that you get good people on the cost-reduction team. You don’t necessarily want the head of each functional area, and you certainly don’t want people who are less-valuable employees within their departments. You want people who:
A
• re bright, curious, and “out of the box” thinkers.
H
• ave a high energy level.
M
• ake things happen.
M
• eet their schedule commitments.
If you can assemble a team with people meeting these criteria, you are going to have a lot of fun and your company will realize great savings.
In the fi rst meeting, the fi rst assignments should be identifying and ranking
the organization’s current costs, and assessing the necessity of each cost. You won’t be able to do all of this in the fi rst meeting, but the team members should be able to have gathered this information by the next meeting. This will require support from the fi nance department (as will many cost-reduction activities, which is why it makes sense to have a fi nance person on the team).
The cost reduction team should meet weekly at a minimum, because if you meet less frequently the effort will lose momentum. Here’s a suggested approach for how the cost-reduction meetings should be run:
You (or someone else who writes well and is good at capturing details) •
should take notes and publish meeting minutes no later than one day after each meeting. The meeting minutes should be sent to the chief executive, the team members, and the heads of each department. Doing this keeps others in the loop, and it keeps the effort alive.
The meeting minutes should include a “living” task list. We’ll present a •
suggested format and say more about this in a bit. Team members should provide input regarding the status of each task in the meeting, and the per-son preparing the meeting minutes should update the task list to show current status.
The team members should discuss cost-reduction ideas in a free-fl owing •
manner. The ideas may come from the team members or from others in the company. All of the ideas should be captured on paper. After discussing all of the ideas, the team should decide if each idea should be pursued. If the team thinks an idea has merit, in most cases it will go to the affected depart-ment manager. We’ll talk more about this later.
Cost Pareto Analysis
Identifying and ranking all of the organization’s current costs is best pre-sented on a department-by-department basis, and by overhead cost categories
for the entire company. We recommend presenting this in a Pareto1 format. It’s
important to do this for each department and by overheard cost category to identify where the greatest opportunities exist. Within the manufacturing area, for example, labor and material costs are probably higher than other costs, and based on that, they probably have greater cost-reduction opportunities. Smaller cost categories will also offer opportunities (and there may be low-hanging fruit that the team wants to grab), but in general the larger cost categories offer greater opportunities when seeking cost reductions.
Let’s assume the manufacturing department reviews its monthly operating costs when they receive them from the fi nance department, and they fi nd the following:
1. Vilfredo Pareto (1848–1923) was an Italian economist who is credited with originating the 80-20 rule when he observed that 80 percent of Italy’s wealth was concentrated in 20 per-cent of the population. This led to the creation of the 80-20 concept and Pareto charts, which show most-frequently-occurring to least-frequently-occurring items, or most costly to least costly expenses. The idea is that efforts should be focused on the most signifi cant areas.
With this information in an Excel spreadsheet, it is a simple matter to sort the data (it’s already been sorted in Table 1.1) and prepare the Pareto chart shown in Figure 1.2).
Table 1.1 July Manufacturing Department Costs
Cost Category Cost
TB Steel $227,950 Labor $188,160 Paint $66,560 Supervision $54,000 Overtime $50,400 Maintenance $18,992 Tooling $14,777 Electricity $13,562 Weld gas $7,285
Supervisor car leases $7,012
Fuel $6,783 Weld Rod $5,934 Travel $4,254 Coffee $3,760 Training $3,250 $0 $50,000 $100,000 $150,000 $200,000 $250,000
Steel Labor Paint
SupervisionOvertimeMaintenance Tooling
ElectricityWeld gas Supervisor car leas
es Fuel
Weld rod Travel CoffeeTraining
Based on the information presented in Figure 1.2, it is obvious that material and labor are the largest cost categories. Logic dictates that seeking cost-reduc-tion opportunities in these areas offers the best potential. In addicost-reduc-tion to steel and labor costs, overtime (a frequently abused area) pops out as a relatively large cost, so it should also become a cost-reduction target.
Once the analysis has been completed for each department and for the com-pany’s overhead costs, the team can then brainstorm reduction activities in these areas. The team can also apply the techniques to be reviewed in detail throughout this book.
As mentioned earlier, the team’s activities should not be limited to just the largest cost categories. We’re only suggesting that because of their size, these “big hitters” probably contain greater cost-reduction opportunities. There will be opportunities in the lower cost areas that come from other people’s sugges-tions as well as the cost-reduction team members. The team should consider these as well.
Assessing Necessity
The next action is identifying the magnitude and evaluating the necessity of
each cost item. This is best done on a department-by-department2 basis and for
overhead costs. Table 1.2 shows this for the manufacturing area.
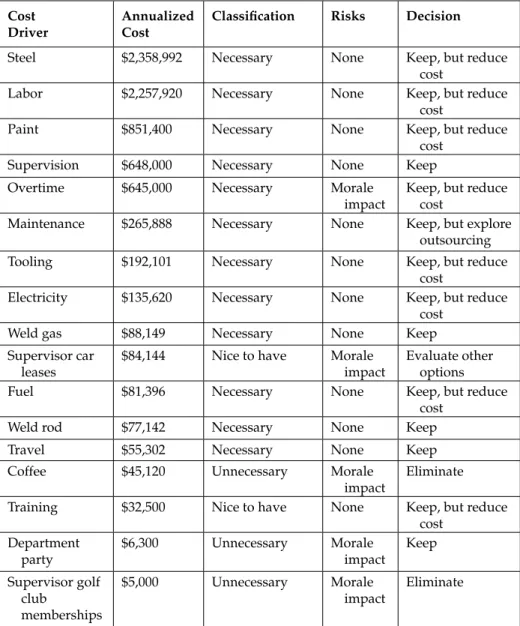
The idea here is to identify each cost as necessary, unnecessary, or nice- to-have. The team may wish to use different necessity descriptors, but the con-cept is to identify unnecessary costs and nice-to-have items as potential candidates for elimination. Necessary items should not be eliminated, but they may be candidates for further analysis using the techniques described in the rest of this book.
The fi rst part of this task is relatively easy (identifying the cost items). The second part (evaluating the necessity of each) is much more subjective. Resis-tance to cost reductions in some of these areas will almost certainly emerge. Sometimes when costs are presented this way, the frivolity of the unnecessary costs becomes obvious and no resistance occurs.
Table 1.2 shows a recommended approach for accomplishing this.
2. One can argue that the department managers and supervisors should be making these assessments as an ongoing part of their jobs. Although this is true, it frequently does not occur. The exercise described here lends rigor to the effort.
Table 1.2 Cost Necessity Assessment
Cost Driver
Annualized Cost
Classifi cation Risks Decision
Steel $2,358,992 Necessary None Keep, but reduce cost
Labor $2,257,920 Necessary None Keep, but reduce cost
Paint $851,400 Necessary None Keep, but reduce
cost
Supervision $648,000 Necessary None Keep
Overtime $645,000 Necessary Morale
impact
Keep, but reduce cost
Maintenance $265,888 Necessary None Keep, but explore outsourcing Tooling $192,101 Necessary None Keep, but reduce
cost
Electricity $135,620 Necessary None Keep, but reduce cost
Weld gas $88,149 Necessary None Keep
Supervisor car leases
$84,144 Nice to have Morale impact
Evaluate other options
Fuel $81,396 Necessary None Keep, but reduce
cost
Weld rod $77,142 Necessary None Keep
Travel $55,302 Necessary None Keep
Coffee $45,120 Unnecessary Morale
impact
Eliminate Training $32,500 Nice to have None Keep, but reduce
cost Department party $6,300 Unnecessary Morale impact Keep Supervisor golf club memberships $5,000 Unnecessary Morale impact Eliminate
Cost-Reduction Action Plans
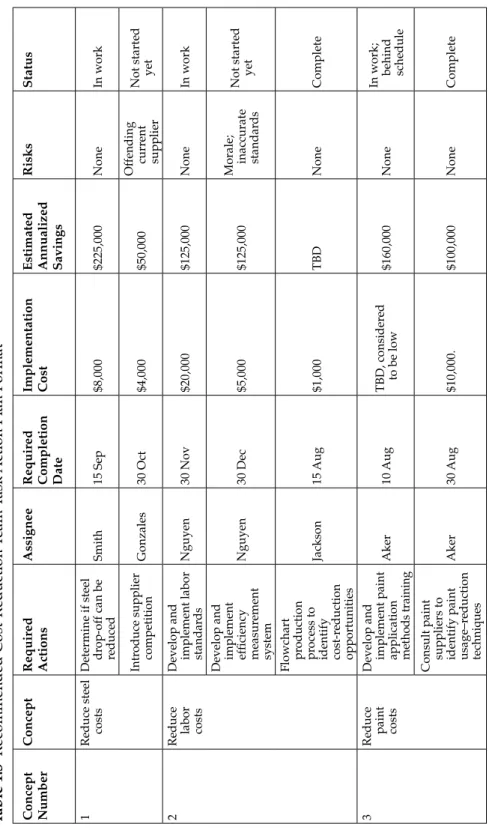
Maintaining and updating an action item list is critical. It assures that each cost-reduction concept is captured on paper and retained until it has been objec-tively evaluated, and either discarded or implemented. It’s also important because it identifi es who needs to do what, by when they need to do it, and current status.
T
able 1.3
Recommended Cost-Reduction T
eam T
ask
Action Plan Format
Concept Number
Concept
Required Actions
Assignee
Required Completion Date Implementation Cost Estimated Annualized Savings
Risks
1
Reduce steel costs Determine if steel dr op-of f can be reduced Smith 15 Sep $8,000 $225,000 None Intr oduce supplier competition Gonzales 30 Oct $4,000 $50,000 Of fending curr ent supplier 2
Reduce labor costs Develop and implement labor standar
ds Nguyen 30 Nov $20,000 $125,000 None
Develop and implement effi
ciency measur ement system Nguyen 30 Dec $5,000 $125,000
Morale; inaccurate standar
ds Flowchart pr oduction pr ocess to identify cost-r eduction opportunities Jackson 15 Aug $1,000 TBD None 3
Reduce paint costs Develop and implement paint application methods training
Aker 10 Aug TBD, consider ed to be low $160,000 None
Consult paint suppliers to identify paint usage–r
eduction techniques Aker 30 Aug $10,000. $100,000 None 10
4 Reduce overtime Identify overtime causes
Thomson
15 Sep
$1,000
See below
None
Develop and implement overtime budget
Dept Heads
20 Sep
$0
$15,000
Morale; making sur
e work is
complete
Develop and implement overtime r
equest form Thomson 20 Sep $0 $8,000 Department manager ’s acceptance 5 Eliminate fr ee cof fee Secur e appr oval fr om chief executive Spitler 15 Aug $0 See below See below
Notify all personnel and implement
Dept Heads 15 Aug $0 $45,120 Morale 6
Eliminate golf club member
-ships
Discuss issue with chief executive and department heads
Jones 15 Aug $0 See below None If decision is to pr oceed, notify supervisors Dept Heads 30 Aug $0 $5,000
Morale, industry per
ceptions
7
Reduce mainte- nance costs Identify dominant maintenance cost contributors
Balicki 30 Sep $500 TBD None Determine if mor e pr eventive
maintenance would lower costs
Balicki 30 Sep $500 TBD None Explor e outsour cing
maintenance function and make recommendation
Balicki
30 Sep
$500
TBD
Existing maintenance staf
f morale
Notes: Gray-shaded r
ow indicates action complete.
Red-shaded r
ow indicates action behind schedule.
The action item list becomes the cost-reduction plan, and maintaining and circu-lating it lets everyone know how the team is doing.
Table 1.3 shows a format that works well. As the table indicates, completed actions are shaded in gray and actions that are behind schedule are shaded in red. This gives the team and everyone who reviews the plan a quick look at how things are progressing. Nearly every assigned action will require the efforts of more than one person, but it’s always a good idea to list only one name for each action in the plan. The chances of the action being completed on schedule are higher if it has a single owner.
Table 1.3 shows the plan for only one area in the organization, and the exam-ple shown here is not intended to be comexam-plete. The action plan needs to address all areas.
Quantifying Estimated Savings
and Implementation Costs
The actions the team identifi es in its plan are all intended to produce a cost savings, but before making any changes, the team should objectively estimate what the savings will be. Great care in maintaining objectivity is required here. It is very easy to overestimate planned savings.
Most cost-reduction concepts require implementation actions, and there is usually a cost associated with these actions. Sometimes there are no costs (for example, if an unnecessary step is eliminated), but most of the time there are costs associated with changes. For example:
Engineers may need to redesign products. •
Manufacturing engineers may need to redesign processes. •
The purchasing department may need to obtain prices from alternative •
suppliers.
New production equipment may be required. •
Facilities engineers may need to modify the building. •
New designs may require testing to confi rm requirements compliance. •
There may be disruptions as the change is implemented. •
These actions all involve cost, and it is important to accurately predict what these costs will be. The obvious reason for doing this is that it makes no sense to implement a cost-reduction change if the implementation cost exceeds the savings.
Our experience indicates that it is best to quantify the savings on an annual-ized basis, and to consider the implementation costs in the fi rst year. Sometimes
in job-shop production environments with production runs lasting less than a year it is best to quantify savings on a contract basis. This is another area where the fi nance department can help.
Who Should Do This Work
The cost-reduction team can’t do everything. In fact, by itself the team won’t be able to evaluate or implement most of the ideas. The team is a catalyst. It has to work with others in the organization to gain support, evaluate ideas, and where appropriate, implement cost-reduction actions.
Risks
Risk has to be a key part of the decision process when evaluating every cost-reduction concept. In assessing risk, there are three questions to consider:
Have we done this before? •
What can go wrong if we do this? •
What are the things we need to do to prevent bad things from happening? •
If the concept being considered has been implemented elsewhere, or if it con-sists of smaller actions that have been done before, the risk is probably minimal. If neither condition exists, the organization needs to aggressively and objectively identify all potential consequences (not just the planned savings) and take steps to manage the risks. Risks may include customer reaction, product performance, supplier reliability, morale, process yield, safety, and other factors. Specifi c risks in different areas are identifi ed in each chapter throughout the rest of this book. The important thing to recognize is that cost reduction involves change, change carries associated risk, and prudent people identify and manage risk.
References
W.J. Stevenson, Production/Operations Management, New York, McGraw-Hill, 2000. R.W. Bradford, Simplifi ed Strategic Planning: The No-Nonsense Guide for Busy People Who