Using Video Prototypes for Evaluating Design Concepts
with Users: a comparison to usability testing
Matthijs Zwinderman, Rinze Leenheer, Azadeh Shirzad, Nikolay Chupriyanov, Glenn Veugen, Biyong Zhang and Panos Markopoulos
Eindhoven University of Technology, Department of Industrial Design, Eindhoven, The Netherlands
{mzwinderman, r.a.leenheer; a.shirzad; n.chupriyanov; gveugen; b.zhang}@gmail.com, [email protected]
Abstract. We present an exploratory study that compared user feedback ob-tained from evaluating a mobile application versus a reverse engineered video prototype of this same application. The comparison included qualitative and quantitative data analysis. Questionnaire responses regarding user acceptance (UTAUT [8]) and the overall user experience (AttrakDiff [4]) showed no dif-ferences. Qualitative analysis of the comments by potential users yielded simi-lar results. Some differences regarding comments pertaining to the fit of the ap-plication to its context of use and appreciation of hedonic qualities, warrant in-vestigation in future research. Usability tests seem better suited to identify is-sues referring to the functionality and data accessed. Overall the results confirm the validity and usefulness of video prototyping, and can help us develop a bet-ter understanding of its strengths and weaknesses.
Keywords: Video prototyping, comparative usability study, experiment, user centered design methodology.
1
Introduction
The design of interactive systems benefits from early exposure of design concepts to users to obtain feedback and improve them iteratively. During early phases of the design process fast, and low-cost design representations are better suited than fully functional systems or realistic prototypes: this allows ideas to be tried out, changes to be made efficiently, and ideas that do not work well to be abandoned without much loss of effort. Video prototypes or video scenarios are such representations, showing on video envisioned scenarios of use.
Video as a medium offers several possibilities. It can draw attention to what users do with technology rather than technical workings, can be unencumbered by technologi-cal challenges that hamper implementation, and does not require technitechnologi-cal expertise to be understood or created. Importantly the technique makes it just as easy to represent mobile interaction, ubiquitous computing, tangible and embodied interaction, etc. Shooting interaction in a particular location or social setting makes it easy to visualize context of use. The continuity of the medium can help explicate and explain detailed
interaction design issues [1] that are typically brushed over in more discrete represen-tations such as text scenarios or storyboards.
Given the apparent usefulness and popularity of this prototyping technique the question arises whether the feedback it helps obtain from representative users pro-vides valid insights. The video prototype inevitably represents a normative view of how the designer imagines that such a system should be used; it typically will show flawless execution of interaction tasks by expert users as the designer imagines will be possible. Further the viewer cannot report back on actual use of the system and on actual experiences, but on projections from a current context, and an imagined use of the system.
In this paper we compare feedback obtained from users who were shown a video prototype (from here on viewers) to that provided by test participants in a usability testing session.
2
Methodology
An experiment was designed to compare the feedback obtained from usability testing a widely available mobile application and a video prototype that was reverse engi-neered to represent the interaction with this application. The comparison focused on what interaction and user experience designers typically look for: overall apprecia-tion, usability, perceived usefulness and acceptance (how likely it is that they will use the application), measures of the user experience, and indications of any potential improvements to the design.
A between subjects design was chosen; participants would either watch a video proto-type of an actor carrying out some tasks, or carry out the same tasks in a usability test. Quantitative and qualitative data was collected and compared. The qualitative analysis included an exploratory phase of open coding where hypotheses were generated, fol-lowed by a closed coding (directed content analysis) to validate these hypotheses.
2.1 Materials
In order to make a useful comparison, we chose to evaluate a product that would be both novel to test participants and sufficiently complex. Novel, since users seeing the video-prototype should give feedback based on the video and not on previous experi-ence. The interaction should not be trivial or familiar so that explaining it to viewers would indeed rely on the video prototype rather than a comment or prior knowledge. We chose as a test case to evaluate Google Goggles1, a smartphone application. With this application a user can take pictures from objects and analyze and extract infor-mation from it. For instance, the application can recognize text and translate it or find the name of a painter based solely on a photograph of the painting. This application is still a novelty for the broad public, even though it is widely available in the iPhone
1
and Android ‘markets’. Also the means of interaction is rather unfamiliar to the broad public relying on the camera rather than entering information with buttons and touch. In this sense, an evaluation based on the video prototype is practically identical (as far as the users are concerned) with the situations in which video prototypes are evaluated as part of an actual design process.
2.2 Tasks and Procedure
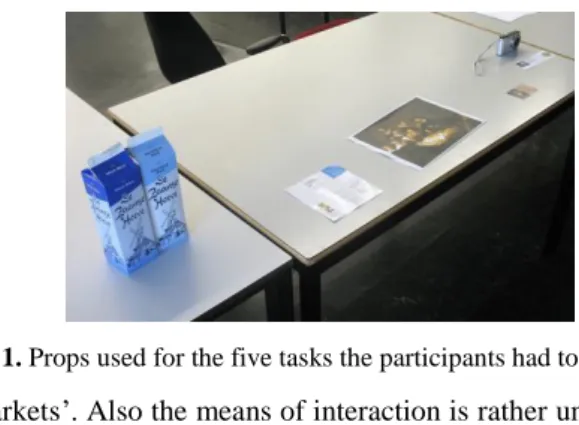
The comparative evaluation covered the main application functions which were mapped to five distinct evaluation tasks:
Translating the ingredient list of a recipe printed on paper.
Translating the name of two milk cartons (half-skimmed and whole milk).
Getting the title and artist name of a famous painting.
Transferring the details of a business card to the phone`s address book.
Getting the price of a camera online (for this task both a picture of the camera or a description card could be used).
The products used for the test are shown in Figure 1.
2.3 Participants
In total thirty individuals participated in the study (11 female, 19 male, mean age=22.34, std=2.94, min=18, max=28), who were recruited among students in the university. Participants were divided over two groups: a product group (P) and a vid-eo group (V). In the ‘product’ group participants performed the five tasks with the Goggles application which was pre-installed on an Android based HTC phone. In the video group they watched a video showing actors carrying out these tasks.
2.4 Measures
In both groups the participants then completed two questionnaires, the AttrakDiff [4] for evaluating user experience aspects and UTAUT [8] for evaluating user ac-ceptance, and participated in a semi-structured interview.
2.5 Video Prototype
The video-group saw a video where an actor performed the same tasks, each in a fit-ting context. The video-prototype2 was a short movie lasting 2 minutes and 38 sec-onds. The video features one of the researchers acting out foreign exchange student using a Goggles application in a supermarket, an art-exhibition, and an electronics-store.
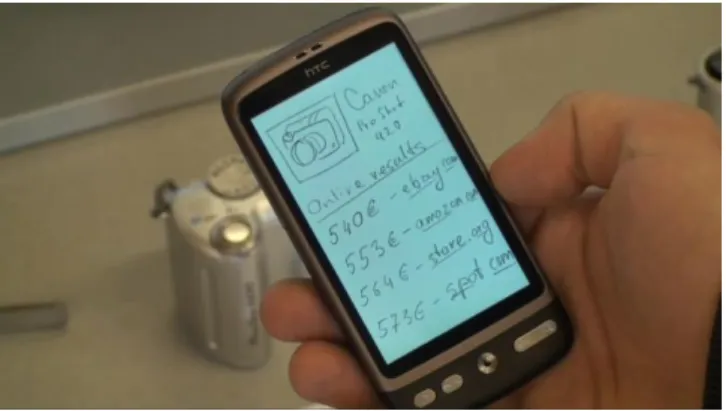
Instead of filming actual use of the Goggles application which would not be repre-sentative of video prototypes, a mockup was reverse-engineered to give the impres-sion of the application still being in the conceptual phase of design. The prototype consisted in a website showing hand-drawn figures simulating the Goggles applica-tion and the results it returns during operaapplica-tion (see figure 2 for an impression). As the pages` figures were loaded on a website actors could simulate interaction: clicking on a drawn button in the video gives the impression of going from one screen to another. The video thus created can be described as a low-fidelity video-prototype; higher fidelity would mean that the more visually refined graphics would be used for filming which would be not very distinguishable on the video from the actual application. We note here that earlier studies suggest that high and low representations in video proto-types yield trigger similar feedback by viewers regarding user acceptance of the con-cept and also regarding how critical their comments are over the concon-cept shown [2].
2.6 Analysis Method
Data from the first five participants in each group was analyzed qualitatively to identi-fy potential patterns characterizing the two testing procedures. The comments made in the semi-structured interview from these sessions were annotated and transcribed on sticky notes. These were then clustered inductively according to common
2
http://www.vimeo.com/36969549
Fig. 2. Screenshot from the reverse-engineered video-prototype of Google GogglesTM. The prototype combined an actual phone with drawn sketches of the user-interface. This increased the feeling that the application was not actually developed yet.
tics into an affinity diagram by a team of five researchers who continued structuring the diagram and moving sticky-notes, creating, combining or removing groups until consensus was reached. Based on the resulting groups in the affinity diagram the fol-lowing expectations were formulated:
E1. Participants who use the product give more comments on the interface. E2. Viewers of the video prototype make more comments on the context of use E3. Participants will provide a similar number of comments as to when and where they will use the application
E4. Viewers of the video prototype suggest more new features E5. Participants who use the product suggest more improvements
The data from the first coding session was not used after this. The interviews from the remaining participants were transcribed in full and then chunked into 242 coherent comments (e.g., “it was very intuitive”, or “at the moment I don`t see it as a useful tool, more as a fun application”, or “I think the product tries to make life too easy”). These chunks were matched to the expectations by two observers working inde-pendently of each other. The inter-rater reliability for the raters was found to be Kap-pa = 0.60 (p < .0.001), 95% CI (0.508, 0.688). This is “moderate agreement” [5]. Chunks (on sticky notes) where the observers disagreed were discarded, as well as all chunks that could not be matched to any of the above expectations.
The data from the questionnaires was processed and analyzed statistically. A two independent sample non parametric test (Mann-Whitney U) was used to compare the scores of the two groups on the four factors of the AttrakDiff questionnaire. One par-ticipant in the video group indicated having had prior experience with Google Gog-glesTM. This participant was excluded from the results. Another four participants did not fill in all the questions on the form and were therefore also excluded. This left thirteen participants in the “Product group” and twelve in the “Video group”. Because the hypotheses were not directional, tests were “two-tailed”.
3
Results
3.1 Qualitative Results
We summarize below the qualitative data (excluding the 5 first participants per group), providing also indications of the size of different clusters. Table 1 shows a brief summary of how the total numbers of comments produced were classified.
Only one comment could be tied to E1, which makes it impossible to draw any conclusions.
E2 was partially corroborated by the directed content analysis. There were 21 chunks from the product group and only 14 from the video group which fits our ex-pectations, but many of these referred to the same issue. Participants in the test and viewers of the prototype identified a similar number of unique remarks regarding context (7 in the product group and 6 in the video group) and the nature of the com-ments they made about it was very similar as well.
Both groups made almost the same amount of comments concerning the expected use of the application, which confirms our expectations (E3). The product group (3 comments) and the video group (4 comments). While the number of comments was similar, the video group`s comments related to future use are overall more positive than the ones made by the product group. This could reflect the difference between idealized operation by an expert user on the video versus actually attempting to oper-ate the application first hand.
Contrary to our expectations (E4) the video group did not come up with more new features compared to the product group. The two groups produced a similar amount of suggestions (5 in product group, 6 in video group). In addition, the type of features that were suggested was similar (such as ‘scanning buildings’ or ‘getting allergy in-formation’).
The slight difference between the numbers of suggested improvements by applica-tion group compared to the video group confirmed E5 (5 comments in the product group versus 3 in the video group). There is also a difference in the type of comments: the product group is more in-depth, they talk about usability issues in speed, capture results, text editing, button placement, etc. Comments from the video group are broader, such as “it should give other information as well, besides the painter”.
3.2 Quantitative Results
Results showed no statistically significant difference between the groups on the factors Pragmatic Quality, Attractiveness, and HQ. As these are multi-dimensional constructs we, examine potential differences in the subscales they consist of.
A significant difference between the two groups was found on the factor “Hedonic Quality (HQ) Identity”. HQ Identity consists of items such as ‘professional’, ‘stylish’ and ‘presentable’. The sum of ranks for the `Product group’ was significantly higher
Table 1. The number of comments that could be matched, after directed content analysis and after removing cases of disagreement between coders, for each expectation per group.
Expectation Product Group Video Group
1 1 0
2 7 6
3 3 4
4 5 6
than the sum of the ‘Video group’ (15.96 vs. 9.79, p<0.05). This can be explained by the low visual refinement of the application as shown on the video.
HQ Stimulation consists of items like ‘creative’, ‘captivating’ and ‘challenging’. The participants who used the actual application scored higher on this factor (one-tailed t-test, p<0.05). However, this difference was not hypothesized a priori, so it has to be confirmed in future studies. In hindsight, this is a result that should have been predicted. Stimulation seems like a quality one would mainly experience when using the application and not when only watching a video of someone else using it.
For the UTAUT four factors were examined: Performance expectancy, Effort ex-pectancy, Attitude towards using technology and Behavioral intention to use the sys-tem. A two independent sample non parametric test (Mann-Whitney U) found no significant difference between the two groups for any of these factors.
4
Discussion
Video prototyping is a useful prototyping tool for exploring design ideas, and in this study it was shown that overall, using a video prototype for evaluation has led to prac-tically the same insights as a user test with an actual product. This is quite a positive result, since making a video prototype is far cheaper and less time consuming than building a fully working prototype.
Comments concerning context appeared more pronounced in reaction to a video prototype than in actual use. Presumably this is because the specific video highlighted contextual aspects of use rather than filming usage out of context. Good video proto-types are likely to follow a similar practice using spaces and props to provide an idea of how users experience a product in their physical and social environment. However no strong claims can be made regarding the superiority of video prototyping as the unique issues identified were practically the same for the two groups.
Our results suggest that detailed design improvements are more likely to be identi-fied by usability testing. Presumably this is because participants in the video-group were shown a film of a non-functional system where every scan and image based retrieval operation was shown to work immediately and impeccably. We should em-phasize that while video prototyping is good for evaluating the overall design concept and direction, it is no substitute for testing a prototype with high refinement regarding functionality and data access. Still, in this case it did help identify numerous useful suggestions on improving the product. Given that it can be produced at a fraction of the cost, video prototyping is confirmed as a useful technique for early in the design process.
In comparison of the answers participants gave in the questionnaires regarding ac-ceptance and the overall user experience there were also no significant differences found on all subscales (except for ‘Hedonic Quality’ for which further corroboration is needed by future research). This seems to be in agreement with earlier research [3], where variations on the refinement of the prototype shown on video did not impact the overall appreciation of the concept. The current study suggests that this extends to
comparisons with actual product use and in reference also to feature suggestions, context of use, and expected use.
Related research [7] has found that there can be an interaction effect between dif-ferent user groups (based on demographics, knowledge, etc.) and the prototyping medium with regards to the feedback obtained by users. It would be interesting to extend this comparison to other kinds of systems, and to different user groups. This study’s user group was relatively familiar with the medium (smart phones); it would be interesting to check whether these results can be reproduced in cases where test-participants are very unfamiliar with the tested technology, requiring a lot more from their imagination and empathy to envision situations of use by watching a video.
Overall this study suggests that video prototypes help obtain feedback from users that is quite similar to that gathered when user testing the final product. Of course the study has examined only one application and its presentation as a video prototype; to generalize our conclusions one would have to reproduce these results for different applications and videos. Nevertheless, the fact though that no major differences are found does have face validity; it is exactly the intent of a prototype (be it on video or not) to capture what is essential from the design concept in a way that will solicit valid feedback by users. Detailed comparisons such as the one presented can inform us regarding the appropriateness of different prototyping media for different evalua-tion aims.
5
References
1. Bardram, J., Bossen, C., Lykke-Olesen, A., Nielsen, R., Madsen, K. H. Virtual video pro-totyping of pervasive healthcare systems. In: Proceedings DIS 2002 (2002), 167–177. 2. Bojic, M., Goulati, A., Szostak, D., Markopoulos, P. (2011, October). On the effect of
vis-ual refinement upon user feedback in the context of video prototyping. In Proceedings of the 29th ACM international conference on Design of communication (pp. 115-118). ACM.On the effect of visual refinement upon user feedback in the context of video proto-typing. Proceedings SIG DOC 2011, ACM, (2011) 115–118
3. Diefenbach, S., Hassenzahl, M., Eckoldt, K., Laschke, M. The impact of concept (re)presentation on users’ evaluation and perception. Proceedings NordiCHI 2010, (New York, NY, USA, 2010), 631–634.
4. Hassenzahl, M. Burmester, M., Koller, F. AttrakDiff: Ein Fragebogen zur Messung wahrgenommener hedonischer und pragmatischer Qualität. Mensch & Computer (2003), 187–196.
5. Landis, J.R., Koch, G.G. An application of hierarchical kappa-type statistics in the assess-ment of majority agreeassess-ment among multiple observers. Biometrics. (1977), 363–374. 6. Mackay, W.E., Ratzer, A.V, Janecek, P. Video artifacts for design: bridging the Gap
be-tween abstraction and detail. Proceedings DIS 2000, ACM (2000), 72–82
7. Sellen, K. M., Massimi, M. A., Lottridge, D. M., Truong, K. N., Bittle, S. A. The people-prototype problem: understanding the interaction between people-prototype format and user group. In Proceedings CHI 2009, ACM, New York, (2009) 635-638.
8. Venkatesh, V., Morris, M. G., Davis, G. B., Davis, F. D. User acceptance of information technology: Toward a unified view. MIS quarterly. (2003), 425–478.