Impact of Microcredit on Selected Livelihood Assets of Rural
Households: The Case of Shebedino District Omo Microfinance
Institution, Sidama Zone of Southern Ethiopia
Abera Alemu (Main author)
School of Environment, Gender and Development studies
Rural Development and Agricultural Extension Program, Hawassa University, Ethiopia PO box 05, Hawassa, Ethiopia
Dr. Tewodros Tefera (Co author)
School of Environment, Gender and Development studies
Agribusiness and Value Chain Management Program, Hawassa University, Ethiopia, PO box 05, Hawassa, Ethiopia
Workalemahu Tasewu (Co author)
School of Environment, Gender and Development studies
Agribusiness and Value Chain Management Program, Hawassa University, Ethiopia PO box 05, Hawassa, Ethiopia
Abstract
Microfinance institutions provide different financial services for the poor, where microcredit is one of its major services. The main objective of this study was to identify the impact of microcredit on selected livelihood assets of microcredit participant households. Both primary and secondary data were collected and used for this study. The primary data were collected from randomly selected 110 microcredit participant households who have at least three years of participation status in Omo Microfinance Institution and 120 non-participant households who hadn’t ever accessed loan from Omo Microfinance Institution. Secondary data were collected from review of different related literatures. Both descriptive and inferential statistics were used to analyze the collected data. The result of descriptive statistics showed that, microcredit participants use loan for different livelihood activities, such as financing agricultural activities, food preparation and sell, cloth trading, supply of local construction material (Atena), shop keeping and petty trade. Fear of risk of default, interest rate, transaction cost related with accessing loan, repayment policy, compulsory saving and group lending approach were the main factors affecting microcredit participation in the study area. The result of PSM analysis indicated that microcredit participation has a positive and significant impact on average annual income, saving, physical asset and children schooling of households. The sensitivity analysis result showed that the impact results estimated by this study are insensitive to unobserved selection bias. Therefore, Omo Microfinance Institution, other governmental and nongovernmental organizations should expand access of credit to rural households in poverty reduction strategies.
Keywords: Impact, Livelihood Assets, Microcredit, Omo Microfinance Institution, PSM 1. Introduction
Microfinance industry which comprises services such as microcredit, micro-insurance, micro-savings and money transfers has grown to become one of the major development programs in the world (Rooyen et al., 2012). Among many services of microfinance institutions, microcredit provision is the key one. It is considered by many practitioners and advocates being a powerful tool to alleviate poverty (Elizabeth, 2012). It affects the livelihood of clients in multiple ways. The most frequently reported types of impact of credit at individual, enterprise and household level are: income and saving improvement, expenditure smoothing, poverty alleviation impact, business growth impact, employment impact, schooling and health impact and asset building impact (Vaessen et al., 2010)
It is in the rural areas where the largest number of poor and destitute people is found in many developing countries (Shimelles et al., 2009). To improve the livelihood of those poor, different countries implemented the provision of microfinance services mainly microcredit for both agricultural and non-agricultural activities that take place among poor households. In 2014, there were 31 licensed micro finance institutions operating in Ethiopia where most of them have evolved either from the credit component of the governments or NGOs credit scheme (Bekele and Dereje, 2014). In the study area, currently there are two microfinance institutions operating: Omo Microfinance and Sidama Microfinance Institutions. Both institutions provide financial services mainly microcredit and saving for both rural and urban areas (DOFED, 2015).
of their clients and on the communities in which they live (Alexander, 2011). In study area, Omo Microfinance Institution has been operational since 1997. The stated purpose of the institution operation is to fill the financial gap of the poor by delivering different financial services particularly microcredit there by to improve their livelihood. According to the institution report of 2014, the number of borrowers as well as the amount of loan distributed to the clients is increasing from year to year. For example, in year 2010, about 1,151,180 Birr was distributed to 330 rural households. In year 2011, the number of borrower was increased to 501 with loan size of 2, 000,000 Birr. For consecutive three years from 2014 to 2016, about 2101 households have been served with loan size of 14, 272,800 Birr.
In the study area, different researchers (e.g. Jembere, 2009; Befekadu, 2012; Zenebe, 2014) conducted studies on role of microfinance on rural households in different perspectives as well as on the participation of households in saving and credit cooperatives. These all studies didn’t address the impact brought by use of credit on the study area. Even though the amount of loan distributed to the clients is increasing from time to time and hence large, the impact of microcredit on livelihood assets of rural households is not yet well studied in the area. Therefore, the main motivation behind this study was to explore whether microcredit service in the study area is making positive change on selected livelihood assets of the clients or not
1.1 Objective of the study General objective
The general objective of this study was to assess the impact of microcredit on selected livelihood assets. The specific objectives include
1. to examine the purpose of microcredit utilization by rural households
2. to evaluate the impact of microcredit on financial and physical building of rural households 3. to identify factors affecting participation of rural households in microcredit programme 2. MATERIALS AND METHODS
2.1 Description of the study area
Shebedino District is found in Sidama Zone, Southern Nation Nationalities and Peoples Regional State. It is located at 300 km far from Addis Ababa, capital city of the Ethiopia. There are two agro climatic zones in the study area which is Woyina Dega (84.4%) and Dega (15.6%). Annual range of temperature varies from 16 oc to
25oc. Annual range of rainfall also varies from 800mm to 1600 mm (DOFED, 2015). The study District has a
total area of 276.9sq.km. As per CSA data of 2007 census, the District has an estimated total population of 233,922. From these, 118,026 are male and 115,896 are female. The total households of the study area are 37,152. The District comprises 35 Kebele administrations. Among these, three of them are urban Kebeles and 32 of them are rural Kebeles (WOFED, 2015).
2.2 Study Design
The research design for this particular study was quasi-experimental with treatment group (microcredit participant households) and control group (non-participant households).
2.3 Sampling Techniques
To determine the sample for this study, multistage sampling method was employed. In the first stage, the study District was selected purposively because there was high number of borrowers in the institution. In the second stage, four Kebeles were selected randomly from 32 microcredit user kebeles. In the third stage, within four selected Kebeles, households were stratified into two strata (participant and non-participant in microcredit programme). The households which included in the participant stratum were those who had at least three years participation status in Omo Microfinance Institution and those who hadn’t participate in microcredit programme constituted non-participant stratum. To identify sample size for the study, rule of thumb suggested by Green (1991) was followed. He suggests that, n≥50+8m (where n is sample size of the study and m is a number of independent variables). From this, the sample size for this study should be greater than or equal to 122 as there were nine identified independent variables. Based on this, 230 households (110 microcredit participants and 120 non-participants) were determined as a sample size of the study. The main reason for this was to get enough number of matches that enables to give generalization on research objective. To determine respective samples
2.5 Data Analysis
Based on objectives of the study, both descriptive and inferential statistics were used to analyze the collected data. Independent t-test was used to compare the mean difference of continuous independent variables between micro credit users and non-users. Besides, chi square test was also conducted to see the association of independent variable with dependent variable. Propensity Score Matching (PSM) econometric model was applied to net out the impact of microcredit on the outcome variables of the study.
3. Results and Discussions
This section presents four main discussions. The first deals with characteristics of sampled household with respect to independent variables of the study, the second one deals with assessment on purpose of loan, the third one evaluates impact of microcredit on financial and physical asset of the households and finally the last one presents factors affecting participation of households in microcredit program.
3.1 Characteristics of Sampled Households
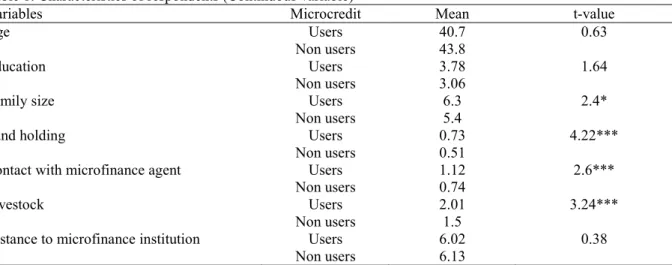
From Table 1 below, it is revealed that the mean age of microcredit participant group was 40.7 and it was 43.8 for non-user group. Age has no influence on the participation of microcredit. The mean educational attainment of microcredit users and non-users was found to be 3.78 and 3.06 years respectively. Family size was 6.3 and 5.4 respectively for microcredit user group and non-user group where the t-test analysis shows the significant influence of the variable on the microcredit participation at less than 10% significance level. Land holding of the microcredit user and non-user group was 0.73 and 0.51 hectares respectively which was significant at less than 1% significance level indicating the influence of variable on the participation of microcredit program. It was found that microcredit users made contact with Omo microfinance agent 1.12 times per month while the non-users contact 0.74 times which has no significant influence on the microcredit use. The livestock holding of the microcredit user group was 2.01 and 1.5 for non-user group in tropical unit which was significant at less than 1% significance level verifying its influence on the participation of microcredit program. Microcredit users have to travel 6.02 km to access credit from Omo microfinance institution while microcredit non-users have to travel 6.13 km to access credit from the institution. The difference was not significant suggesting that it has no influence on microcredit use.
Table 1: Characteristics of respondents (Continuous variable)
Variables Microcredit Mean t-value
Age Users 40.7 0.63
Non users 43.8
Education Users 3.78 1.64
Non users 3.06
Family size Users 6.3 2.4*
Non users 5.4
Land holding Users 0.73 4.22***
Non users 0.51
Contact with microfinance agent Users 1.12 2.6***
Non users 0.74
Livestock Users 2.01 3.24***
Non users 1.5
Distance to microfinance institution Users 6.02 0.38
Non users 6.13
Source: Own computation * and *** means significant at less than 10% and 1% respectively
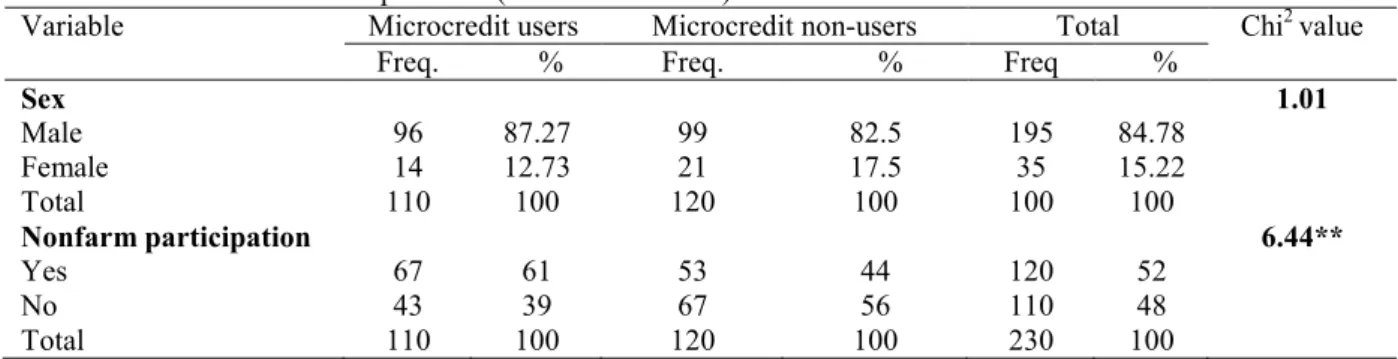
The results of descriptive statistics analysis show from total sampled households, 84.78 % of them were found to be male headed households while the rest 15.22% of them were female headed households. The result of chi2 analysis shows that there was statistically significant effect of non-farm participation on microcredit
participation at less than 5% significance level. Of the total sampled households, 52% of them were participant in non-farm livelihood activities while 48% of them have no participation in these activities. It was found that sex of the respondent household head have no influence on the participation of microcredit in the study area.
Table 2: Characteristics of respondents (Discrete variables)
Variable Microcredit users Microcredit non-users Total Chi2 value
Freq. % Freq. % Freq %
Sex 1.01 Male 96 87.27 99 82.5 195 84.78 Female 14 12.73 21 17.5 35 15.22 Total 110 100 120 100 100 100 Nonfarm participation 6.44** Yes 67 61 53 44 120 52 No 43 39 67 56 110 48 Total 110 100 120 100 230 100
Source: Own computation *** means significant at less than 1% 3.2 Purpose of loan
It was found that, to improve their livelihood, clients use credit for different purposes. Accordingly, 60% of the microcredit participant households were engaged in financing agricultural activities. The finding presented on Table 3 revealed that, 12.73% of respondent accessed loan for the purpose of trading cloth. Moreover, 10.9% of them accessed loan for the purpose of shop keeping, that enable them to earn income to improve their livelihood. Similarly, 9.09%, 4.55%, and 2.73% of sampled microcredit participants utilized credit for petty trade, food preparation and sell and supply of local construction material (Atena) respectively.
Table 3: Purpose of loan
Purpose of loan Frequency (%)
Financing agricultural activities 66 (60%)
Food preparation and sell 5 (4.55%)
Cloth trading 14 (12.73%)
Supply of local construction material (Atena) 3 (2.73%)
Petty trade 10 (9.02%)
Shop keeping 12 (10.09%)
Total 110(100%)
Source: Own computation 3.3 Econometric Analysis
This section describes econometric analysis which was followed to identify the impact of microcredit on financial and physical asset building of households. It explains the estimation of propensity scores, defining common support region, choosing matching algorism, testing matching quality, calculating average treatment effect on treated and sensitivity analysis.
3.3.1 Estimation of propensity score
The study has applied logit model to estimate the propensity score for matching microcredit participant households with non-participant households. Before running logit model, the existence of multicollinearity among independent variables was tested using Variance Inflation Factor (VIF) and contingency coefficient (CC) between continuous and discrete variables respectively. The result of both tests revealed that, there was no serious multicollinearity problem. As a result, no any variables were dropped from the model. Furthermore, problem of heteroscedasticity was tested by using Breusch-Pagen test. This test resulted in the existence of heteroscedasticity problem as it was significant at 1% probability level (0.0001) suggesting the need for standard error robust. Hence, robust standard error was conducted accordingly. As presented on Table 4 the value of pseudo R2 shows that the allocation of programme has been fairly random and both groups do not have diverse
characteristics overall so that obtaining a good match between participant and non participant household becomes easier (Caliendo and Kopeinig, 2008).
The maximum likelihood estimate of the logistic regression model output shows that program participation status has been significantly influenced by six variables. Land size and household head participation in nonfarm activities influences participation in microcredit positively at 1% significance level. This may imply that
cover family costs associated with health, consumption and school expenditures. Household who made more contact with Omo microfinance agent have more information on service, rules and other issues of Omo microfinance institution than others.
It was found that age of household head influence participation in microcredit programme negatively at 5% significance level. As the household age increases they accumulate more assets that enable them not to seek credit. Coupled with this, the chances of older people being considered for credit by lending institution are low due to the low probability of success and high risk of default. The result also shows livestock ownership of the household influences participation in microcredit positively at 10% significance level. Households who owned large number of livestock is considered as safe client by lending institution and borrowers themselves are more confident in accessing loan from the institution. During group formation members prefer to be together with household who have large number of livestock. In case, if they become defaulter, they can pay back their loan by selling out their livestock.
Table 4: Logistic regression results of household participation in microcredit programme
MCPART Coefficient Robust Std.Err. Z
SX 0.0758638 0.4417384 0.17 HHAGE -0.0475554** 0.0200098 -2.38 FMLSZ 0.207037** 0.0821808 2.52 SCLYEAR 0.064694 0.047612 1.36 CONOMOFR 0.3449893** 0.146429 2.36 LANSZ 1.860615*** 0.568103 3.28 NONFARM 1.015565*** 0.3192146 3.18 TLU 0.2305462* 0.1314704 1.75 DISINSTKM -0.0189083 0.0691266 -0.27 Number of obs 230 LRChi2 (9) 52.09 Prob > Chi2 0.00 Log likelihood -133.16081 Pseudo R2 0.1636
Source: Own computation ***, **and * level of significance at %, 5% and 10% respectively. 3.3.2 Identifying common support region
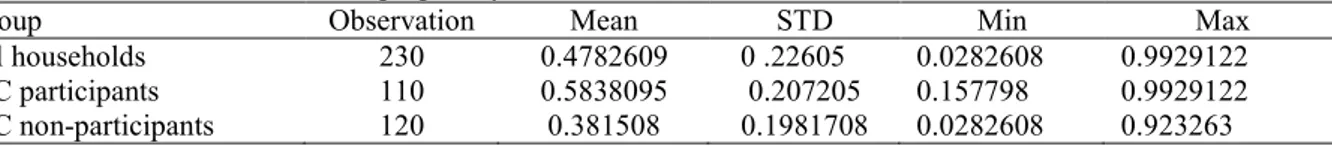
The propensity scores vary between 0.157798-0.9929122 for microcredit participants with mean score of 0.58. Whereas the score vary between 0.0282608-0.923263 for non-participant household with mean score of 0.38. The common support then lies between 0.157798-0.923263. This means that household whose propensity score less than minimum (0.157798) and larger than maximum (0.923263) are not considered for matching purpose. Based on this procedure, 24 households (10 households from microcredit participant group and 14 households from non- participant group were discarded from the study in impact assessment procedure.
Table 5: Distribution of estimated propensity score of households
Group Observation Mean STD Min Max
All households 230 0.4782609 0 .22605 0.0282608 0.9929122
MC participants 110 0.5838095 0.207205 0.157798 0.9929122
MC non-participants 120 0.381508 0.1981708 0.0282608 0.923263 Source: Own computation
3.3.3 Matching microcredit participant with non participant household
Different matching algorisms were tried in matching microcredit participant with non-participant households in common support region. The final choice of matching algorism was guided by three criteria: namely equal mean test (balancing test), pseudo R2 and size of matched sample. Matching algorism which balances all explanatory
variables of groups (result in insignificant mean differences between both groups), bear low pseudo R2 value and
results in large sample size is preferable (Deheja and Wahba, 2002). Based on those criteria, nearest neighborhood 3 was found to be best estimator for this study. Therefore, impact analysis procedure was followed and discussed by using nearest neighbor of neighborhood 3.
Table 6: Performance criteria of matching algorisms
Matching Algorisms Performance criteria
Balancing test* Pseudo-R2 Matched sample size Nearest Neighbor 1 Neighbor 8 0.025 206 2 Neighbor 9 0.014 206 3 Neighbor 9 0.010 206 4 Neighbor 9 0.015 206 5 Neighbor 9 0.019 206 Caliper 0.01 9 0.023 186 0.1 8 0.025 206 0.25 8 0.025 206 0.5 8 0.025 206 Radius 0.01 7 0.089 206 0.1 7 0.089 206 0.25 7 0.089 206 0.5 7 0.089 206 Kernel 0.01 9 0.020 186 0.1 9 0.013 206 0.25 9 0.013 206 0.5 8 0.046 206
Source: Own computation
3.4.4 Testing of balance of propensity score and covariates
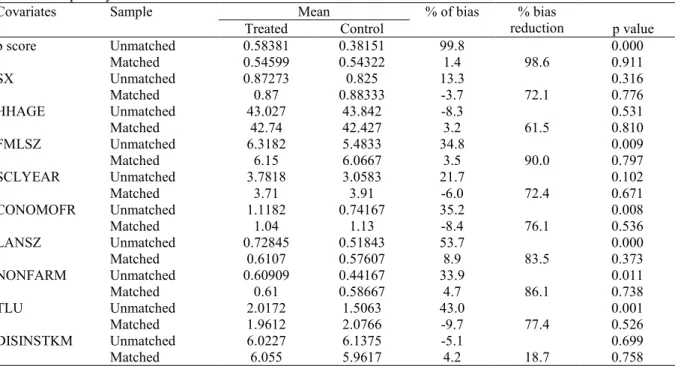
After selecting best performing matching algorism which satisfies prior identified performance criteria, balance of propensity score and explanatory variables was checked by the selected matching algorism (nearest neighbor of neighborhood 3 in this case). Table 4 below shows that the standard bias difference between explanatory variables before matching was in the range of 5.1%-53.7% in absolute value. But after matching, the remaining standardized error differences between explanatory variables lay between 3.2 %-9.7% in absolute value which is below the critical level of 20% suggested by Rosenbaum and Rubin (1983).
It is clear that the main intention of estimating propensity score is not to get a precise prediction of selection into treatment. Rather, to balance the distributions of relevant variables in both groups (Caliendo and Kopeinig, 2008). Therefore, the selected matching algorism, nearest neighbor of neighborhood 3, has created a covariate balance between microcredit participant and non-participant households, which is important to conduct impact analysis.
Table 7: Propensity score and covariate balance test
Covariates Sample Mean % of bias % bias
reduction
Treated Control p value
p score Unmatched 0.58381 0.38151 99.8 0.000 Matched 0.54599 0.54322 1.4 98.6 0.911 SX Unmatched 0.87273 0.825 13.3 0.316 Matched 0.87 0.88333 -3.7 72.1 0.776 HHAGE Unmatched 43.027 43.842 -8.3 0.531 Matched 42.74 42.427 3.2 61.5 0.810 FMLSZ Unmatched 6.3182 5.4833 34.8 0.009 Matched 6.15 6.0667 3.5 90.0 0.797 SCLYEAR Unmatched 3.7818 3.0583 21.7 0.102 Matched 3.71 3.91 -6.0 72.4 0.671 CONOMOFR Unmatched 1.1182 0.74167 35.2 0.008 Matched 1.04 1.13 -8.4 76.1 0.536 LANSZ Unmatched 0.72845 0.51843 53.7 0.000
As indicated on Table 8 below, the value of pseudo-R2 was very low. This low pseudo-R2 value and the
insignificant likelihood ratio test indicate that microcredit participant households and non-participant households had the same distribution in the covariates after matching. These results indicate that the matching procedure is able to balance the characteristics in the treated and the matched comparison groups. Hence, these results can be used to assess the impact of microcredit among groups of households having similar observed characteristics. This enables to compare observed outcomes for microcredit participant with those of a non-participant group sharing a common support.
Table 8: Chi-square test for the joint significance of variables
Sample Pseudo R2 LR chi2 p>chi2
Unmatched 0.165 52.39 0.000
Matched 0.010 2.68 0.988
Source: Own computation
All of the above tests suggest that the matching algorithm chosen was relatively best for the data of this study. Therefore, it was possible to proceed to estimate the average treatment effect on the treated (ATT) for the sample households.
3.3.5 Average treatment effect on the treated
This section provides evidence as to whether or not the microcredit has brought significant changes on financial and physical asset of participant households. Annual household income and saving amount were considered as indicator of financial asset of households; whereas productive and non-productive assets of household valued in Ethiopian birr was considered as indicator of physical asset of the households. After controlling for other characteristics, the propensity score matching model using the nearest neighborhood three indicate that participating in microcredit of Omo Microfinance Institution service has brought significant and positive impact on annual average income of households. Microcredit participant got an average of 6764.10 Birr per year than non-participant households. This finding agrees with Hussain and Shahidur (2014), Bekele and Dereje (2014), Rooyen et al., (2012) and Hossain (2012). The average amount of annual saving was higher for microcredit participant than non-participant households. The positive value of ATT shows that microcredit borrowers save annually 2082.54 Birr as compared with their counterpart, which is statistically significant at 1% significance level. Accordingly, it was found that microcredit has brought positive impact on financial asset building of a borrower.
Table 9: Average treatment effect on the treated
Outcome variables Treated Controls Difference p-value
Annual income 13933.2 7169.1 6764.10 0.000***
Annual saving 2132.14 49.6 2082.54 0.000***
Physical asset 48454.2 31853.53 16600.67 0.000***
Own computation *** significance at less than1%
Moreover it was found that microcredit has brought significant impact on physical assets of household valued 16600.67 Birr which was significant at 1% of statistical significance level. This is consistence with the study conducted by Abdullah et al, (2011) and Paul, (2014). These studies concluded that use of microcredit build physical asset of households.
3.3.6 Sensitivity analysis
Deciding which variables should be included in a statistical model is one of the unsolved and probably most debatable issues in observational study (Caliendo and Kopeinig, 2005). It is, of course, well known that relevant but omitted variables cause bias in outcome of intervention. The standard response to this knowledge has been to include additional control variables under the belief that the inclusion of every additional variable serves to reduce the potential threat from omitted variable bias. However, reality is more complicated, and the control variable strategy does not protect from omitted variable bias (Kevin A., 2006). To reduce this problem, sensitivity analysis has great advantage (Caliendo and Kopeinig, 2008). In order to check for unobservable biases, sensitivity analysis was performed on the computed outcome variables using Rosenbaum Bounding approach with respect to deviation from the conditional independence assumption. The basic question to be answered here is whether inference about treatment effects may be affected by unobserved factors (hidden bias). Table 10 presents the critical level of eγ=1 (first row), over which the causal inference of significant microcredit
participation outcomes (impact) must be questioned. The first column of the table shows those outcome variables which bear statistical differences between microcredit participant and non-participant households in impact estimate. The rest of the values which correspond to each row of the significant outcome variables are p-critical values (or the upper bound of Wilcox on significance level -Sig+) at different critical value of eγ. The results
show that inference for the impact of microcredit does not change, even though the participant and non-participant households were allowed to differ in their odds of being treated up to 200% (eγ=2) in terms of
unobserved covariates. That means for all outcome variables estimated, at various level of critical value of eγ, the p- critical values are significant which further indicate that the study has considered important covariates that
affected both participation and outcome variables. Thus, it is possible to conclude that impact estimates (ATT) of this study for each outcome variables was insensitive to unobserved selection bias.
Table 10: Result of sensitivity analysis using Rosenbaum bounding approach
Outcomes eγ=1 eγ=1.25 eγ=1.5 eγ=1.75 eγ=2.0
Annual household income 2.0e-14 1.6e-11 1.4e-09 3.3e-08 3.7e-07 Annual saving amount 1.1e-16 9.7e-14 1.3e-11 4.2e-10 5.8e-09
Physical assets 8.2e-13 4.2e-10 2.7e-08 5.3e-07 4.9e-06
Education expense 0.000011 0.00047 0.005123 0.025085 0.074853 Note: e (Gamma) = log odds of differential due to unobserved factors where Wilcoxon significance level for
each significant outcome variable is calculated Source: Own computation
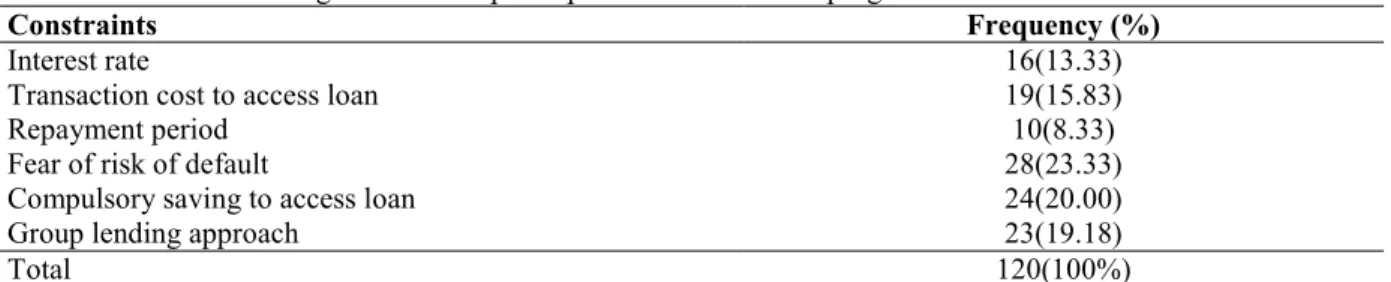
3.4 Constraints affecting microcredit participation
About 23.33% of respondents reported that they didn’t access loan because they fear risk associated with loan default. A study conducted by Asante et al., (2013) in Ghana is consistence with the finding of this study. Among non- participant respondents, 20% of them identified that compulsory saving is the main constraint factor that hinder them in accessing loan from Omo microfinance institution. Besides above constraints, 19.18% of respondents responded that group lending approach as constraint that hinder them to access loan from Omo microfinance institution while 18.53% of them responded that high transaction cost in accessing loan is the main constraint. This may indicate that respondents fear disadvantages that arise as a result of receiving loan in group lending approach, including missing next opportunity of loan if one becomes defaulter from group members, it may arise disagreement in idea and distrust on group members, etc. The issue related with high transaction cost may indicate that it takes a long time for respondents to access loan from Omo microfinance institution due to inefficiency of the institution. Similarly, 13.3% and 8.33% of respondents reported that interest rate imposed by microcredit on loan and repayment period are the main constraints that hinder them not to access loan from Omo microfinance institution respectively.
Table 11: Factors affecting households’ participation in microcredit programme
Constraints Frequency (%)
Interest rate 16(13.33)
Transaction cost to access loan 19(15.83)
Repayment period 10(8.33)
Fear of risk of default 28(23.33)
Compulsory saving to access loan 24(20.00)
Group lending approach 23(19.18)
Total 120(100%)
Source: Own computation
4. Conclusions and Recommendations
This study assessed the impact of microcredit on financial and physical asset building of microcredit participant household using propensity score matching method. In the study area majority of households use credit for financing agricultural activities which indicate that still agriculture is the main source of employment for the microcredit user households. The econometric result revealed that participation in microcredit was significantly influenced by age of household head, family size, land size, household heads participation in nonfarm activities, contact with Omo Microfinance Agent and livestock ownership. The PSM result indicates that microcredit has brought positive impact on financial and physical asset of household. Interest rate, transaction cost to access loan, repayment policy, fear of risk of default, compulsory saving to access loan and group lending approach were the main problems affecting participation of rural households in microcredit program
In line with the findings of study, the following recommendations were forwarded.
The empirical result reveals that participation in microcredit has statistically significant and positive impact on annual household income, saving, physical assets and children schooling which motivates non-participant households to participate and earn more income. Therefore, Omo Microfinance Institution, other governmental
Level of interest rate, transaction cost in accessing loan, lending and repayment policy were other constraint that have been hindered households from benefits of microcredit. Therefore, Omo microfinance institution should revise the policy on interest rate, lending procedure and repayment (amount and frequency) in way that households can access loan. Besides, Omo Microfinance Institution should deliver loan timely and within short period of time up on the request and interest of borrowers.
References
Abdullah- Al- Mamun, C. A. Malarvizhi, Sazali Abdul Wahab and Mohammad Nurul Huda Mazumder, 2011. Investigating the Effect of the Utilization of Microcredit on Hardcore Poor Clients Household Income and Assets. Published by Canadian Center of Science and Education, 7, 141-152.
Alexander Ferka, 2011.The Impact of Microfinance on the Livelihoods of Women in Rural Communities: A Case Study of Jaman South District, Ghana.
Asante A., Jonathan M., and Manfred Z., 2013. Determinants of Farmers Participation and Credit Constraints in Agricultural Finance Programs: Evidence from Nkoranza Districts of Ghana.
Befekadu Tekalng, 2012.Impact of Supervised Enterprise Projects on Sericulture technology Diffusion among Rural Households: The Case of Shebedino and LemoDistricts, Southern Ethiopia. M.Sc. Thesis Submitted to Haramaya University.
Caliendo M., Kopeinig S., 2005. Some Practical Guidance for the Implementation of Propensity Score Matching, IZA Discussion Paper No. 1588, DIW Berlin and IZA Bonn, and University of Cologne.
Caliendo M., Kopeinig S., 2008. Some practical guidance for the implementation of propensity score matching. IZA Discussion Paper No. 1588, University of Cologne.
Dehejia, R. H. and Wahba, S. 2002. Propensity Score Matching Methods for Non- Experimental Causal Studies: The Reviewof Economics and Statistics, Vol. 84, No.1, 151–161.
Elizabeth Schroeder, 2012. The Impact of Microcredit Borrowing on Household Consumption in Bangladesh; pp 1.
Green, S. B. 1991. How many subjects does it take to do a regression analysis? Multivariate Behavioral Research, 26, 499 510.‐
Hossain, M. K. ,2012. Measuring the Impact of BRAC Microfinance Operations: A Case Study of a Village.J. Int. Bus. Res. 5(4).
Hussain A., Samad and Shahidur R. Khandker, 2014. Dynamic Effects of Microcredit in Bangladesh:Policy Research Working Paper, 6821.
Jembere B., 2009. Participation of women in rural saving and credit cooperatives: a case of Shebedino District, Sidama zone, southern Ethiopia, M.Sc. Thesis, Wageningen University.
Jos Vaessen, Frans L. Leeuw, Sara Bonilla, Ana Rivas, Ruslan Lukach, Johan Bastianensen and Nathalie Holvoet, 2010. The effect of microcredit on women’s control over household spending in developing countries.
Kevin A. Clarke, 2006. Practical Sensitivity Analysis.
Paul J. Salia, 2014. The Effect of Microcredit on the Household Welfare (Empirical Evidences from Women Micro-entrepreneurs in Tanzania).International Journal of Academic Research in Business and Social Sciences, 2222-6990.
Rosembaum, P.R. and D.B. Rubin, 1983. The Central Role of the Propensity Score in Observational Studies for Causal Effects, Biometrika, 70 (1): 41-55.
Shimelles T, Zahidul IKM, Tuulikki P, 2009.Effects of land tenure and property rights on agricultural productivity in Ethiopia, Namibia and Bangladesh. Discussion Papers No 33. University of Helsinki, Department of Economics and Management.
DOFED (District Office of Finance and Economic Development), 2015.Annual report, Shebedino,Leku. SDOMFI (Shebedino District Omo Microfinance Institution), 2014. Annual report, Shebedino ,Leku.
Van Rooyen C., Stewart R. and De Wet T., 2012. The Impact of Microfinance in Sub Saharan Africa: A Systematic Review of the Evidence. World Development, 40, 2249-2262.
Zenebe Geremew, 2014. The role of Sidama microfinance in the empowerment of rural women: A case of ShebedinoDistrictSidama zone, SNNPR. Msc Thesis, Hawassa University.