A
NALYZING
F
INANCIAL
R
EPORTS
Antonina Kloptchenko
Turku Centre for Computer Science & IAMSR
Åbo Akademi University
[email protected]
Tomas Eklund
Turku Centre for Computer Science & IAMSR
Åbo Akademi University
[email protected]
Barbro Back
Turku Centre for Computer Science & IAMSR
Åbo Akademi University
[email protected]
Jonas Karlsson
IAMSR/Åbo Akademi University
[email protected]
Hannu Vanharanta
Pori School of Technology and Economics
[email protected]
Ari Visa
Tampere University of Technology
Department of Information Technology
[email protected]
Abstract
There is a vast amount of financial information on companies’ financial performance available to investors today. While automatic analysis of financial figures is common, it has been difficult to automatically extract meaning from the textual part of financial reports. The textual part of an annual report contains richer information than the financial ratios. In this paper, we combine data mining methods for analyzing quantitative and qualitative data from financial reports, in order to see if the textual part of the report contains some indication about future financial performance. The quantitative analysis has been performed using self-organizing maps, and the qualitative analysis using prototype-matching text clustering. The analysis is performed on the quarterly reports of three leading companies in the telecommunications sector.
Keywords: elf-organizing map, text mining, annual reports, prototype-matching clustering
Introduction
A huge amount of electronic information concerning companies’ financial performance is available in databases and on the Internet today. This information is potentially very valuable to companies’ decision makers, their partners, competitors, and stakeholders. The important task for them is to extract relevant information for decision-making purposes from the available data storages on time and, preferably, by the click of a mouse button. Data mining methods for discovering hidden patterns in data aim to offer this opportunity.
We use data and text mining methods to study hidden indications about the future financial performance of companies from the quantitative and qualitative parts of their annual/quarterly financial reports. Annual/quarterly reports are one of the most important external documents that reflect on companies’ strategy and the financial performance. Annual reports are an important medium for the company’s communication with its investing public.
This research continues and builds on the work of Visa et al. (1999, 2000), and Back et al. (1998, 2001). In this paper, we carry out text investigation in combination with the study of companies’ financial ratios. It is believed that text bears more diverse information than dry numbers do. Here we perform clustering of quantitative data in the form of financial ratios using the Self-Organizing Map (SOM), and clustering of qualitative data in the form of the textual part of quarterly reports using a prototype-matching approach. We discovered that annual/quarterly reports tend to state information about company’s past performance, but also contain indications of its future performance, i.e. the tables with financial numbers indicate how well company has performed, while the linguistic structure and written style of the text may tell you what a company will do.
We begin our explanation by providing a short overview of studies relating to analyzing financial reports. Then, we provide a description of the methodology for quantitative financial data clustering and the choice of appropriate financial ratios. Next, we propose a text analysis method. We then relate quantitative and qualitative analysis by reviewing an example of using both for analysis of telecommunications companies’ performance. As a sample data set, we have chosen quarterly reports from the leaders in the telecommunications sector: Ericsson, Motorola, and Nokia, from the years 2000-2001. We review the results and their evaluation. Finally, we highlight a number of issues for further investigation.
Background
Neural networks, in the form of self-organizing maps, provide a good tool for clustering and visualization of large amounts of numeric information. An early example of the application of neural networks for financial analysis is the study by Martín-del-Brío & Serrano-Cinca (1993). Martín-del-Brío & Serrano-Cinca used self-organizing neural networks to study the financial state of Spanish companies, and to attempt to predict bankruptcies among Spanish banks during the 1977-85 banking crisis. The authors found the SOM to be a “very interesting tool for financial decision making”.
Back et al. (1998) compared 120 companies in the international forest products industry. The study was based on standardized financial statements for the years 1985-89. The objective of the study was to investigate the potential of using self-organizing maps in the process of analyzing large amounts of quantitative financial data. The results of the study indicate that self-organizing maps could be feasible tools for processing vast amounts of financial data.
Several studies have been made on the relationship between the readability of the annual reports and the financial performance of a company (Subramanian et al, 1993). As research has shown, the annual reports of the companies that performed well were easier to read than those of companies that did not perform well. Moreover, writers of annual reports see the message they put in the report as their personal representation (Winsor, 1993). A close look at the language structure in the letters to stockholders made in (Thomas, 1997) showed that the structure of the financial reports might reveal some things that the company may not wish to announce directly to its outside audience. Another conclusion of this study was the confirmation of the Pollyanna Hypothesis that earlier had an intuitive character. It states that regardless of the financial state of the company, the language in the annual letters will be predominantly positive. The annual reports are not only the best possible description of a company, but are also a description of a company’s managerial priorities. Thus, communication strategies hidden in annual reports differ in terms of the subjects emphasized when the company’s performance worsens (Kohut and Segars, 1992).
One of the first attempts to semi-automatically analyze a company’s performance, by examining quantitative and qualitative information from annual reports, was made in the study (Back et al., 2001). Their results indicated that there are differences in qualitative and quantitative data clustering results due to a slight tendency to exaggerate the performance in the text. A conclusion of the research was a proposition: “an experiment with putting in a lag and analyzing whether the text corresponds better to the next year’s numerical data would also be interesting”. We decided to continue the research in combining data and text mining techniques for financial analysis, using an improved document clustering method, and a different hypothesis and data set.
Methodology
Our methodology section builds on two steps in order to analyze two types of data: quantitative and qualitative (Back et al., 2001). We use the SOM clustering ability (Kohonen, 1997) for financial benchmarking of financial quantitative data. We use the prototype-matching text clustering methodology proposed by Visa et al. 2001 for qualitative data analysis.
Financial Data Clustering
Self-Organizing Maps
The SOM technique creates a two-dimensional map from n-dimensional input data. This map resembles a landscape in which it is possible to identify borders that define different clusters (Kohonen 1997). These clusters consist of input variables with similar characteristics.
The methodology used when applying the self-organizing map is as follows (Back et al., 1998). Firstly, the data material is chosen. It is often advisable to pre-process the input data so that the learning task of the network becomes easier (Kohonen, 1997). Next, the network topology, learning rate, and neighborhood radius are chosen. Thirdly, the network is constructed by showing the input data to the network iteratively using the same input vector many times, the so-called training length. The process ends when the average quantization error is small enough. Finally, the best map is chosen for further analysis, and the clusters are identified using the U-matrix, and interpreted (assigned labels) using the feature planes. From the feature planes we can read per input variable per neuron the value of the variable associated with each neuron.
The network topology refers to the form of the lattice. There are two commonly used lattices, rectangular and hexagonal. In a rectangular lattice a node has four neighbors, while in a hexagonal lattice, it has six. This makes the hexagonal lattice preferable for visualization purposes (Kohonen, 1997). The learning rate refers to how much the winning input data vector affects the surrounding network. The neighborhood radius refers to how much of the surrounding network is affected. The average quantization error indicates the average distance between the best matching units and the input data vectors. Generally speaking, a lower quantization error indicates a better-trained map.
To visualize the final self-organizing map we use the unified distance matrix method (U-matrix). The U-matrix method can be used to discover otherwise invisible relationships in a high-dimensional data space. It also makes it possible to classify data sets into clusters of similar values. Feature planes (Figure 1), representing the values in a single vector column, are used to identify the characteristics of these clusters.
Choice of Data and Information
In Karlsson et al. (2001a, 2001b), data in the form of companies’ annual reports was collected, primarily through the Internet. For the study, a SOM was created for the years 1995-99, and the different clusters on the map were isolated and analyzed. In this study, the same map has been used to study the performance of three leading international telecommunications manufacturers during four quarters of the year 2000, and during the first three quarters of 2001.
Thus, the dataset was collected from seven quarterly reports for three telecommunications manufacturers: Nokia, Ericsson, and Motorola. The dataset consists of both quantitative and qualitative data. The quantitative data consist of a number of calculated financial ratios, and the qualitative data of the textual discussion from each report.
Choice of Financial Ratios
In order to make the quantitative data comparable, financial ratios had to be calculated. The selection of relevant financial ratios was based on an empirical study by Lehtinen (1996), in which international accounting differences were analyzed in greater detail, especially concerning the reliability and validity of the ratios. Seven financial ratios, which fulfilled the criteria of good validity and reliability, were selected and calculated for each of the companies. The key ratios can be divided into four different classes:
profitability ratios, liquidity ratios, solvency ratios and efficiency ratios. It is common to choose ratios that measure different aspects of financial behavior. The emphasis in the study was on profitability, and therefore, three profitability ratios were selected;
Operating Margin, Return on Total Assets (ROTA) and Return on Equity (ROE). One liquidity ratio, Current Ratio, was used. The solvency of the companies was measured using the ratios Equity to Capital and Interest Coverage. Finally, Receivables Turnover was chosen to measure the efficiency of the companies.
Pre-processing of the Quantitative Data
In order to ease the learning process of the SOM, the data have to be pre-processed. In addition to cleaning the data, this also implies standardization. The choice of standardization method is a very tricky issue, since it is very important for the outcome of the map. In this experiment, we standardized the data by scaling the variables according to the variance.
1http://www.weibull.com/LifeDataWeb/the_weibull_distribution.htm.
In addition, a limit was placed on the extreme values, as is recommended by among others (Johnson and Wichern, 1997). This was because the network was initially placing too much emphasis on extreme values. The result was a flat map with one region of extreme values. In this case, the limits were set at –50 respectively 50.
Prototype-Matching Text Clustering
We have used the methodology for text prototype matching to create the textual clusters. The clusters contain the reports that are the closest in meaning to a chosen prototype report. The methodology is based on textual collection preprocessing, i.e. word and sentence level processing. We transform every word into a number, taking into account word length in ASCII symbols, and the ASCII value of every character in a word. We encode every text document by creating a common word histogram for the entire text collection, choosing a suitable cumulative distribution. We chose the Weibull distribution,1 since it is a versatile distribution
that can take on the characteristics of other types of distributions, based on the value of the shape parameter. In the training phase we divide the best fitted Weibull distribution into a number of logarithmically equal bins, the number of which is equal to the number of all words in the text collection. Each word after quantization is presented as a bin number and the values of the best-fitted Weibull distribution. Thus, we have performed text quantization on a word level, by creating a common word histogram for the entire text collection. The most common words in the text gain a dense resolution in the histogram bins.
We perform similar procedures for converting every word into a bin number on the sentence level, in order to present the whole sentence as a vector. Hereafter, we consider the Fourier transformed encoded sentences as input vectors. After converting every sentence into a number, we create a cumulative distribution in the same way as on the word level. We divide the distribution into logarithmically equal bins, the number of which is equal to the number of all sentences in the text collection. We count the frequency of sentences belonging to each bin. We find the best-fitted Weibull distribution based on the cumulative distribution of the coded sentences and their scalar quantization to equally distributed bins.
In the next phase, we construct individual sentence and word histograms for each document in the collection according to the documents’ word and sentence code numbers and the corresponding value of quantization (Toivonen et al., 2001). Having sentence and word level histograms allows us to compare documents to each other simply by calculating the Euclidian distances between their histograms. The smallest Euclidian distance between word histograms indicates a common vocabulary of the reports. The smallest Euclidian distance between sentence histograms indicates similarities in written style and/or content of the reports (Visa et al., 2001).
Results
Quantitative Data Analysis
The map was created using SOM_PAK, a SOM training software package developed at the Helsinki University of Technology (Kohonen et al., 1996). The U-matrix map is visualized using the software Nenet v1.1a. The trained map from Karlsson et al. (2001a) was also used in the experiment, and the relevant data were mapped on to this existing map. The training parameters for the map are illustrated in Table 1.
Training length of first part: 5,000 Training length of second part: 50,000 Neighborhood radius of first part: 9 Radius of second part: 0.02 Learning rate of first part: 0.05 Training rate of second part: 1
9 × 6 Network size:
Table 1. The Used Training Parameters
Defining the Clusters
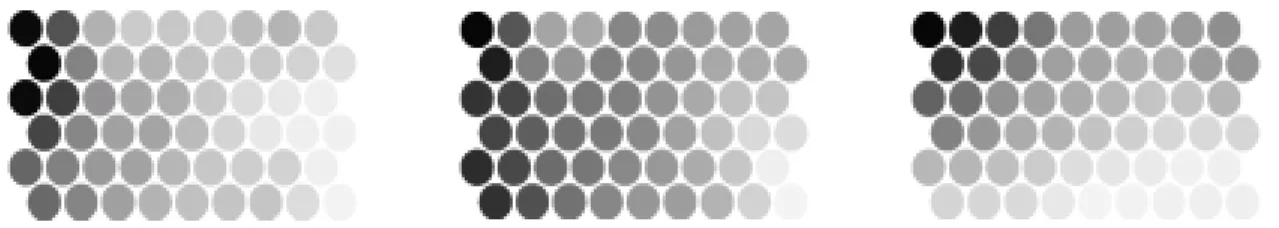
By carefully analyzing the output map, six major clusters of companies were identified. To identify the clusters we used both the U-matrix map and the individual feature planes. Figure 1 shows examples of the feature plane maps, in this case for the ratios Operating Margin, ROTA and Equity to Capital. High values are indicated by lighter shades, and lower values by darker shades. By analyzing the shades of the borders between the hexagons on the U-matrix map, it is possible to find similarities as well as differences. Furthermore, the values of the neurons have been evaluated in order to determine that the clusters are correct. The identified clusters are presented in Figure 2, in the form of a U-matrix map.
Group A1 and Group A2 represent the best-in-class companies. For the companies situated in subgroup A1, profitability is very
good, with very high values in the financial ratios Operating Margin, ROTA, and ROE. Solvency is decent, i.e. the values of the Equity to Capital ratio and the Interest Coverage ratio vary from good to average. Group A2 is the second subgroup of the best
in class group. The companies situated in this group are characterized by slightly lower profitability than Group A1, but instead,
liquidity and solvency are much better. These companies generally have the best values in Current Ratio on the map.
Group B is where the companies with slightly poorer performance than those in Group A1 and A2 are situated. These companies
are distinguished by good profitability, and particularly ROE values are excellent. These companies also have somewhat poorer liquidity and solvency than the companies in Group A.
Group C1 is the better of two subgroups in Group C. In this group, companies possess decent profitability, good liquidity, and also
good values in Equity to Capital. Group C2 is the slightly poorer of the two middle groups. These companies have decent
profitability, but poor liquidity. Interest Coverage and Receivables Turnover are also poor, but Equity to Capital, on the other hand, is very good.
Group D is the poorest group. The companies with poor financial performance can be found in this group. Distinguishing features are poor profitability and solvency. Liquidity is average, and Receivables Turnover varies from very good to poor.
Analysis
The map that we have analyzed in this report (Figure 2) consists of the three most important manufacturers of telecommunications equipment in the world: Nokia, Ericsson and Motorola.
Nokia moves very little during the first six studied quarters, remaining in Group A1. The values in the financial ratios are on
almost the same level as they have been for the past six years, although a small decrease can be noted for the last quarters. Nokia performs superbly during the entire experiment. In the third quarter 2001, however, Nokia moves out of the best group, entering Group C2. This is a result of Nokia making a one-time charge of EUR 714 million to cover Nokia Networks receivables related
to a defaulted financing to Telsim, a cellular operator in Turkey, and to the insolvency of Dolphin in the UK.
Ericsson’s performance differs considerably from Nokia’s. During the first and third quarters of 2000, Ericsson is situated in
Group B, the same group as for the past six years. The second quarter was particularly good for Ericsson, and the company moves into Group A1. During this quarter Ericsson shows significantly increased values in the financial ratios, actually amongst their
best performance during the past six years. In the fourth quarter Ericsson begins to experience difficulties, backtracking into Group C1. This is mainly due to decreased profitability and solvency. In 2001, Ericsson experiences severe difficulties on the
telecommunication market; almost all key ratios show decreased values during the first quarter, and Ericsson drops within Group C1, ending up close to Group D. In the second quarter 2001, results are very poor, and terrible profitability and solvency places
Ericsson in the poorest group, Group D. The only category that improves during this period is liquidity. In the third quarter 2001, the negative result is slightly smaller, and Ericsson manages to accomplish a minor improvement in the key ratios. However, the
Ericsson_00.1 Ericsson_00.3 Ericsson_00.2 Ericsson_00.4 Ericsson_01.1 Ericsson_01.2 Ericsson_01.3 Motorola_00.1 Motorola_00.2 Motorola_00.3 Motorola_00.4 Motorola_01.1 Motorola_01.3 Motorola_01.2 Nokia_00.1 Nokia_00.2 Nokia_00.3 Nokia_00.4 Nokia_01.1 Nokia_01.2 Nokia_01.3
Figure 2. The Identified Clusters and the Quarterly Movements of Ericsson, Motorola, and Nokia
Motorola performs consistently during the first three quarters of 2000, remaining situated in the same neuron within Group C1,
very close to Group A1. Similarly to Ericsson, Motorola shows signs of worsening performance during the fourth quarter 2000,
backtracking into Group C2. The largest change can be found in the ROTA, ROE and Interest Coverage ratios. In the first quarter
2001, Motorola drops even further within Group C2, ending up very close to Group D. In the second quarter, Motorola drops into
Group D. During the third quarter profitability is even poorer, resulting in a decrease in three of the financial ratios. This results in a small movement within Group D. Motorola experienced a negative net income during the three first quarters in 2001, while Ericsson only experienced a negative net income during the second and third quarter. However, both companies show very similar movements and the future does not look too bright.
Qualitative Data Analysis
All the reports were processed according to the procedures described in the Methodology section. In other words, we encoded every word from the reports, and constructed a common word histogram. We then encoded each sentence from the reports and constructed a common sentence histogram, and a unique sentence histogram for every report. We present the results from qualitative data clustering for Nokia, Ericsson and Motorola in Table 3. Each column in Table 3 contains the prototype-report in the header and the four closest matches. The bold letters by the report codes denote the cluster from the quantitative clustering that a particular report belongs to. We highlighted the reports from Motorola 2001, quarter 3 for reasons stated later.
Table 3. The Closest Matches to Every Report in the Collection (Sentence Level)
Ericsson2000Q1 B Ericsson2000Q2 A1 Ericsson2000Q3 B Ericsson2000Q4 C1 Ericsson2001Q1C1 Ericsson2001Q2 D Ericsson2001Q3 D
Nokia2000Q1 A1 Ericsson2000Q3 B Ericsson2000Q4 C1 Ericsson2000Q3 B Ericsson2001Q2 D Nokia2001Q3 C2 Ericsson2001Q1 C1
Nokia2000Q3 A1 Nokia2000Q2 A1 Motorola2001Q3 D Motorola2001Q2 C2 Ericsson2001Q3 D Ericsson2001Q1 C1 Ericsson2001Q2 D
Motorola2001Q3 D Ericsson2000Q1 B Ericsson2000Q2 A1 Motorola2001Q3 D Nokia2001Q3 C1 Ericsson2001Q3 D Nokia2001Q3 C2
Motorola2001Q2 C2 Ericsson2000Q4 C1 Ericsson2000Q1 B Nokia2000Q1 A1 Motorola2001Q3 D Nokia2001Q1 A1 Nokia2001Q2 A1
Motorola2000Q2C1 Motorola2000Q3C1 Motorola2000Q4C2Motorola2001Q1C2 Motorola2001Q2 D Motorola2001Q3 D
Motorola2001Q3 D Ericsson2001Q2 D Motorola2001Q3 D Motorola2000Q2 C2 Ericsson2000Q4 C1 Motorola2000Q2 C1
Motorola2001Q2 D Nokia2000Q2 A1 Nokia2000Q4 A1 Motorola2001Q2 C1 Motorola2001Q3 D Nokia2000Q1 A1
Nokia2000Q2 A1 Nokia2000Q1 A1 Nokia2000Q1 A1 Nokia2001Q2 A1 Motorola2000Q2 C1 Nokia2001Q3 C2
Nokia2000Q4 A1 Nokia2001Q3 C2 Ericsson2001Q2 D Nokia2001Q3 C2 Ericsson2000Q1 B Ericsson2000Q1 B
Nokia2000Q1 A1 Nokia2000Q2 A1 Nokia2000Q3 A1 Nokia2000Q4 A1 Nokia2001Q1 A1 Nokia2001Q2 A1 Nokia2001Q3 C2
Ericsson2000Q1 B Nokia2001Q2 A1 Nokia2001Q3 C2 Nokia2001Q1 A1 Ericsson2000Q1 B Nokia2000Q2 A1 Ericsson2001Q2 B
Motorola2001Q3 D Motorola2001Q3 D Ericsson2000Q1 B Ericsson2000Q1 B Nokia2000Q4 A1 Nokia2001Q3 C2 Nokia2000Q3 A1
Nokia2000Q2 A1 Nokia2000Q1 A1 Motorola2001Q2 C1 Motorola2001Q3 D Ericsson2001Q2 D Motorola2000Q2 C1 Motorola2001Q3 D
In order to obtain these results, we match every quarterly report against the entire data collection. We compare all of the quarterly reports in our data collection by calculating the Euclidian distance between their sentence histograms. For example, for the Ericsson report from 2000, quarter 1, the closest report by content on the sentence level is from Nokia, 2000, quarter 1. The second closest is the report form Nokia, 2000, quarter 3. This means that the Nokia reports from 2000, quarters 1 and 3 and the Ericsson report from 2000, quarter 1 have similarities in sentence construction and word choice, which constitutes the language structure and written style. Word choice has a smaller impact on the clustering results than the sentence construction, since quarter names and proper names, e.g. Nokia, Motorola or Ericsson, did not determine the clusters.
Combining Quantitative and Qualitative Analysis
Nokia performed well over the analyzed period of time. Its performance remained excellent and almost unchanged over six of
the analyzed periods. Only during the last analyzed quarter did the financial performance decrease. The closest matches for the first 4 quarters were from Groups A-B, and later on from Group C1 (excluding the report by Motorola in 2001, quarter 3, which
has some linguistic peculiarities). The closest matches from Group D started to occur two quarters before the financial downturn actually happened.
Ericsson indicated the whole range of financial performance, moving from a good group to the best and, finally, to the worst
financial group. Ericsson had made upturn and downturn movements over the analyzed period of time. The first indications of worsening performance occurred in the third analyzed quarter, when reports stating poor financial performance started to fire as the closest matches. Even though Ericsson performed at the average level, and was in Group C1 in the first quarter of 2001, 3 out
of the 4 closest matches were from Group D.
Consistently, Motorola had performed poorly over the whole analyzed period, moving slowly from group C1 to D. The reports
from the companies with the poorest performance started to appear as the closest matches to the Motorola reports in the second and third quarters of 2000 in anticipation of worsening performance in the forth quarter of 2000, when Motorola ended up in group C2. Most of the reports that had fired as the closest matches to the Motorola reports in the first two quarters of 2001 were from
companies from groups C2 and D. This indicated the financial downturn in the third quarter of 2001.
After carefully reading the quarterly financial reports, and analyzing the qualitative and quantitative information in them, we uncovered a pattern in quarterly movements that was confirmed with existing domain knowledge from (Karlsson et al., 2001a, 2001b).
Analysis
Information gathered from all occurring matches in combination with quantitative data clustering makes it possible to conclude that our analysis schema has captured a tendency: the text reports tend to foresee the changes in financial states of the companies, before those changes influence the financial ratios. Roughly speaking, we notice that the reports from the well-performing companies (from Groups A1, A2, or B in the quantitative data analysis) in a current quarter have as their first closest match the
report from a company belonging to a cluster where the analyzed company will appear in the next quarter. We realize that the size of our data collection in the qualitative analysis is the biggest limitation to this conclusion. Ideally, we need to have in the data collection the reports from the past of the companies in order to identify indications of their future performance.
If a company reports a good steady performance over a certain period of time (from groups A1, A2, or B in the quantitative data
analysis) then we see the reports from companies with similar performance among the closest matches to the analyzed quarterly report, e.g. a report from Nokia 2000, quarter 1 as its closest match. When a company performs well, and expects to continue doing so, the tone of the report is positive with extensive use of optimistic vocabulary (increase, share growth, higher, our profitability, new, strong demand), active verbs (doing, not being), and clause constructions (operating margin, demand growth, increased share).
If a company reports abrupt worsening of its performance, we see more companies with poor performance (from Groups C2 or
D in the quantitative data analysis) among the closest matches one period before an actual financial downturn has occurred, e.g. reports from Nokia in 2001 quarter 2 and quarter 3 as the closest matches. The reports contain more conservative expressions (we expect, program efficiency), and nouns and verbs with negative financial connotations (decrease, slowdown, decline).
closest matches. The tone of financial report becomes less optimistic and more similar to ones that describe poorer performance. The style in the report becomes even more conservative (we have, announced, representing), using words and short sentence construction with particularly negative financial connotation (down, sales decline). The company avoids directly stating the accomplished results in its quarterly reports, instead shifting the subjects of emphasis in the report (sales segment, market share).
If a company reports average performance that does not change rapidly over time (from Groups C1, or C2 in the quantitative data
analysis), e.g. Motorola’s slow drop from average performance to poor performance, then we see companies with different financial performances among its closest matches. This indicates that a report has no distinctive style, or a sentence construction that might reflect uncertainty about the future of the company. It is notable that Motorola’s report from 2001, quarter 3, behaves in an interesting way. It has fired among four closest matches to 11 quarterly reports in our experiment. The tone of the Motorola’s report is very neutral and requires further linguistic analysis.
Conclusions
It was a desire to come up with a better scheme to provide a way of finding hidden indications about a company’s future financial movements that first motivated the work described in this paper. We specifically looked to benchmarking techniques based on SOM clustering that can classify and visualize the performance of the companies. Then, we analyzed the textual parts of quarterly reports for the same period of time, in order to reveal the heuristic relationship between the written style and facts stated by the numbers.
Our study showed that clusters from qualitative and quantitative analysis did not coincide. We explain the dissimilarities in clustering qualitative and quantitative data by the phenomena that exists in qualitative and quantitative parts of every quarterly/annual report. The quantitative part of a report only reflects the past performance of a company. At the same time, the qualitative part of a report holds some message about future company performance. We assume that the sophisticated semi-automatic analysis of the style of the financial report helps reveal insiders’ moods and anticipations about the future performance of their company. The tone of a written report tends to change some time before the actual financial changes occur.
The results that we have obtained after analyzing the qualitative and quantitative information from quarterly reports have proven that some future changes in financial performance can be anticipated by analyzing text from reports. Before a dramatic change occurs in company financial performance, we see a change in the written style of a financial report. The tone tends to be closer to the next company performance. If the company’s position will be worse during the next quarter, the report of the current quarter gets more pessimistic, even though the actual financial performance remains the same.
As the strongest limitation in our study we consider the small size of data collection in text clustering. The limited vocabulary (terms related to finance and the telecommunications sector), extensive use of proprietary names (such as Motorola, Nokia, and Ericsson), and indications of time period (quarter, year, annual), slightly influenced the clustering ability in our qualitative analysis. We plan to expand the study to a larger text collection.
Industrial analysts have methods to uncover the indications and hints about future financial performance of the company by reading their financial reports and making “professional guesses”. We tried to retrieve those hints semi-automatically and wish to continue this study by comparing our predictions from mining tools with predictions made by industry analysts.
Acknowledgements
The financial support from TEKES (grant number 40943/99) and the Academy of Finland is gratefully acknowledged. We are grateful to Jarmo Toivonen for his contributions at the earliest stages of the research.
References
Back, B., Sere, K., and Vanharanta, H. (1998). “Managing Complexity in Large Data Bases Using Self-Organizing Maps,” Accounting Management and Information Technologies (8), 1998, pp. 191-210.
Back, B., Toivonen, J., Vanharanta, H., and Visa, A. “Comparing numerical data and text information from annual reports using self-orginizing maps,” International Journal of Accounting Information Systems (2), 2001, pp. 249-269.
Johnson, R. A. and Wichern, D. W. Business Statistics: Decision Making with Data," John Wiley & Sons, Inc, 1997.
Karlsson, J., B. Back, H. Vanharanta, and A. Visa. Financial Benchmarking of Telecommunications Companies, Turku: Turku Centre for Computer Science, 2001a.
Karlsson, J., B. Back, H. Vanharanta, and A. Visa. Analysing Financial Performance with Quarterly Data Using Self-Organising Maps, Turku: Turku Centre for Computer Science, 2001b.
Kohonen, T., J. Hynninen, J. Kangas and J. Laaksonen. SOM_PAK: The Self-Organizing Map Program Package, Helsinki: Helsinki University of Technology, 1996.
Kohonen, T. Self-Orginizing Maps, Leipzig, Germany: Springer-Verlag, 1997.
Kohut, G., and Segars, A. “The president's letter to stockholders: An examination of corporate communication strategy,” Journal of Business Communcation (29:1), 1992, pp. 7-21.
Lehtinen, J. Financial Ratios in an International Comparison, Vasa: Acta Wasaensia, 1996.
Martín-del-Brío, B. and C. Serrano-Cinca. "Self-organizing Neural Networks for the Analysis and Representation of Data: Some Financial Cases," Neural Computing and Applications (1), 1993, pp. 193-206.
Subramanian, R., Isley, R., and Blackwell, R. “Performance and readability: A comparison of annual reports of profitable and unprofitable corporations,” Journal of Business Communcation (30), 1993, pp. 50-61.
Thomas, J. “Discourse in the Marketplace: The Making of Meaning in Annual Reports,” Journal of Business Communication (34), 1997, pp. 47-66.
Toivonen, J., Visa, A., Vesanen, T., Back, B., and Vanharanta, H. "Validation of Text Clustering Based on Document Contents," Machine Learning and Data Mining in Pattern Recognition (MLDM 2001), Leipzig, Germany: Springer-Verlag, 2001. Visa, A., Back, B., and Vanharanta, H. Toward Text Understanding - Comparison of Text Documents by Sentence Map. The
EUFIT'99, 7th European Congress on Intelligent Techniques and Soft Computing, Aachen: Germany, 1999.
Visa, A., Toivonen, J., Back, B., and Vanharanta, H. "Knowledge Discovery from Text Documents Based on Paragraph Maps," The HICSS-33, Hawaii International Conference on System Science, Maui, Hawaii, USA, 2000.
Visa, A., Toivonen, J., Vanharanta, H. and Back, B. "Prototype-matching - Finding Meaning in the Books of the Bible," Hawaii International Conference on System Science, HICSS-34, Maui, Hawaii, USA, 2001.