econ
stor
www.econstor.eu
Der Open-Access-Publikationsserver der ZBW – Leibniz-Informationszentrum Wirtschaft
The Open Access Publication Server of the ZBW – Leibniz Information Centre for Economics
Nutzungsbedingungen:
Die ZBW räumt Ihnen als Nutzerin/Nutzer das unentgeltliche, räumlich unbeschränkte und zeitlich auf die Dauer des Schutzrechts beschränkte einfache Recht ein, das ausgewählte Werk im Rahmen der unter
→ http://www.econstor.eu/dspace/Nutzungsbedingungen nachzulesenden vollständigen Nutzungsbedingungen zu vervielfältigen, mit denen die Nutzerin/der Nutzer sich durch die erste Nutzung einverstanden erklärt.
Terms of use:
The ZBW grants you, the user, the non-exclusive right to use the selected work free of charge, territorially unrestricted and within the time limit of the term of the property rights according to the terms specified at
→ http://www.econstor.eu/dspace/Nutzungsbedingungen By the first use of the selected work the user agrees and declares to comply with these terms of use.
zbw
Leibniz-Informationszentrum Wirtschaft Leibniz Information Centre for EconomicsRapp, Marc Steffen
Working Paper
Information asymmetries and the value-relevance of
cash flow and accounting figures: empirical analysis
and implications for managerial accounting
CEFS working paper series, No. 2010-08 Provided in cooperation with:
Technische Universität München
Suggested citation: Rapp, Marc Steffen (2010) : Information asymmetries and the value-relevance of cash flow and accounting figures: empirical analysis and
implications for managerial accounting, CEFS working paper series, No. 2010-08, http:// hdl.handle.net/10419/48420
I
NFORMATIONA
SYMMETRIES AND THEV
ALUE-R
ELEVANCE OFC
ASHF
LOW ANDA
CCOUNTINGF
IGURES–
E
MPIRICALA
NALYSIS ANDI
MPLICATIONS FORM
ANAGERIALA
CCOUNTING#Marc Steffen Rapp
Center for Entrepreneurial and Financial Studies (CEFS) TUM Business School – Technische Universität München
Email: msr@m-s-rapp.de
Version: April 2, 2010
Forthcoming in: Problems and Perspectives in Management, 2010, Issue 2
Abstract
While some of the modern performance measures used in managerial accounting rely on cash flow based figures others try to take advantage of the information content of accounting figures. However, whether the additional information content in the accrual components of earnings improves the internal performance measurement is an open empirical question. To shed light on this question, I examine the correlation between operating cash flows and earnings with firm’s total shareholder returns. Using fixed firm effects regression methods for a large sample of German listed firms covering some 5,000 firm years, the analysis shows that generally operating cash flow and earnings are both positively correlated with total shareholder return. However, with increasing information asymmetry earnings become less correlated with the firm’s stock market performance and operating cash flows dominate earnings in explaining total shareholder return (and vice versa). These results suggest that, the infor-mation content of accounting figures is only relevant in settings characterized by low inforinfor-mation asymmetries and, thus, there is no one-size-fits-all performance measure for managerial accounting purposes.
Keywords: Accounting figures, performance measures, total shareholder return, managerial accounting
# I am grateful for encouraging comments of Michael Wolff and valuable discussions with Bernhard
- 2 - 1. Introduction
Rappaport’s shareholder value approach claims that managerial decisions are to be judged against their effect on shareholder wealth, i.e. their impact on the firm’s stock market per-formance (e.g. Rappaport 1981, 1998). Adopting that view the (only) relevant performance measure for managerial accounting purposes is total shareholder return to be earned by in-vestments in the firm’s stocks. However, from the perspective of optimal incentive design us-ing total shareholder return (TSR) as a performance measure has a serious drawback, since it is well-known that a substantial part of the variation in TSR is due to exogenous events be-yond control of the management. Thus, although Rappaports shareholder value approach seems widely accepted today, there is an ongoing debate about appropriate internal perfor-mance measures to be taken to evaluate managerial decisions and to be used in managerial accounting.
From an agency perspective, optimal incentives rely on performance metrics that use i) vari-ables that are clearly aligned with the objectives of the firm (i.e. shareholder value) and ii) variables that measure the outcome of managerial decisions sufficiently well (e.g. Kaplan and Atkinson, 1998). In particular, there should be a direct link between managerial decisions and the performance variable. Now, many consulting firms have invented specific performance measures with the common goal to provide a metric that measures the outcome of manage-ment decisions, i.e. the firm’s operating performance, in such a way that internal mance as measured by the metric is highly correlated with the firm’s stock market perfor-mance.
While all these performance measures have a common goal, there is substantial heterogenei-ty with respect to their structure. For instance, there are on the one hand, cash flow based figures like Cash Value Added (CVA) promoted by the Boston Consulting Group and, on the other hand, accounting based figures like Economic Value Added (EVA), which is a trademark by Stern Stewart.1 From a general management perspective both performance metrics, i.e.
CVA and EVA, rely on a common premise: They are based on some measure of operating performance which is compared to the costs of the resources required to generate the per-formance. From an accounting perspective, however, CVA and EVA represent two polar
1 Boston consulting Group promotes a performance measure called CVA that is basically an extension of Cash
Flow Return on Investment (CFROI). Initially, Ottosson and Weissenrieder (1996) and Weissenrieder (1997) pioneered a slightly different performance measure that also relies on cash flows and is also called Cash Value Added. Young and O’Byrne (2001) discuss the performance measure EVA. McKinsey also promotes an accounting figure based performance measure called Economic Profit (EP). See Ryan and Trahan (1999, 2001), Claes (2008), Erasmus (2008), or Friedl and Kettenring (2009) for a general discussion of value-based performance measures.
approaches to measure operating performance: While CVA measures operating performance in terms of (operating) cash flows, EVA measures operating performance in terms of ac-counting profits. Thus, while CVA relies on cash flow based figures EVA tries to take ad-vantage of the information content of accounting figures. However, whether the additional information content in the accrual components of earnings improves the internal perfor-mance measurement is an open empirical question.2
To shed light on this question, I examine the correlation of operating cash flows and earnings with firm’s total shareholder returns. Using fixed firm effects regression methods for a large sample of German listed firms covering some 5,000 firm years, the analysis shows that gen-erally operating cash flow and earnings are both positively correlated with total shareholder return. However, with increasing information asymmetry earnings become less correlated with the firm’s stock market performance, and operating cash flow dominates earnings in explaining total shareholder return (and vice versa). These results suggest that from a mana-gerial accounting perspective the information content of financial accounting figures is only valuable in settings characterized by low information asymmetries and, thus, there is no one-size-fits-all performance measure for managerial accounting purposes.
The remainder of the paper is structured as follows: Section 2 develops the hypotheses and discusses the methodology used in the empirical analysis. Section 3 describes the data set and provides some descriptive statistics. Section 4 presents the empirical analysis and section 5 concludes.
2. Hypotheses and methodology
This section develops the hypotheses and introduces the methodology used in the empirical analysis.
2.1. Development of key hypotheses
The central problem examined in this study is the question whether the additional infor-mation content in the accrual components of earnings figures make earnings figures superior to cash flow figures in explaining a firm’s stock market return and thus whether accounting
2 This question becomes particularly interesting, if one notes that the information content of the accrual
compo-nent, although regulated by accounting standards, involves a high degree of subjectivity which has to be judged by the management itself (e.g. Dechow et al., 1995; Dechow, 1996; Sloan, 1996; Warfield et al., 1995).
figures represent the preferred starting point for a performance metric used in managerial accounting.3
A naïve person might argue that cash flow figures representing the periodical surplus of cash generated by a firm should be a good predictor of its stock market performance. This view, which is in parts supported by proponents of the discounted cash flow method of firm valuation, hypothesizes a positive correlation between a firm’s cash flow performance and its stock market performance.4
One might, however, argue that cash flows are a rather noisy signal of actual firm perfor-mance and add that accounting figures with their accrual component aim to provide addition-al information beyond the information provided by pure cash flow figures (e.g. Dechow, 1994).5 This fact is known as the informativeness of accounting figures and the central idea is
to evenly distribute (accounting) profits over a projects lifetime. With this idea in mind, the accountant might argue that accounting figures might outperform pure cash flow figures in explaining a firm’s stock market performance (see Ball and Brown (1968) or Dechow (1994) and
Vorstius (2004) for German evidence). This view is summarized in the following hypothesis:
Hypothesis 1: Accounting figures outperform pure cash flow figures in explaining a firm’s stock market performance.
While there might be good reasons to argue that in theory accounting figures might be supe-rior to cash flow figures in explaining a firm’s stock market performance, from a practical point of view there are several obstacles for this argument to stand an empirical test. The main impediments are information asymmetries between management and shareholders and various incentives for earnings management by executives (e.g. Sloan, 1996).6
3 There is a substantial amount of literature discussing value-based performance measures, e.g. Stewart (1994), Stern, Stewart and Chew (1995), Grant (1996), O’Byrne (1996), Chen and Dodd (1997, 2001), Biddle et al. (1997, 1999), Kleinman (1999), KPMG Consulting (1999), Ryan and Trahan (1999, 2007), Worthington and West (2001), Young and O’Byrne (2001), Keef and Roush (2002), Lovata and Costigan (2002), Athanassakos (2007). My study, however, differs
in that I focus on the empirical question whether the additional information embedded in the accrual component
of accounting earnings improve the alignment of accounting figures and a firm’s stock market performance and derives implications for the optimal design of (value-based) performance measures. See Pfaff (2004) for a discus-sion of the literature discussing the problem from a theoretical perspective.
4 See Koller et al. (2005) for a discussion of the discounted cash flow method.
5 The accrual component of accounting figures is the difference between accounting earnings and operating cash
flows (e.g. Dechow et al., 1995 or Sloan, 1996).
6 See Lev (1989), Dechow et al. (1995) and Dechow and Skinner (2000) for a general discussion of earnings
Keeping in mind the informativeness of accounting figures perspective, it seems reasonable to argue that with increasing information asymmetry, the additional information embedded in the accrual component becomes more value relevant. This view is summarized in the fol-lowing hypothesis:
Hypothesis 2.a: As information asymmetries increase, accounting figures become even more domi-nant in explaining a firm’s stock market return (compared to pure cash flow figures).
However, as information asymmetries increase incentives for opportunistic earnings man-agement will increase, since punishment of opportunistic behavior by outside shareholders is less likely (Günther et al., 2009). Accordingly, discretionary options embedded in the accru-al component of accounting figures become more vaccru-aluable for management, and from the perspective of shareholders, the information value of accruals fades away. This view is summarized in the following hypothesis:
Hypothesis 2.b: As information asymmetries increase, accounting figures become less relevant in explaining a firm’s stock market return (compared to pure cash flow figures).
Obviously, hypotheses 2.b represents a competing hypothesis to hypothesis 2.a and it re-mains an open empirical question which of the two will stand the test.
2.2. Methodology
To examine the above hypotheses I conduct an empirical analysis in which I regress a firm’s stock market performance on cash flow and accounting figures and various controls, i.e. I estimate a range of variants of the following empirical model:
Rit = αααα + ββββ1111 x EARit + ββββ2 x CFit + γγγγ1 x K1it + … + γγγγn x Knit + εεεεit (1)
where
Rit = stock market performance of firm i in year t,
EARit= (standardized) accounting earnings of firm i in year t,
K1it, …, Knit = various firm- and time-specific controls.7
Model (1) is a straight-forward generalization of the well-known value relevance models to study the informativeness of earnings figures (e.g. Warfiled et al., 1995; Pronobis et al., 2008 or
Günther et al., 2009), where instead of using EAR only, I use EAR and CF (simultaneously) as explanatory variables.
Value relevance studies generally are interested in the cross-sectional informativeness of earn-ings figures, and thus rely on (pooled) cross-sectional analyses. Instead I am interested in the firm-specific value relevance of a performance metric. Accordingly, I use panel data anal-yses, more specifically two-way fixed effects regression models with fixed firm- and year-effects.8 My firm-specific effects control for any (unobservable) firm heterogeneity either due
to the management style, its business model or even its accounting behavior (see Pronobis et al. (2008) for a similar approach). My period-specific effects control for any change in the overall valuation level in the stock market.
Moreover, note that value-relevance studies rarely use any controls in their analyses (e.g.
Warfiled et al., 1995 or Pronobis et al., 2008). However, there are numerous studies that show that there are various firm characteristics that might help to explain some variation in the firm’s stock market performance. For instance, Fama and French (1993) show that beside the classical CAPM β-coefficient, firm-size and market-to-book ratio add explanatory power when explaining a firm’s stock market performance. Thus, I estimate both a simple value-relevance specification
Rit = αααα + ββββ1111 x EARit + ββββ2 x CFit + εεεεit (2)
as well as an extended value-relevance specification
Rit = αααα + ββββ1111 x EARit + ββββ2 x CFit + γγγγ1 x BETAit + γγγγ2 x SIZEit + γγγγ3 x MTBit
+ γγγγ4 x ETPit + γγγγ5 x LEVit + γγγγ6 x DOMINATEDit + εεεεit (3)
where I follow Günther et al. (2009) and control for firm-risk (BETA), firm size (SIZE), valua-tion levels (market-to-book ratio MTB and earnings-to-price ratio ETP) and leverage (LEV). Moreover, I also control for differences in ownership structures (DOMINATED), since own-ership structures are often claimed to affect a firm’s stock market performance (e.g. Holder-ness, 2003).
7 Model (1) aims to explain a relative performance figure. Thus, I use relative figures as explanatory variables. I standardize my accounting earnings and cash flow figures by deflating them with total assets of the firm.
To test my key hypotheses I run a range of variants of the above specifications. While hy-pothesis 1 is easily analyzed by estimating variants of specifications (2) and (3) on all firms, testing the two polar hypotheses 2.a. and 2.b is much more difficult. In this study I adopt a straight-forward but rather simple two-step approach. In the first step, I define various dummy variables proxying information asymmetries and use each of these variables to split my sample into two subsamples. This procedure results in various pairs of subsamples, where one subsample is characterized by low information asymmetry and the other by high information asymmetry. In the second step, I estimate the extended value-relevance specifi-cation on each of the subsamples and compare the coefficients β1 and β2 as well as their
sta-tistical significance for each pair of subsamples.9
3. Data set and descriptive statistic
This section describes the data selection process, introduces the variables and provides some descriptive statistics.
3.1. Sample description and data sources
The sample is derived as follows: I start from all German firms listed in the EU-regulated
General Standard of Deutsche Börse AG, which is the dominant German stock exchange. The-se firms are the constituents of the broadest German stock index, called Composite DAX (CDAX). My sample period is from 1998 to 2008. This first step results in 885 firms and 9,735 possible firm year observations.
Then, I follow the standard approach of related studies and remove all financial firms from my sample, since their accounting behavior differs significantly. I use the Industry Classifica-tion Benchmark (ICB) classificaClassifica-tion of Dow Jones Indexes and FTSE as provided by Thomson ONE Banker to identify financial firms. This procedure results in 746 firms with 8,206 possi-ble firm year observations.
For these 746 firms I collect accounting data and stock price information from Thomson Worldscope and Datastream and ownership data from Thomson ONE Banker. This proce-dure results in a panel-data set in which I remove two sources of inconsistencies: First, I re-move all firm years, where the corresponding fiscal year has less than 300 calendar days or
9 Alternative econometric approaches are so-called stability tests like Chow’s breakpoint test. These methods are
not applied here, because their interpretation is not as straight-forward as the results of the approach adopted in here.
more than 400 calendar days, since it is unclear how to annualize the corresponding account-ing and cash flow figures.10 Second, I remove all firm years where the corresponding fiscal
year ends in the first six month of the calendar year, since more than one half of the operat-ing activities took place in the year before.11 The Table 1 below illustrates the sample
selec-tion procedure and the distribuselec-tion of firm year observaselec-tion with various levels of available data over time.
YEAR 1998 1999 2000 2001 2002 2003 2004 2005 2006 2007 2008 Total
# Firms 885 885 885 885 885 885 885 885 885 885 885 9,735
# Non-Financial Firms 746 746 746 746 746 746 746 746 746 746 746 8,206
# Non-Financial Firms
with TSR and regular fiscal year 290 357 459 532 485 461 440 434 429 435 424 4,746
# Non-Financial Firms with TSR, regular fiscal year and data on EAR and CF
280 337 422 502 469 442 425 423 420 429 416 4,565
# Non-Financial Firms with TSR, regular fiscal year, and data on EAR and CF as well as other controls
190 180 154 147 168 232 268 254 251 243 257 2,344
The table illustrates the sample selection procedure that starts from all German firms listed in the EU-regulated General Standard of Deutsche Börse AG at least once during the sample period from 1998 to 2008. In the analysis, I adopt the standard procedure and consider only non-financial firms. For these firms I collect accounting data and stock price information from Thomson Worldscope and Datastream and ownership data from Thomson ONE Banker. Finally, I remove non-regular fiscal years. Variables are explained in detail in Table 6 in the appendix.
Table 1: Sample description
3.2. Variable selection
In the analysis I use several variables which are explained below. All data are collected from Thomson databases (Worldscope, Datastream and ONE Banker).
Endogenous variables: The key endogenous variable in my analysis is total shareholder re-turn (TSR), which measures shareholder’s rere-turn from investment in the firm’s stock as the
10 This might either be the case when a) a firm changes its fiscal year end or b) there is a data problem in the
data-base.
sum of capital gains plus dividends of the stock. I measure TSR over a 12 month period start-ing four months after the beginnstart-ing of the correspondstart-ing fiscal year. Note that firms general-ly issue their annual report within two to four months after the end of the fiscal year.12 Thus,
the four-month-lag procedure, which is illustrated in Figure 1, allows the stock market to internalize accounting and cash flow information from the annual report.13
t0
(begin of fiscal year)
t0 + 4 month t1
(end of fiscal year)
t1 +4 month
Fiscal year
Period to measure TSR
The figure illustrates the four-month-lag procedure to calculate total shareholder return. The ap-proach allows investors to internalize all relevant earnings and cash flow information from annual reports released within two to four months after the end of the fiscal year.
Figure 1: Four-month-lag procedure tocalculate total shareholder return
In robustness tests I challenge my results by using three other endogenous variables. First, I use a second total shareholder return measure, which is calculated over a 12 month period, starting 5 months after the beginning of the corresponding fiscal year. Second, I use two ex-cess return measures calculated as total shareholder return (calculated based on the four-month-lag and five-four-month-lag procedure) minus the return of a buy-and-hold strategy in-vesting in the CDAX.
Exogenous variables: The central exogenous variables are cash flow and accounting perfor-mance. Cash flow performance is measured by operating cash flow. Accounting performance is measured by earnings before interest and taxes (EBIT). To estimate their impact on stock market performance, both performance measures are deflated by average total assets of the
12 While German law requires firms to issue annual reports within a four months period, the German code of
good governance (German Corporate Governance Code) recommends releasing the report within three months time.
13Warfield et al. (1995) use a three-month-lag approach for US firms. However, the release time for German firms
is slightly longer that for US firms. Accordingly, Günther et al. (2009) use a four month-lag approach and Pronobis et al. (2009) use even a five-month-lag approach.
firm in the corresponding firm year.14 The cash flow performance measure is denoted as CF,
the accounting measure as EAR.
Besides that, I use several other controls. Firm size (SIZE) is measured as logarithm of 1 plus total assets. To control for the current level of firm value, I use two variables: MTB measures the market-to-book ratio of equity and ETP measures the current earnings-to-price ratio. Since CF and EAR measure firm performance but TSR measures performance of an equity investment, I also use leverage (LEV) defined as total debt deflated by total assets as an addi-tional control. Finally, to account for heterogeneity in ownership structures, I define a dum-my variable DOMINATED, which takes the value 1 if the firm’s free float is lower than 50%.
Variables splitting the sample into subsamples: To examine the hypotheses 2.a and 2.b I de-fine four dummy variables that allow me to split the sample into subsamples. First, I dede-fine a dummy variable MCAP, which takes the value 1 if the firm has an above median market capitalization in the particular year. Second, I define dummy variable RND, which takes the value 1 if the firm has positive RnD expenditures in the particular year. Thirdly, I define a dummy variable INTANG, which takes the value 1 if the firm has an asset structure with an above median fraction of intangible assets in the particular year. Finally, I define DOMI-NATED as explained above. All four dummy variables proxy information asymmetries aris-ing from firm size and complexity as well as from external monitoraris-ing. Specifically, while the first three dummy variables aim to proxy firm size and complexity the forth variable proxies external monitoring.
3.3. Descriptive statistics
An analysis of the correlation of operating performance and shareholder returns must cover boom and recession phases (see Pronobis et al., 2008). As Figure 2 illustrates, my sample peri-od (1998 to 2008) covers both: the new economy boom phase as well as its burst and the boom phase 2004 to 2007, as well as the first part of the credit crises.
14 As usual, average total assets are calculated as the arithmetic mean of total assets at the beginning of the fiscal
0 100 200 300 400 500 600 700 800 Ja n -9 8 Ja n -9 9 Ja n -0 0 Ja n -0 1 Ja n -0 2 Ja n -0 3 Ja n -0 4 Ja n -0 5 Ja n -0 6 Ja n -0 7 Ja n -0 8 Ja n -0 9
The figure illustrates the development of the German CDAX index during the sample period. The index represents all German firms listed in the EU-regulated General Standard of Deutsche Börse AG the dominant German stock exchange.
Figure 2: Development of CDAX
0% 2% 4% 6% 8% 10% 12% 1998 2000 2002 2004 2006 2008
EAR (median) CF (median)
The figure illustrates the development of standardized accounting earnings EAR (calculated as EBIT deflated by average total assets) and standardized operating cash flow CFO (calculated as op-erating cash flow deflated by average total assets) measured in term of median values over all firms. Variables are explained in detail in Table 6 in the appendix.
These cycles are also reflected in the development of firms’ earnings and cash flows. This is illustrated in Figure 3, where median vales of EAR and CF are reported for each year of the sample period. Moreover, the figure illustrates that standardized cash flows are larger than standardized earnings throughout the sample period. This difference however, often called
accruals, varies over time. It is particularly small in boom phases (2000, 2004 and 2006) and particularly large in 2002, after the bust of the dot-com era (e.g. Gegenfurtner et al., 2009). De-tails on the development of EAR and CF are found in Table 7 in the appendix.
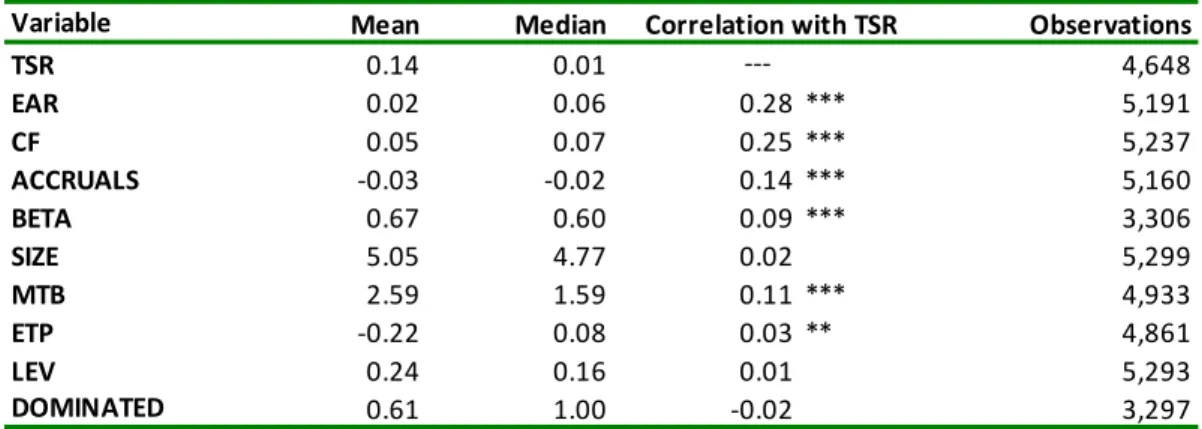
Table 2 then reports descriptive statistics on all key variables. In particular, the table reports coefficients of correlation for standardized earnings EAR and standardized cash flows CF with total shareholder return (TSR): In line with hypothesis 1 the coefficient of correlation for standardized accounting earnings EAR is positive and highly significant. Moreover, it is higher than the coefficient of correlation for standardized cash flows CF, although it is inter-esting to observe that the coefficient for CF is also highly significant, which is in line with the naïve view.
Variable Mean Median Observations TSR 0.14 0.01 4,648 EAR 0.02 0.06 0.28 *** 5,191 CF 0.05 0.07 0.25 *** 5,237 ACCRUALS -0.03 -0.02 0.14 *** 5,160 BETA 0.67 0.60 0.09 *** 3,306 SIZE 5.05 4.77 0.02 5,299 MTB 2.59 1.59 0.11 *** 4,933 ETP -0.22 0.08 0.03 ** 4,861 LEV 0.24 0.16 0.01 5,293 DOMINATED 0.61 1.00 -0.02 3,297 ---Correlation with TSR
The table reports descriptive statistics for the variables used in the regression analysis. All variables are explained in detail in Table 6 in the appendix. The second and third column report mean and media values, respectively. The fourth column reports individual correlations with total sharehold-er return (TSR). Statistical significance at the 1%-level, 5%-level, and 10%-level is indicated by ***, **, and *, respectively. The last column reports the individually the number of observations within the sample of relevant firms.
Table 2: Descriptive statistics
While this result is a first indication in favor of hypotheses 1, the figures reported in Table 2 are obviously only univariate, pooled cross-sectional coefficients. Therefore, I conduct a more detailed econometric analysis in the following section.
4. Empirical results
This section presents results of the empirical analysis. I use two-way fixed effects regression methods, i.e. regression models with fixed firm and fixed period effects to account for unob-servable firm-specific and period-specific heterogeneity. To circumvent endogeneity con-cerns I lag most of my controls in my regression specifications.
Section 4.1. examines hypothesis 1. Therefore, I estimate variants of my value-relevance spec-ifications (2) and (3) on the set of all firms in my sample. These are my base-case regressions. Section 4.2 splits the sample using three dummy variables proxying firm size and complexi-ty. I estimate variants of my extended value-relevance specification (3) on each of the six subsamples and compare coefficients and significance levels for each pair of subsamples. Section 4.3 splits the sample using the ownership dummy variable to proxy external moni-toring. Again, I estimate variants of my extended value-relevance specification (3) on each of the subsamples, and compare coefficients and significance levels. Finally, Section 4.4 reports results from various robustness tests.
4.1. Base-case regression
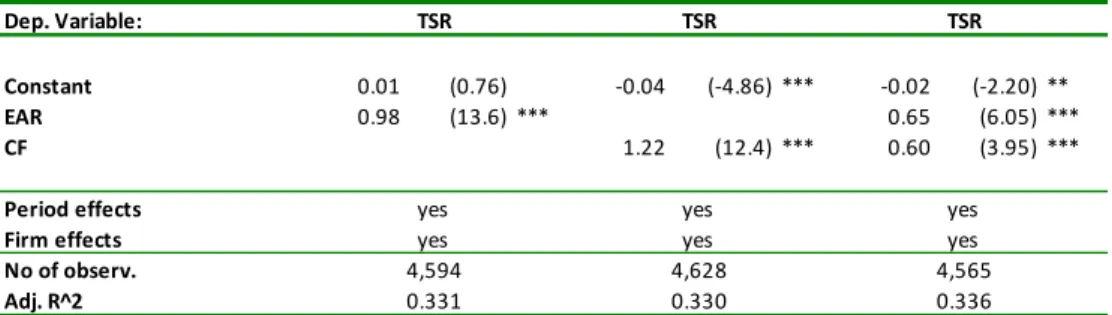
To examine hypothesis 1, I estimate variants of my value-relevance specifications (2) and (3) on the set of all firms in my sample. The results are reported in Table 3, where results of the simple (extended) value-relevance specifications are reported in Panel A (Panel B).
Panel A reports results from three specifications. In the first (second) specification standard-ized accounting earnings EAR (standardstandard-ized cash flows CF) are significantly positively cor-related with the endogenous variable TSR. These results are supported by specification three, where both variables (EAR and CF) are significantly positively correlated with the endoge-nous variable TSR. Moreover, note that adj. R2 improves only marginally when adding one variable to an existing specification.
Panel B also reports results from three specifications. The results of these three extended val-ue-relevance specifications are qualitatively similar to the ones of the simple valval-ue-relevance specifications reported in Panel A. Overall, these results do not support hypothesis 1 claim-ing that accountclaim-ing figures will outperform pure cash flow figures in explainclaim-ing a firm’s stock market performance.
Dep. Variable: Constant 0.01 (0.76) -0.04 (-4.86) *** -0.02 (-2.20) ** EAR 0.98 (13.6) *** 0.65 (6.05) *** CF 1.22 (12.4) *** 0.60 (3.95) *** Period effects Firm effects No of observ. Adj. R^2 Dep. Variable: Constant 1.46 (6.78) *** 1.42 (6.56) *** 1.40 (6.44) *** EAR 0.76 (5.78) *** 0.51 (3.04) *** CF 0.98 (5.29) *** 0.51 (2.15) ** BETA(-1) 0.03 (0.91) 0.03 (0.85) 0.03 (0.90) SIZE(-1) -0.26 (-7.15) *** -0.26 (-7.22) *** -0.26 (-7.02) *** MTB(-1) 0.00 (0.67) 0.00 (0.57) 0.00 (0.59) ETP(-1) -0.06 (-2.68) *** -0.07 (-2.99) *** -0.06 (-2.85) *** LEV(-1) 0.37 (2.65) *** 0.44 (3.12) *** 0.40 (2.84) *** DOMINATED 0.08 (2.44) ** 0.09 (2.60) *** 0.09 (2.59) *** Period effects Firm effects No of observ. Adj. R^2
Panel A: Simple two-way fixed-effects value-relevance regression
TSR TSR TSR
yes yes yes
yes yes yes
4,594 4,628 4,565
0.331 0.330 0.336
Panel B: Two-way fixed effects panel regression with additional controlls
TSR TSR TSR
yes yes yes
yes yes yes
2,363 2,357 2,350
0.357 0.355 0.358
The table reports coefficients and t-values of the base-case regressions explaining firms’ total share-holder return. Panel A reports results of three simple two-way fixed effects value-relevance specifi-cations. Panel B extends these specifications for various lagged controls and the ownership dummy variable DOMINATED. Variables are explained in detail in Table 6 in the appendix. All specifica-tions include period- and firm-fixed effects. t-values (reported in parentheses) are White-robust. Statistical significance at the 1%-level, 5%-level, and 10%-level is indicated by ***, **, and *, respec-tively.
4.2. Regression on subsamples proxying firm complexity
To examine hypotheses 2a and b I define various dummy variables, split my sample along each of the dummy variables and estimate the extended value-relevance specification (3) using two-way fixed effects models on each pair of subsamples.
In this section I use three dummy variables which proxy firm size and complexity. The first variable, MCAP, measures whether a firm’s market capitalization is below or above median in a particular year. The second variable, RND, measures whether a firm has positive RnD expenditures in a particular year. Finally, the third variable, INTANG, measures whether a firm has an asset structure with below or above median fraction of intangible assets. The results of these six regressions analyses are reported in Table 4: Panel A (B, C) report results from the regression analysis splitting the sample along MCAP (RND, INTANG).
The results are remarkably similar over all three pairs of subsamples: While standardized accounting earnings EAR are significantly positively correlated with the endogenous varia-ble TSR in the low information asymmetry setting, standardized cash flows CF are not. A completely opposite picture emerges in the high information asymmetry setting: Here stand-ardized cash flows CF are significantly positively correlated with the endogenous variable TSR, but standardized accounting earnings EAR are not.15
These results corroborate hypothesis 2.b, claiming that with increasing information asymme-tries, accounting figures become less relevant in explaining a firm’s stock market return compared to pure cash flow figures.16
15 Note that in the high information asymmetry setting adj. R2 is substantially higher. Additional analyses reveal
that this does not affect the results discussed above.
Subsample Dep. Variable: EAR 0.84 (3.19) *** 0.19 (0.80) CF 0.38 (0.97) 0.90 (2.77) *** Other controlls Period effects Firm effects No of observ. Adj. R^2 Subsample Dep. Variable: EAR 0.67 (2.80) *** 0.12 (0.45) CF 0.27 (0.77) 0.79 (2.04) ** Other controlls Period effects Firm effects No of observ. Adj. R^2 Subsample Dep. Variable: EAR 0.61 (2.63) *** 0.28 (0.89) CF 0.38 (1.07) 0.70 (1.69) * Other controlls Period effects Firm effects No of observ. Adj. R^2 yes yes yes 1,266 1,080 0.331 0.408
Panel C: Two-way fixed effects panel regressions on asset-structure subsamples
Firms with below median intangibles
Firms with above median intangibles TSR TSR yes yes yes yes yes 1,277 1,073 0.275 0.443
Panel B: Two-way fixed effects panel regressions on RnD-subsamples
Firms without RnD Firms with RnD
TSR TSR yes yes yes yes yes yes 836 1,514 0.290 0.412
Panel A: Two-way fixed effects panel regressions on size-subsamples
Small firms Large firms
TSR TSR
yes yes
yes yes
The table reports coefficients and t-values of regressions explaining firms’ total shareholder return on various complexity subsamples. Panel A splits the sample along firm size (measured in terms of market cap). Panel B distinguishes between firms with positive and zero research and development expenses. Panel C splits the sample in firms with below and above median intangible assets (deflat-ed by average total assets). Variables are explain(deflat-ed in detail in Table 6 in the appendix. All specifi-cations include controls used in the extended base-case regressions, period- and firm-fixed effects. t-values (reported in parentheses) are White-robust. Statistical significance at the 1%-level, 5%-level, and 10%-level is indicated by ***, **, and *, respectively.
4.3. Regression in subsamples proxying monitoring of shareholders
To gain further insights I also use the ownership dummy variable DOMINATED to split the sample into two subsamples. DOMINATED is presumed to proxy for monitoring abilities of shareholders (e.g. Grossmann and Hart, 1980; Shleifer and Vishney, 1986 and Holderness, 2003
for a survey). The results of the regressions analyses are reported in Table 5.
The result is remarkably similar to the above results: While standardized accounting earn-ings EAR are significantly positively correlated with the endogenous variable TSR in the low information asymmetry setting, standardized cash flows CF are not. In contrast, in the high information asymmetry setting standardized cash flows CF are significantly positively corre-lated with the endogenous variable TSR, but standardized accounting earnings EAR are not.17 Subsample Dep. Variable: EAR 0.34 (1.35) 0.51 (1.97) ** CF 1.07 (2.80) *** 0.31 (0.89) Period effects Firm effects No of observ. Adj. R^2
Widely-held firms Dominated Firms
TSR TSR yes yes yes 0.427 0.323 yes 997 1,353
The table reports coefficients and t-values of regressions explaining firms’ total shareholder return on two subsamples, distinguishing between widely held and dominated firms. Firms are defined to be dominated when free float is smaller than 50%. Otherwise, firms are defined to be widely held. Other variables are explained in detail in Table 6 in the appendix. All specifications include con-trols used in the extended base-case regressions, period- and firm-fixed effects. t-values (reported in parentheses) are White-robust. Statistical significance at the 1%-level, 5%-level, and 10%-level is indicated by ***, **, and *, respectively.
Table 5: Regressions on free float subsamples
Again, these results corroborate hypothesis 2.b claiming that with increasing information asymmetries accounting figures become less relevant in explaining a firm’s stock market return compared to pure cash flow figures.
17 Again, note that in the high information asymmetry setting adj. R2 is substantially higher. Additional analyses
4.4. Robustness of results
I challenge the above results in several ways. First, to deal with the problem of heteroskedas-ticity I use White-robust t-values. Second, I check variance inflation factors (VIFs) for all my specifications in order to check for multicolinearity (all VIFs are below 3.5). Third, while I only report results for the extended value-relevance specification in Table 4 and Table 5, I re-estimate all regressions using the simple value-relevance specification. My results are quali-tatively robust against these variations. Fourth, I control for the fact that during the sample period firms tend to increasingly adopt international accounting standards. I also re-estimate all my specifications after adding a dummy variable ACC_LOC taking the value of 1 if the firm follows the local (domestic) accounting standard. All my results are robust against this variation. For reference, results for the extended base-case regressions are reported in Panel A in Table 8 in the appendix.
Finally, I use three alternative measures of stock market returns as an endogenous variable: First, I use a second total shareholder return measure which is calculated over a 12 month period starting 5 month after the beginning of the corresponding fiscal year. Second, I use two excess return measures calculated as total shareholder return minus return of a buy-and-hold strategy investing in the CDAX. Results for the extended base-case regressions are re-ported in Panel B of Table 8 in the Appendix. Again, my results are robust against these vari-ations.
5. Summary and Conclusion
Rappaport’s shareholder value approach claims that managerial decisions are to be judged against their effect on shareholder wealth, i.e. their impact on the firm’s stock market per-formance. Adopting this view the relevant performance measure for managerial accounting purposes is total shareholder return to be earned by investments in the firm’s stocks. How-ever, from the perspective of optimal incentive design using total shareholder return (TSR) as a performance measure has a serious drawback, since it is well-known that a substantial part of the variation in TSR is due to exogenous events beyond control of the management. Thus, although Rappaports shareholder value approach seems widely accepted today, there is an ongoing debate about appropriate internal performance measures to evaluate manage-rial decisions and to be used in managemanage-rial accounting.
While some of the modern performance measures used in managerial accounting rely on cash flow based figures others try to take advantage of the information content of accounting figures. However, whether the additional information content in the accrual components of earnings improves the internal performance measurement is an open empirical question. To shed light on this question, I examine the correlation of operating cash flows and earnings with firm’s total shareholder returns. Using fixed firm effects regression methods for a large sample of German listed firms covering some 5,000 firm years, the analysis shows that gen-erally operating cash flow and earnings are both positively correlated with total shareholder return. However, with increasing information asymmetry earnings become less correlated with the firm’s stock market performance, and operating cash flow dominates earnings in explaining total shareholder return (and vice versa). These results suggest that, from a man-agerial accounting perspective the information content of accounting figures is only valuable in settings characterized by low information asymmetries. In sum, there is no one-size-fits-all performance measure for managerial accounting purposes, since shareholders have to trade-off the benefits due to the information content of accounting figures against the costs arising from earnings management, which seem particularly relevant in settings characterized by high information asymmetries.
References
Athanassakos, G. (2007), 'Value-based management, EVA and stock price performance in Canada', in: Journal of Management Decision, Vol. 45, No. 9, pp. 1397-1411.
Ball, R. and P. Brown (1968), 'An empirical evaluation of accounting income numbers', in:
Journal of Accounting Research, Vol. 6, No. 2, pp. 159–178.
Biddle, G.C.; R.M. Bowen and J.S. Wallace (1999), 'Evidence on EVA', in: Journal of Applied Corporate Finance, Vol. 12, No. 2, pp. 69-79.
Biddle, G.C.; R.M. Bowen and J.S. Wallace (1997), 'Does EVA® beat earnings: Evidence on the
association with stock returns and firm values', in: Journal of Accounting and Economics, Vol. 24, No. 2, pp. 301-336.
Chen, S. and J.L. Dodd (1997), 'Economic Value Added®: An empirical examination of a new
corporate performance measure', in: Journal of Managerial Issues, Vol. 9, No. 3, pp. 318-333.
Chen, S. and J.L. Dodd (2001), 'Operating income, residual income and EVATM: Which metric
is more value relevant?', in: Journal of Managerial Issues, Vol. 13, No. 1, pp. 65-86.
Claes, P.C.M. (2008), 'Value-based management control systems: An analysis of design and use', (Universiteit Amsterdam).
Dechow, P.M. (1994), 'Accounting earnings and cash flows as measures of firm performance: The role of accounting accruals', in: Journal of Accounting and Economics, Vol. 18, No. 1, S. 3-42.
Dechow, P.M.; R.G. Sloan and A.P. Sweeney (1995), 'detecting earnings management', in: The Accounting Review, Vol. 70, No. 2, S. 193-225.
Dechow, P.M. and D.J. Skinner (2000), 'Earnings management: Reconciling the views of ac-counting academics, practitioners, and regulators', in: Accounting Horizons, Vol. 14, No. 2, S. 235-250.
Erasmus, P. (2008a), 'Evaluating value based financial performance measures', (Dissertation pre-sented for the degree of Doctor of Philosophy at Stellenbosch University).
Erasmus, P. (2008b), 'Value based financial performance measures: An evaluation of the rela-tive and incremental information content', in: Corporate Ownership & Control, Vol. 6, No. 1, pp. 66–77.
Friedl, G. and T. Kettenring (2009), 'A note on the war of metrics', TUM Munich, 2009.
Fama, E.F. and K.R. French (1993), 'Common risk factors in the returns on stocks and bonds', in: Journal of Financial Economics, Vol. 33, No. 1, pp. 3–56.
Gegenfurtner, B.; M. Ampenberger and C. Kaserer (2009), 'The impact of managerial owner-ship, monitoring and accounting standard choice on accrual mispricing', CEFS Working Paper 2009-02.
Grant, J.L. (1996), 'Foundations of EVATM for investment managers', in: The Journal of Portfo-lio Management, Vol. 23, No. 1, pp. 41-45.
Grossmann, S. and O. Hart (1980), 'Takeover bids, the free-rider problem, and the theory of the corporation', in: Bell Journal of Economics, Vol.11, No. 1, pp. 42-64.
Günther, N.; B. Gegenfurtner; C. Kaserer and A.-K. Achleitner (2009), 'International financial reporting standards and earnings quality: The myth of voluntary vs. mandatory adop-tion', CEFS Working Paper 2009-09.
Holderness, C.G. (2003), 'A survey of blockholders and corporate control', in: FRBNY Eco-nomic Policy Review, Vol. 9, No. 1, pp. 51-64.
Keef, S. and M. Roush (2002), 'Does MVA measure up?', in: Financial Management, January 2002, pp. 20-21.
Kleiman, R.T. (1999), 'Some new evidence on EVA companies', in: Journal of Applied Finance, Vol. 12, No. 2, pp. 80-91.
Kumar, K.R. and G.V. Krishnan (2008), ' The value-relevance of cash flows and accruals: The role of investment opportunities', in: The Accounting Review, Vol. 83, No. 4, pp. 997-1040.
Koller, T.; M. Goedhart and D. Wessels (2005), 'Valuation: Measuring and Managing the Value of Companies', (4th ed., McKinsey & Company).
KPMG Consulting (1999), 'Value based management: The growing importance of shareholder value in Europe', (KPMG Consulting).
Lev, B. (1989), 'On the usefulness of earnings and earnings research: Lessons and directions from two decades of empirical research', in: Journal of Accounting Research, Vol. 27, Supplement, pp. 153-201.
Lovata, L.M. and M.L. Costigan (2002), 'Empirical analysis of adopters of economic value added', in: Management Accounting Research, Vol. 13, No. 2, pp. 215-228.
O’Byrne, S.F. (1996), 'EVA and market value', in: Journal of Applied Corporate Finance, Vol. 9, No. 1, pp. 116-125.
Ottosson, E. and F. Weissenrieder (1996), 'Cash Value Added - A new Method for Measuring Financial Performance', Gothenburg Studies in Financial Economics.
Pfaff, D. (2004), 'Value-based management and performance measures – cash flow versus accrual accounting', in: The Economics and Politics of Accounting: International Essays, ed-ited by Hopwood A.; C. Leuz and D. Pfaff (Oxford University Press).
Pronobis, P.; B. Schwetzler; M.O. Sperling and H. Zülch (2008), 'The development of earnings quality in Germany and its implication for further research: A quantitative empirical analysis of German listed companies between 1997 and 2006', in: Corporate Ownership and Control, Vol. 7, No. 1, p. 434-455.
Rappaport, A. (1981), 'Selecting strategies that create shareholder value', in: Harvard Business Review, Vol. 59, No. 3, pp. 139-149.
Rappaport, A. (1998), 'Creating shareholder value – A guide for managers and investors', (2nd ed., Free Press).
Ryan, H.E. and E.A. Trahan (1999), 'The utilization of value-based management: An empiri-cal analysis', in: Financial Practice and Education, Vol. 9, No. 1, pp. 46-51.
Ryan, H.E. and E.A. Trahan (2007), 'Corporate financial control mechanisms and firm per-formance: The case of value-based management systems', in: Journal of Business Finance & Accounting, Vol. 34, Nos. 1&2, pp. 111-135.
Shleifer, A. and R.W. Vishny (1986), 'Large shareholder and corporate control', in: Journal of Political Economy, Vol. 94, No. 3, pp. 461-488.
Sloan, R.G. (1996), 'Do stock prices fully reflect information in accruals and cash flows about future earnings?', in: The Accounting Review, Vol. 71, No. 3, pp. 289-315.
Stern, J.M., G.B. Stewart and D.H. Chew (1995), 'The EVA financial management system', in:
Journal of Applied Corporate Finance, Vol. 8, No. 2, pp. 32–46.
Stewart, G.B. (1994), 'EVATM: Fact and fantasy', in: Journal of Applied Corporate Finance, Vol. 7,
No. 2, pp. 71-84.
Vorstius, S. (2004), 'Wertrelevanz von Jahresabschlussdaten', (Gabler Edition Wissenschaft, Wiesbaden).
Warfield, T.D.; J.J. Wild and K.L. Wild (1995), 'Managerial ownership, accounting choices, and informativeness of earnings', in: Journal of Accounting and Economics, Vol. 20, No. 1, p. 61–91.
Weissenrieder, F. (1997), 'Value based management: Economic value added or cash value added?', Gothenburg Studies in Financial Economics.
Wooldridge, J.M. (2002), 'Econometric analysis of cross section and panel data', (MIT Press). Worthington, A.C. and T. West (2001), 'Economic value-added: A review of the theoretical
and empirical literature', in: Asian Review of Accounting, Vol. 9, No. 1, pp. 67-86.
Young, S.D. and S.F. O’Byrne (2001), 'EVA and value-based management: A practical guide to implementation', (Mcgraw-Hill Professional).
Appendices
Variable Description Source
ACC_LOCAL Accountingstandard (dummy vari able equal 1 if accounti ng standard followed is German HGB) TD
ACCRUALS Accruals cal cul ated as EBIT mi nus OCF TD, own calc
BETA Regression coefficient of a simple market model using monthly market returns (proxied by CDAX returns) TD, own calc
CF CFO deflated by average total assets TD, own calc
CFO Total funds from operati ons representing the sum of net i ncome and all non-cash charges or credits TD DOMINATED Ownershi p structure proxy (dummy variable equal 1 if free float is smal ler than 50%) TD, own calc
EAR EBIT deflated by average total assets TD, own calc
EBIT Earnings before interest and taxes (EBIT) TD
ETP Earnings before taxes (EBT) deflated by market capitalization TD, own calc
LEV Leverage proxy (total debt deflated by total assets) TD, own calc
MTB Market-to-book ratio of equity TD, own calc
SIZE Firm size proxy (ln of 1+total assets) TD, own calc
TSR Total shareholder retun (measured from month 4 of the corresponding fi scal year to month 16) TD, own calc TSR_EX Total shareholder retun (measured from month 4 of the corresponding fi scal year to month 16) exceeding the
corresponding market return (proxied by CDAX return)
TD, own calc
The table reports detailed descriptions and data sources of the variables. TD refers to Thomson da-tabase.
Table 6: Description of variables
YEAR 1998 1999 2000 2001 2002 2003 2004 2005 2006 2007 2008 Total EBIT 61,994 64,149 92,241 42,563 31,469 54,371 80,520 88,899 99,233 120,771 93,621 829,832 EBIT 9.000 5.667 6.723 3.264 1.598 2.289 5.155 4.770 7.581 8.780 7.017 5.517 EAR (median) 8.2% 6.0% 5.9% 3.6% 2.2% 3.3% 6.0% 6.4% 7.2% 7.4% 5.8% 5.7% CFO 90,209 89,770 109,529 103,063 115,404 108,465 116,621 119,059 135,437 151,900 136,313 1,275,769 CFO 10.252 7.304 7.305 5.814 4.252 4.510 6.192 6.447 8.615 8.923 9.301 7.069 CF (median) 10.4% 8.2% 6.9% 5.7% 4.2% 5.8% 7.4% 8.0% 8.3% 8.7% 7.6% 7.5% Accruals -28,273 -25,591 -17,224 -60,500 -83,959 -54,029 -36,081 -30,153 -36,199 -31,122 -42,548 -445,680 Accruals -0.683 -1.102 -1.697 -3.091 -2.631 -1.940 -0.946 -0.456 -0.519 -0.490 -1.161 -1.284 ACC (median) -1.6% -2.0% -2.4% -3.1% -3.2% -2.8% -1.8% -1.0% -0.9% -0.7% -1.2% -1.9% TSR (median) -11.3% -2.7% -21.1% -30.2% -30.0% 49.7% 6.8% 35.3% 7.1% -18.8% -35.9% -5.5%
The table reports descriptive statistics of the main variables EAR, CFO, ACC and TSR. Accruals are calculated as the difference between operating cash flows (CFO) and earnings before interest and taxes (EBIT). ACC represent standardized accruals, i.e. accruals deflated by average total assets of the firm in the corresponding firm year. All other variables are explained in detail in Table 6 in this appendix.
Dep. Variable: Constant -0.02 (-2.20) ** -0.01 (-0.95) 1.40 (6.44) *** 1.39 (6.28) *** EAR 0.65 (6.05) *** 0.69 (6.25) *** 0.51 (3.04) *** 0.51 (2.99) *** CF 0.60 (3.95) *** 0.54 (3.42) *** 0.51 (2.15) ** 0.51 (2.15) ** BETA(-1) 0.03 (0.90) 0.03 (0.97) SIZE(-1) -0.26 (-7.02) *** -0.26 (-6.91) *** MTB(-1) 0.00 (0.59) 0.00 (0.60) LEV(-1) 0.40 (2.84) *** 0.40 (2.80) *** DOMINATED 0.09 (2.59) *** 0.09 (2.56) ** ACC_LOCAL 0.01 (0.52) -0.02 (-0.43) Period Effects Firm Effects No of observ. Adj. R^2 Dep. Variable: Constant 1.40 (6.44) *** 1.26 (5.92) *** 1.30 (6.34) *** 1.43 (6.67) *** EAR 0.51 (3.04) *** 0.56 (3.30) *** 0.43 (2.54) ** 0.39 (2.24) ** CF 0.51 (2.15) ** 0.52 (2.18) ** 0.45 (1.98) ** 0.49 (2.06) ** BETA(-1) 0.03 (0.90) 0.02 (0.81) -0.01 (-0.54) -0.02 (-0.58) MTB(-1) 0.00 (0.59) 0.00 (0.66) 0.00 (1.15) 0.00 (1.35) ETP(-1) -0.06 (-2.85) *** -0.06 (-2.81) *** -0.05 (-2.60) *** -0.06 (-2.51) ** LEV(-1) 0.40 (2.84) *** 0.40 (2.83) *** 0.41 (3.12) *** 0.43 (3.18) *** DOMINATED 0.09 (2.59) *** 0.08 (2.40) ** 0.06 (2.00) ** 0.07 (2.07) ** Period Effects Firm Effects No of observ. Adj. R^2 yes 2,350 TSR_55_EX
yes yes yes
0.358 0.530 0.333 0.433 yes yes yes yes 2,350 2,350 0.336 0.340 0.358 0.359 2,350 TSR_44 TSR_44_EX TSR_55
yes yes yes
yes
yes
4,565 4,283 2,350 2,344
yes yes yes
Panel B: Two-way fixed effects panel regressions explaining alternative return specifications
TSR TSR
Panel A: Two-way fixed effects panel regressions controlling for local accounting standard
TSR TSR
The table reports coefficients and t-values of the robustness tests of my base-case regressions. Panel A extends my base case regressions for an accounting standard dummy variable that takes the val-ue of 1 if the firm follows a local accounting standard. Panel B re-estimates the extended base-case regressions using alternative specifications for the endogenous variable. I use two standard total shareholder return measures and two excess return measures. Excess return is calculated as total shareholder return minus return of a buy-and-hold strategy investing in the CDAX. TSR_44 and TSR_55 are standard total shareholder return measures over a 12 month period starting 4 months (5 months) after the beginning of the corresponding fiscal year. TSR_44_EX and TSR_55_EX are the corresponding excess return measures. All other variables are explained in detail in Table 6 in the appendix. All specifications include period- and firm-fixed effects. t-values (reported in parenthe-ses) are White-robust. Statistical significance at the 1%-level, 5%-level, and 10%-level is indicated by ***, **, and *, respectively.