Analytic Provenance as Constructs
of Behavioural Markers for Externalizing
Thinking Processes in Criminal
Intelligence Analysis
Junayed Islam, B. L. William Wong, and Kai Xu
Introduction
Visual Analytics tools in the recent years have made an impact in the criminal intelligence and analysis communities. Histories of user interactions known as Analytic Provenance have been used to advance our understanding of tool usage and user goals in a variety of areas. User interaction histories contain information about the sequence of choices that analysts make when exploring data or performing a task. To understand how the analyses are being made it requires support of correlating lower-level events during analysis process with upper level sub-tasks,
tasks and goals of decision making process as proposed by Gotz and Zhou (2008).
Until recently, most of the research has focused on the techniques and methods for refining visual analytic tools, with the emphasis on empowering analysts to make discoveries faster and more accurately. Although this emphasis is relevant and necessary, we argue that the process through which an analyst arrives at the conclusion is just as important as the discoveries themselves. Understanding how an analyst performs a successful criminal investigation will finally let us start bridging the gap between the art of analysis and the science of analytics. We found out from the detection approach of behavioural marker from analytical data that they can bridge such gap alongside of performance measurement. The overarching aims of this research are based on following research questions to find out-.
J. Islam () · B. L. William Wong
Interaction Design Centre, Middlesex University, London, UK e-mail:[email protected];[email protected]
K. Xu
Department of Computer Science, Middlesex University, London, UK e-mail:[email protected]
© The Author(s) 2018
G. Leventakis, M. R. Haberfeld (eds.),Community-Oriented Policing and Technological Innovations, SpringerBriefs in Criminology,
https://doi.org/10.1007/978-3-319-89294-8_10
RQ1: What are the constructs of behavioural markers for criminal intelligence analysis?
RQ2: How to externalize analyst’s thinking processes from constructs of
behavioural markers in criminal intelligence analysis?
This contribution is part of a research work aimed to find out appropriate methods or techniques to evaluate a visual analytic tool named as Analyst’s User
Interface (AUI) of the project VALCRI1 (Visual Analytics for Sensemaking in
Criminal Intelligence Analysis). In section “Related Works” numbers of existing
related work, in section “Development Approach of Behavioural Marker System”
methodology overview to find out Behavioural Markers (BMs), their constructs
and detection approaches have been presented. Section “Conclusion” includes
conclusion and future work.
Related Works
Behavioural Marker systems are now being developed for performance measure-ment in a range of organizational settings, especially in high reliability industries such as air aviation, nuclear power, maritime transport, and medicine. They are usually structured into a set of categories (e.g. co-operation, decision making, and situational awareness). Normally, these categories are then sub-divided into more specific nontechnical skills or elements. The seminal research on behavioural markers comes from studies of civilian pilots carried out by Helmreich and colleagues at the University of Texas. In the late 1980s they developed a data collection form called the LINE/LOS Checklist (LLC) to gather information on
flight crews’ crew resource management performance (Helmreich et al. 1990).
This checklist has been used as the basis of many airlines’ behavioural marker
systems (Flin and Martin2001). Behavioural Markers (BMs) concept is not only
used to measure team performance in aviation or medical sectors but also their uses
for evaluating visualization are noticeable. North (2006) claims that the purpose
of visualization is insight and to determine to what degree visualizations achieve this purpose. He listed some of the characteristics of insight such as – complex,
deep, qualitative, unexpected and relevant. Saraiya et al. (2005) defined insight
as an individual observation about the data, a unit of discovery. They presented several characteristics of insight while running a pilot study on biological and microarray data such as – observation, time, domain value, hypotheses, directed versus unexpected, breadth and depth, category. In a case study with the popular
visual analytics application Jigsaw, Kang et al. (2009) found that analysts’
inter-action histories showed evidence of the high-level sensemaking processes (Pirolli
and Card2005). Reda et al. (2014) approached interaction and sensemaking by
combining interaction logs and user-reported mental processes into an extended log and modeling the log using transition diagrams to better understand the transition between mental and interaction states.
Development Approach of Behavioural Marker System
The typical method for the initial development of behavioural marker systems is to carry out a literature review of previous domain specific research concerned with nontechnical skills, followed by interviews with subject matter experts designed to extract the nontechnical skills required to do their job effectively (e.g. Fletcher et al.
2004; Mitchell and Flin2009; Yule et al.2006). We also carried out a systematic
literature review by using several electronic databases (PsychINFO, ScienceDirect, Web of Science, Google Scholar, and the Defence Technical Information Center) to identify research articles with search terms: criminal intelligence, behavioural markers, human factors, situation awareness, decision making, intelligence analyst, cognitive skills etc. We considered cognitive attributes to present our phase-1 (Flin
et al. 2008) behavioural markers found from literature review. We also arranged
a workshop to discuss different concepts and extract related cognitive behaviours. There were about 30 criminal intelligence domain experts present in the workshop including ex-police, ex-intelligence analysts, researchers and other developers. The whole team was divided into several groups and then each concept was gone through one by one. Each person in the group said some words that they associated with the concept. We put them all on post-its and organized them thematically (i.e, an affinity diagram) at the end. Thus we formed an exhaustive list of behavioural
markers for criminal intelligence analyst as shown in Table10.1. Our aim was to
identify a set of mostly relevant behavioural markers by considering human factors and cognitive engineering principles that underlie the design of user interface, visualization and interaction on criminal intelligence analysis system. The goal is to determine the extent to which imagination, insight, transparency and fluidity & rigour are enhanced on the assumption that improving these, will likely improve analysts’ ability to solve crime or be better at performing criminal intelligence analysis by using Analyst’s User Interface (AUI) of the project VALCRI (Wong
et al.2014).
Detection Method
From a quantitative behavioural developmental theory perspective (Commons et al.
1998), behavioural constructs are events that have the potential to be directly
observed. We have defined a set of behavioural markers into Table10.1, and mainly
look for their occurrence in the recorded analytic process data by considering the context of the situations that these behaviours were observed (i.e. before and after actions and conditions). Within such task environment in criminal intelligence, process data from the task interface allows for the collection of information that may be indicative of observable behaviours. So, the challenges underlies of
T a bl e 10. 1 C o n str u cts o f o b se rv ab le b eh av io u rs in cr imin al in te llig en ce an al y sis C ate g o rie s A n tecedent s Processes Outc ome s P assi on, in spi red, m oral Im agi nati on M o tiv a ti on O p enness, focused, in sp ir atio n , mo ti v atio n , pl ayful n ess, curi osi ty , freedom Di v er g ent thi nki n g Openness, curi osi ty , creat iv e p la y, expl ori ng, experi m ent ing, id ea generat ion, free thi nki ng, fr ee d o m , o u tlie r th in k in g , th in k in g o u ts id e th e box, in v ent ing, goi ng be yond gi v en inform at ion, tr adi ti onal assum p ti ons, unusual int erpret at ion, fl u en cy , fl ex ib ility Id ea g en er atio n , n o v elty , in v en ti v e, ab str ac tio n o f te rm s, accept ance Me n ta l mo d ellin g Anal yt ical reasoni ng, m et aphori cal th inki ng, anal ogi cal reasoni ng, m o ral reasoni ng, cont rari an th in k in g , p ro b ab ility re as o n in g , q u es tio n in g , abst ract io n o f term s, changi ng pot ent ia l out put , com p ari son, findi ng al ternat e obj ect s, generat in g hypot heses, scenari o b u il d ing, in ferri ng p o ss ib ilitie s Incubat ion, flai r, reason, bel ie f in tr u th , g ettin g o u t o f an imp as s Insi ght M eans to support insi g ht V is u aliz ed in fo rm atio n , v is u aliz in g in fo rma tio n Ideati onal De v el opi ng ne w ideas, d ev el opi ng ne w perspect iv e, ev ol vi ng percept ion, re v el at ion, in tu it ion, underst andi ng a si tu at ion, percei vi ng in fo rm atio n , la d d er in g , cr ea tin g a n ew p atte rn , associ at iv e quest ioni ng, leap of fa it h Consequences Rel ev ance enhanced percept ion, bei n g abl e to expl ai n, cont ri b u ti o n to p la usi b le narrat iv e, ev id ence for hypot hesi s b ui ld ing, v eri fyi n g hypot hesi s, cont radi ct io n o f p re vi ous bel ie fs, quest ioni ng assum p ti ons M a nagi ng com p le xi ty Un ta n g lin g co m p le x ity , m es s findi ng. Pr obl em sol vi ng R ec o g n itio n an d d is co v er y, p ro b le m re fo rm u la tio n , refram ing, unco v eri ng Out p ut s A w areness, underst andi ng, enhanced percept ion, une xpect ed underst andi ng, sudden jum p in underst andi ng, underst andi ng hypot hesi s, A sol u ti o n o f unkno wn pro v enance, ne w kno wl edge, n ew p atte rn , p o ss ib ility , d is ca rd o p tio n s, breakt h rough
Experi ence of givi ng in si ght Seei ng som et h in g in a di ff erent li ght , une xpect ed unde rs ta nding, eu re ka mo me nt, re cognitio n and di sco v ery , w it hout consci ous thought s, in ternal and consci ous T ranspar ency P roper m o tiv a ti on M aki ng aw areness v is ib le St ruct ured anal ysi s, cri ti cal th inki ng, assessm ent o f so u rc e q u ality , o p en so u rc e, ea se o f access, see thr ough, obs er v ab ility , re co rd ing o f p ro v ena nc e, ex te rn aliz atio n o f re as o n in g , ex te rn aliz atio n o f assum p ti ons Ac co u n ta b ilit y a n d le g a l co mp lia n ce Sho w ing complia nc e, ac counta b ility , le g al cla rity , le gal cert ai n ty , fai rness, honest y, tr ut h T echni ques Us ab ility , v is ib ility an d co n fi g u ra b ility o f al g o rith mic param et ers, im m une to changes b y unaut hori zed persons, sho wi ng in fo out si de th reshol d, define u ser access. User m anual s Pr eci si on on com m uni cati on C o mmu n ic atio n o f u n ce rta in ty , co mmu n ic atio n o f co mp le x ity , co mmu n ic atio n o f p ro b ab ility , co mmu n ic atio n o f limita tio n s, co mmu n ic atio n o f anal yt ic confidence, com m uni cat io n o f anal y ti c confidence Effects Cont radi ct io n o f p ri v ac y, st ruct u red anal y si s, anal yt ic pro v enance, m aki ng aw areness v is ib le, cri ti cal th inki ng, ackno wl edgi ng al te rnat iv es, ab ility to unde rs ta nd an d re cons tr uc t ope ra tions or deci si ons Engagem ent of m u lt ip le stak ehol ders Indi vi dual and col laborat iv e rol es, d if ferent st ak ehol ders A u d it a b ilit y Feedback, easy to access, open source, di scl o sure, tr aceab ility , ab ility k n o w an d tr ac k b ac k , v er ifi ab ility , sh o win g in fo rm atio n o u ts id e o f th reshol d, di rect m ani pul at io n Pr o v enance A udi t, tr aceab ility , d is cl o su re o f alg o rith mic re as oning, ac count ab ility , ele me nts & pa ths bet w een prem is es & concl u si ons in reasoni ng Pr eci si on Counte rs m is us e, not am biguous , not be guiling. Cl ari ty , accurac y, cert ai n ty , see th rough, ap p lic ab ility , ac k n o wle d g in g alte rn at iv es , q u ality o f in fo rm atio n (cont inued)
T a bl e 10. 1 (cont inued) C ate g o rie s A n tecedent s Processes Outc ome s Ri gour V isual support Ri gour in a nal y si s Co mp lia n ce Cl ear di st in ct io n b et w een fact s an d suppos itions , n ar ra tion. St ruct ured anal yt ic techni que, consi d erat io n o f multiple hypothe si s, cr iti ca l thinking, accurac y of judgem ent , st ic k to rul es & p rocedures, p ri nci p le , or de r, re spons ib ility , due dilige n ce , atte ntion to d eta il, in fo rm atio n v alid atio n , ad h er en ce to st andards, ri gour of pro v enance, cert ai n ty , as se ss m en t o f so u rc es & q u ality , time lin es s, su b sta n tia te Due d ilige n ce , re spons ib ility , le g al co mplia nc e, adherence to st andards, assessm ent o f sources and qua lity , compr eh en si v ene ss , thor ough, thought ful n ess, at te nt io n to d et ai l, exhaust iv e, cert ai n ty , st ic k to rul es and p rocedures, o rder , ri gour of process, pri n ci pl es, ri gour of pro v enance Anal yti c support Ap p lic atio n o f an aly tic techni ques, hel p ful n ess, deci si on poi nt , seei ng th e process o f d eepeni n g anal ysi s Ri gour in the com m u ni cati on of anal yti c findi ngs Com m uni cat io n o f anal y ti cal pro v enance, com m uni cat io n o f anal y ti c confidence, com m uni cat io n o f assum p ti ons, com m uni cat io n o f pr oba b ilitie s, co mmuni ca tion o f unc er ta inty , rigour o f ar g u m en t, ev id en ce d , su b sta n tia te , tr u st cal ib rat ion, confirm at iv e hypot hesi s, deci si on poi nt , inform at io n v al id at io n Fi t for pur p ose T ime lin es s, re le v an ce , co mmitme n t T ranspar ency Cle ar dis tinc tion b et we en F ac ts & Suppos itions , cl ari ty of reasoni ng, tr ansparenc y, ext ernal izat io n of reasoni ng process, seei ng th e p rocess o f deepeni n g anal y si s, ri gour of pro v enance, com m uni cat io n o f anal y ti cal pro v enance In tu iti v e in te ra ctio n s, v ar ia b ility o f lo g ic al rel at ionshi ps. Fl ui di ty V isual support Ad ap ta b le U I, in tu iti v e in te ra ctio n s, ra p id ly re v er sib le in te ra ctio n , lo w cogni ti v e lo ad, dynam ic, cont ent rel at ed adapt at ion, ea se o f u se , m u ltip le v ie w s to b le n d , tr an sp o sitio n o f d ata , v ar ia b ility o f lo g ic al rel at ionshi ps, fast anal y ti c response ti m e W it h h o ld in g co mmit m en t C ir cu m sp ec t, te n ta ti v e, m alle ab ility , E x p lo ra b le dat a anal ysi s, ease o f transi ti on, consi d erat io n o f multiple hypothe si s, pla y fu lne ss V ar ia b ility o f lo g ic al re la tio n sh ip s, co n te x t re la te d adapt at ion, ease o f u se, d iv er gent th inki ng, Expl orabl e dat a anal ysi s, p layful ness, ma lle ab ility Anal yti c support T ra n sp o sitio n o f d ata , n o d ata wrangl ing, ease o f represent in g rel at ionshi ps, hol is ti c vi ew of dat a
converting such analytic process related data into behavioural markers. Within the intelligence analysis environment, process data from the task interface allows for the collection of information that may be indicative of behavioural markers. Such as – Fluency, specifically during the data finding process, can be defined as the ability to generate many different pieces of data. Fluency in data finding is the indicative of a behavioural marker known as “creativity”. Imagination can be considered in terms of creativity, and creativity in the literature can be approximated as ‘divergent thinking’, and researchers have attempted to measure divergent thinking through concepts such as ‘fluency in data finding’ or ‘flexibility unshifting between
approach’ (Fontenot1992). This concept of reducing complex construct into
sim-pler, easier to measure constituent cognitive components can be conceivably applied to complex problem solving tasks. Such reductionist approach gives an overview of behavioural markers and their role for the scientists to recognize them when certain behaviours have occurred into analytic process data stream. Data reductions are accomplished through coding and manual interpretation during qualitative research approach, which is extremely labour intensive. Direct observation through video, physical observation, participant interview, audio recording are needed for this purpose.
Action Sequences Computation
The streams of actions during analytic process can be meaningful markers for complex behaviours. Current approaches such as – finite state systems for fixed manipulable elements, a priori establishment of fixed sequences for clearly defined tasks, exhausting all possible sequences for tasks with unpredictable human ele-ments, are available for information computation about behavioural and cognitive processes and their implications for large scale complex analysis. The use of network graph visualization in this context can be a useful exploratory process, rather than exhaustive, to observe and gain understanding which empirical action combinations may provide meaningful sequence for targeted behavioural marker. The sequences need to be converted into a structure that is more suitable for network analysis and visualization. Some sequences might be observed more often while
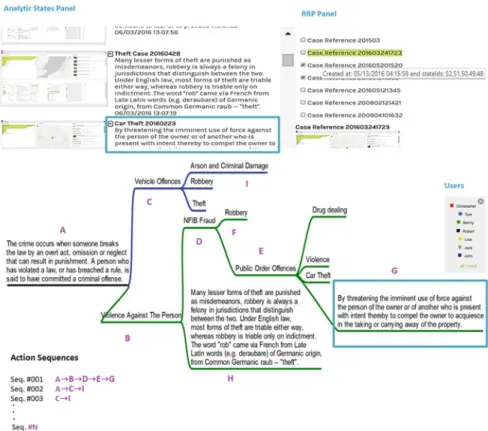
others are only observed in very rare occasions. Low Level Action sequenceSeq.
#001A→B→D→E→Gas shown in Fig.10.1, comprises of analytic states
A, B, D, E, Gare different analytic states after low level actions have been applied on. As we aim to follow a compositionally reductive framework for the contextual information of complex analytic states, we can denote each of them as semantic
state composition functionP(S)whereSis an analytical state.
Fig. 10.1 An analytic path showing annotations set by analysts with captured states & their relationships based on interactions with colour coded users (analysts) information. States can be selected from States Panel & RRP list of Analyst’s User Interface (AUI) to load analytic path for understanding intersections of analytical states captured by different analysts during their analysis process (Islam et al.2016)
ForSeq. #001,it can expressed as –
P (SA)=SA P (SB)=SB P (SD)=SD . . . .
Thus we computedn th state Sn as P : SA,B,D,. . .,n−1 → Sn. Composition
function of different analytic states can be expressed as –
P (SA) oP (SB)=P oP (SA, SB)= {SA, SB} =SA,BP :SA →SB
P (SB) oP (SD)=P oP (SB, SD)= {SB, SD} =SB,DP :SB→SD . . . .
P oPSA,B,D,...,n−1, Sn= {SA, SB, . . . , Sn}
P:SA,B,D,. . .,n−1→Sn=SST,whereSSTis a Sub-Task State (Gotz and Zhou
2008) through low level actions or events.
This is how other low level action sequencesSeq. #002,Seq. #003,. . .,. . ., . . .,
Seq. #Ncan be computed.
To determine which sequences are more valid measures of ‘Behavioural
Mark-ers’, we consider attributes of Table10.1and this would entail some form of network
analysis; so each low level actions (representing an analytic state) can be defined as a ‘node’ and the links that make up a sequence across the nodes can be defined as ‘edges’. Eigenvector centrality is one method of computing the “centrality”, or approximate importance, of each node in a graph network. The assumption is that each node’s centrality is the sum of the centrality values of the nodes that it is connected to. The adjacency and centrality matrices for the action sequence graph
as shown in Fig.10.1have been computed. The centrality matrix is an eigenvector
of the adjacency matrix such that all of its elements are positive. While nodes with higher importance and associated edges indicate that they are taken more often, and therefore may imply that the analysts are finding more sensible choices for shifting from one approach to another (Flexibility) or generating more alternative approaches (Fluency). Creativity is manifested through the flexibility, fluency and
originality of responses to a task (Torrance1988) which can be approximated as
‘divergent thinking’ or alternately “Imagination”.
Conclusion
This research aims to explain how human cognition leads to interactions and vice
versa to achieve certain goal. The identified behavioural markers (Table10.1) are
aimed to use as attributes for performance measurement of an Analyst’s User
Interface (AUI) for the project VALCRI.1One of the requirements from a focus
group during our previous study (Islam et al. 2016) with the end-users (Police
Analysts) was to capture analyst’s thinking processes during their analysis. It is difficult to recover such thinking processes by using extended analytical provenance log or only by observing. For example, knowing when one reasoning process ends and another begins may be unclear from a sequence of interaction alone. In our previous research we proposed a captured logical state composition approach and
their grouping arrangement (Fig.10.1) as the solution to cognitive steps sequencing problem along with analytic data. In this research work we have aimed to couple
these cognitive steps with analytic data. Endert et al. (2015) contend that a new
methodology to couple the cognitive and computational components of visual analytic system is necessary. We have proposed markers of behaviours as attributes for coupling human cognition and analytic computation through interactions. Our eigenvector centrality computation approach by using adjacency matrix of different captured analytic states through low level interactions provides a simple solution of overcoming tedious effort of qualitative approach to detect behavioural markers from sequential actions into analytic provenance dataset.
As for our future work we also aim to conduct an in-depth evaluation study with our end-users to investigate how transitions among behavioural markers can be detected as well as their influences on analytical activities. Analysis of combinations of such behavioural markers that occur during large complex task also introduces research challenges of predictive analytic goal oriented recommendation for action sequences. The inverse compositional reductionist approach can unfold the process of analysis being carried out to reach a goal. But how can such approach be applied on actual working environment, still requires further research.
Acknowledgments The research results reported here has received funding from the European Union Seventh Framework Programme FP7/2007–2013 through Project VALCRI, European Commission Grant Agreement N◦FP7-IP-608142, awarded to Middlesex University and partners.
References
Commons, M. L., Trudeau, E. J., Stein, S. A., Richards, F. A., & Krause, S. R. (1998). The existence of developmental stages as shown by the hierarchical complexity of tasks.
Developmental Review, 8, 237–278.
Endert, A., Chang, R., North, C., & Zhou, M. (2015, July–August). Semantic interaction: Coupling cognition and computation through usable interactive analytics. Published inIEEE Computer Graphics and Applications, 35(4). INSPEC Accession Number: 15305788.
Fletcher, G., Flin, R., McGeorge, P., Glavin, R., Maran, N., & Patey, R. (2004). Rating nontechnical skills: Developing a behavioral marker system for use in anaesthesia.Cognition, Technology, and Work, 6, 165–171.
Flin, R., & Martin, L. (2001). Behavioral markers for CRM: A review of current practice.
International Journal of Aviation Psychology, 11, 95–118.
Flin, R., O’Connor, P., & Crichton, M. (2008).Safety at the sharp end: Training nontechnical skills. Aldershot: Ashgate Publishing Ltd.
Fontenot, A. N. (1992). Effects of training in creativity and creative problem finding upon business people.The Journal of Social Psychology, 133(1), 11–22.
Gotz, D., & Zhou, M. X. (2008). Characterizing user’s visual analytic activity for insight prove-nance. InProceedings of the IEEE Symposium on Visual Analytics Science and Technology (VAST)(pp. 123–130).
Helmreich, R., Wilhelm, J., Kello, J., Taggart, E., & Butler, R. (1990).Reinforcing and evalu-ating crew resource management: Evaluator/LOS instructor manual. Austin: NASA/UT/FAA Aerospace Group.
Islam J., Anslow C., Xu K., Wong W., & Zhang L. (2016). Towards analytical provenance visualization for criminal intelligence analysis. InProceedings of the EGUK Conference on Computer Graphics & Visual Computing (CGVC), Bournemouth, UK.
Kang, Y.-a, Gorg, C., & Stasko, J. (2009). Evaluating visual analytics systems for investigative analysis: Deriving design principles from a case study. In Visual Analytics Science and Technology, VAST 2009. IEEE Symposium on (pp. 139–146). IEEE.
Mitchell, L., & Flin, R. (2009). Scrub practitioners’ list of intra-operative nontechnical skills-SPLINTS. In R. Flin & L. Mitchell (Eds.),Safer Surgery (pp. 67–82). Aldershot: Ashgate Publishing Ltd.
North, C. (2006). Toward measuring visualization insight.IEEE Computer Graphics and Applica-tions, 26(3), 6–9.
Pirolli, P., & Card, S. (2005). The sensemaking process and leverage points for analyst technology as identified through cognitive task analysis. InProceedings of International Conference on Intelligence Analysis(Vol. 5).
Reda, K., Johnson, A. E., Leigh, J., & Papka, M. E. (2014). Evaluating user behavior and strategy during visual exploration. InProceedings of the Fifth Workshop on Beyond Time and Errors: Novel Evaluation Methods for Visualization(pp. 41–45). ACM.
Saraiya, P., North, C., & Duca, K. (2005). An insight-based methodology for evaluating bioin-formatics visualizations.IEEE Transactions on Visualization and Computer Graphics, 11(4), 1–14.
Torrance, E. P. (1988). The nature of creativity as manifest in its testing. In R. J. Sternberg (Ed.),
The nature of creativity: Contemporary psychological perspectives(pp. 43–75). Cambridge: Cambridge University Press.
Wong, B. L. W., Zhang, L., & Shepherd, I. D. H. (2014). VALCRI: Addressing european needs for information exploitation of large complex data in criminal intelligence analysis. In:European Data Forum, Greece.
Yule, S., Flin, R., Paterson-Brown, S., Maran, N., & Rowley, D. (2006). Development of a rating system for surgeons’ nontechnical skills.Medical Education, 50, 1098–1104.
Open AccessThis chapter is licensed under the terms of the Creative Commons Attribution 4.0 International License (http://creativecommons.org/licenses/by/4.0/), which permits use, sharing, adaptation, distribution and reproduction in any medium or format, as long as you give appropriate credit to the original author(s) and the source, provide a link to the Creative Commons license and indicate if changes were made.
The images or other third party material in this chapter are included in the chapter’s Creative Commons license, unless indicated otherwise in a credit line to the material. If material is not included in the chapter’s Creative Commons license and your intended use is not permitted by statutory regulation or exceeds the permitted use, you will need to obtain permission directly from the copyright holder.