NSUWorks
CEC Theses and Dissertations College of Engineering and Computing
2013
An examination of the acceptance, adoption, and
diffusion of smartphone devices with senior
citizens.
James M. Reneau
Nova Southeastern University,[email protected]
This document is a product of extensive research conducted at the Nova Southeastern UniversityCollege of Engineering and Computing. For more information on research and degree programs at the NSU College of Engineering and Computing, please clickhere.
Follow this and additional works at:http://nsuworks.nova.edu/gscis_etd Part of theComputer Sciences Commons
Share Feedback About This Item
This Dissertation is brought to you by the College of Engineering and Computing at NSUWorks. It has been accepted for inclusion in CEC Theses and Dissertations by an authorized administrator of NSUWorks. For more information, please [email protected].
NSUWorks Citation
James M. Reneau. 2013.An examination of the acceptance, adoption, and diffusion of smartphone devices with senior citizens..Doctoral dissertation. Nova Southeastern University. Retrieved from NSUWorks, Graduate School of Computer and Information Sciences. (287)
senior citizens.
By
James M. Reneau
A dissertation submitted in
partial fulfillment of the requirements for the
Degree of Doctor of Philosophy
in
Computer Information Systems
Graduate School of Computer and Information Sciences
Nova Southeastern University
acceptable standards and is fully adequate in scope and quality to fulfill the dissertation requirements for the degree of Doctor of Philosophy.
________________________________________ _____________
Maxine S. Cohen, Ph.D. Date
Chairperson of Dissertation Committee
________________________________________ _____________
Eric S. Ackerman, Ph.D. Date
Dissertation Committee Member
________________________________________ _____________
David S. Metcalf II, Ph.D. Date
Dissertation Committee Member
Approved:
________________________________________ _____________
Eric S. Ackerman, Ph.D. Date
Dean, Graduate School of Computer and Information Sciences
Graduate School of Computer and Information Sciences Nova Southeastern University
Philosophy
An examination of the acceptance, adoption, and diffusion of smartphone devices with senior citizens.
by
James M. Reneau October 2013
This research looked at the process of the diffusion of an innovation in the context of smartphones with American senior citizens. The subject of diffusion, or spread of a technology, is a rich and varied topic with more than 60 years of research. Much of this diffusion research does not go beyond the study of the original acceptance of a new idea. An on-line and face-to-face questionnaire was used to collect data from 155 seniors on the entire process of diffusion. The questionnaire was adaptive in nature, focusing questions directly at participants based on where they were in the diffusion process.
The scope of the study was limited to two areas: 1) to verify or refute the findings of the Senior Technology Acceptance & Adoption Model (STAM) in the setting of a more diverse population of seniors and the different technology of modern smartphones than the original small population of South African seniors using mobile-phones and 2) to look at the phenomenon of discontinuance of use after adoption.
The results show that seniors exhibit a much broader range of influences, behaviors, and motivations than the STAM model showed. Confirmed
usefulness, ease of use, and other facilitating conditions play a significant role in how a technology moved from mere use to either being fully accepted or finally rejected. This research adds to the body of knowledge regarding the diffusion of technology, specifically adoption in seniors. Many existing models did not include the complete process by shortening the initial exploration and ignoring the discontinuance. These issues have been specifically addressed in a newly
proposed model, the Senior Innovation Domestication and Life-cycle Model (SIDLM).
In my life gratitude is an action word. To be truly grateful for the good things and people in your life you have to work to share them and nurture them. Education and a lifetime of learning are two things I am grateful for and I hope to share them with my students for a long time to come.
The support, encouragement, and fostering I received from Dr. Maxine Cohen, Dr. Eric Ackerman, and Dr. David Metcalf has given me examples to follow as I continue my scholarship. I am also grateful to all of the faculty at Nova
Southeastern who have helped me as I have followed my dream of earning a Ph.D.
This research would not be possible without the help of Barbara Brown, Executive Director of FIVCO Service Agency in Grayson, KY, and her senior center directors. You opened your facilities to me and treated me like family. Additional thanks go to Barb Pratt (Program Director) and all of The Golden Bears at Shawnee at State University for being so very willing to jump in and share your experience. Mary and Yvonne made sure to keep me busy collecting data and eating yummy baked goods.
To the secretaries and administrative professionals, in all of the schools in the world, you keep things going and help me to find my head some days.
And lastly, my undying gratitude to my devoted wife Nancy and wonderful daughter Anna who have put up with poverty and neglect as I have pursued this degree. Ladies, I am nothing without you.
Approval ii Abstract iii
Acknowledgments iv Table of Contents v List of Tables vii List of Figures viii List of Equations ix Chapters: 1. Introduction 1 Background 1 Problem Statement 2 Dissertation Goal 4 Research Questions 5
Relevance and Significance 6 Definition of Terms 10 Summary 12
2. Review of Literature 13 Overview 13
Technology Diffusion and Acceptance 13 Questionnaires and Data Collection 27 Summary 30 3. Methodology 31 Overview 31 Methodology 32 Questionnaire 35 Required Resources 45 Summary 47 4. Results 48 The Sample 48 Data Analysis 51 Findings 52 Summary of Results 66
5. Conclusions, Implications, Recommendations, and Summary 67 Conclusions 67
Implications 78 Recommendations 79
Appendices
A. Survey with Summary Responses 86 B. IRB Approval Memorandum 107 C. Raw Survey Responses 108 References 120
Tables:
1. Questionnaire Sections 37
2. Questionnaire Sections and Mapping to IDT and STAM 39 3. Questionnaire Sections to Deliver to Participants 39
4. Responses by Collection Method and by Age 50 5. Smartphone Knowledge and Use 54
Figures:
1. The Five Phases of the IDT 16
2. Diffusion of Innovation Curve (Rogers, 2003) 17
3. Technology Acceptance Model – TAM (Davis et al., 1989) 19 4. Unified Theory of Acceptance and Use of Technology – UTAUT
(Venkatesh et al., 2003) 21
5. Senior Technology Acceptance & Adoption Model - STAM (Renaud & van Biljon, 2008) 25
6. Flow of Questionnaire 37
7. Questionnaire Section Two - Technology 45 8. Source of Participants 49
9. Gender of Participants 50
10. Participants by Age With Comparison to 2010 U.S. Census 51 11. Computer Usage 53
12. Age Versus Smartphone Use 63 13. Income Versus Smartphone Use 64 14. Education Versus Smartphone Use 65 15. STAM with Generalization 71
16. STAM with Reexamination of Original Decision 73
17. Senior Innovation Domestication and Life-cycle Model (SIDLM) 77
Chapter 1
Introduction
Background
Senior citizens have been slower to accept smartphones as the primary mobile communication device into their daily lives than the rest of the adult population in the United States (Smith, 2011). This research looked at the
acceptance, adoption, and diffusion of this technology in their lives. Technology diffusion, with seniors, was investigated using a questionnaire to show the validity of the Senior Technology Acceptance & Adoption Model (STAM) (Renaud & van Biljon, 2008). In addition to testing the validity of the STAM, this research looked at the diffusion of an evolving technology in a dynamic population and makes recommendations for changes to the STAM. These changes included adding influences as observed; adding a process of actual acquisition of a smartphone, and adding processes to understand the confirmation and examination of a user's original decision to reject or accept a technology.
In a May 2011 survey of American adults (n=2,277), it was found that 35% of respondents stated that they had a smartphone. The adoption rate of seniors (11%, n=637) was significantly lower than that of adults aged 30-49
Chapter 1
Introduction
Background
Senior citizens have been slower to accept smartphones as the primary mobile communication device into their daily lives than the rest of the adult population in the United States (Smith, 2011). This research looked at the
acceptance, adoption, and diffusion of this technology in their lives. Technology diffusion, with seniors, was investigated using a questionnaire to show the validity of the Senior Technology Acceptance & Adoption Model (STAM) (Renaud & van Biljon, 2008). In addition to testing the validity of the STAM, this research looked at the diffusion of an evolving technology in a dynamic population and makes recommendations for changes to the STAM. These changes included adding influences as observed; adding a process of actual acquisition of a smartphone, and adding processes to understand the confirmation and examination of a user's original decision to reject or accept a technology.
In a May 2011 survey of American adults (n=2,277), it was found that 35% of respondents stated that they had a smartphone. The adoption rate of seniors (11%, n=637) was significantly lower than that of adults aged 30-49
(45%, n=581) (Smith, 2011). This difference is indicative of the widely accepted “generation-gap” in the access and use of digital technology (van Dijk, 2005).
Problem Statement
The literature on the acceptance and diffusion of technology is a rich and varied topic that has been researched for more than 60 years. A vast majority of this research has been on the positive aspects and not on the unintended or undesirable consequences of the diffusion of innovations (Sveiby, Gripenberg, Segercrantz, Eriksson, & Aminoff, 2009). This pro-innovation bias has
permeated the current research and has created a rather myopic belief that the use of technological advances are usually, if not always, better than prior ways of accomplishing the same task (Rogers, 2003).
In many of the current technology acceptance models, the subsequent discontinuance of use of a technology after the initial adoption is not integrated into them (Davis, Bagozzi, & Warshaw, 1989; van der Heijden, 2004; Venkatesh, Morris, Davis, & Davis, 2003; Renaud & van Biljon, 2008). These models, that permeate the research on technology adoption and diffusion, may lead researchers and developers into a belief that diffusion should always be faster rather than
slower, that adoption should be by all members of the social group, and that discontinuance of use should not be happening (Rogers, 2003).
This research looked at the specific social group of American senior citizens, aged 65 or older, and diffusion of a current technology (smartphones). Each of the 155 qualified participants were asked to complete a questionnaire about their knowledge and use of smartphones. Additional questions were also asked to the seniors that have decided against adopting the technology and those who have discontinued usage of the devices. All participants were finally asked questions to gain an understanding of the social and other influences upon their decision making process.
Specifically this research sought to validate the STAM (Renaud & van Biljon, 2008) in relation to a population and technology that was different than the original population and technology used to originally create the model. This research also goes on to show a need for significant changes to the STAM to account for behaviors seen in this research's collected data that extend it to include the initial acquisition of a technology and the decision to stop using a technology after they initially accepted and/or adopted the innovation.
This research, while focused on the STAM and American senior citizens, adds to the current understanding of how technology is diffused. The
populations, technologies, and models to see if similar recommendations need to be made to gain a better understanding of the entire diffusion life-cycle.
Dissertation Goal
The original goal of this research was to gain a better understanding of the STAM (Renaud & van Biljon, 2008) by testing the fit of that technology diffusion model in the context of American seniors. It was through this analysis of the entire cycle of diffusion of smartphones and associated technologies with seniors that this research shows the STAM is indeed a generalizable model to understand the adoption of new technologies in seniors. With the caveat that minor changes need to be made to STAM to better understand the process once a decision to use is made, this research's initial goal was incomplete. After measuring and
analyzing responses of 155 American seniors who are at different places throughout the diffusion process of smartphones, many changes throughout the STAM are suggested, both for the anticipated discontinuance and for other factors.
Research Questions
The following research questions guided the research.
RQ1
The STAM describes a model explaining the diffusion of mobile-phones in a population of South African seniors (Renaud & van Biljon, 2008). By relating acceptance factors to adoption stages, STAM provides an explanation as to why many elderly adults never reach the final adoption phase and never fully accept the technology. Research question number one will determine if the STAM is a valid and representative model to study technology use by seniors, particularly their adoption of smartphones in a diverse and different population (U.S. centric).
RQ2
The STAM does not explicitly address the discontinuance of use of a technology after it has been adopted. In the Innovation Diffusion Theory (IDT) (Rogers, 2003) there is a fifth phase called "confirmation" where adopters or rejecters of a technology examine their prior decision and may change their mind
based upon their current perceptions. Research question number two will see if the phenomenon of conformation and reexamination of a previous decision occurs in the research population and can it be modeled by expanding upon the STAM.
Relevance and Significance
This section discusses why this research is important by answering several questions. These questions include: (a) why the problem exists, (b) the potential benefits of solving the problem, and (c) and how this will add to the technology diffusion body of knowledge.
Why is There a Problem?
Going back to the beginning of diffusion research, there has been a significant pro-innovation bias in much of the work that has been done in the field (Rogers, 2003; Sveiby et al., 2009). This bias has been the consequence of influence by funding sources (both governmental and industry), by the focusing on successful and rapid diffusions, and by researchers selecting innovations that “look intellectually interesting” (Rogers, 2003, p. 111). This bias has influenced research in three significant ways: 1) much more research has been done and
more written about rapid and successful diffusions; 2) more study has been done about acceptance rather than rejection of new technology; and 3) many
researchers do not have a complete understanding of why technologies are discontinued (Rogers, 2003).
In addition to the pro-innovation bias as seen in many of the existing models, the population of seniors may also pose unique problems. Seniors have a special place in the social fabric of their communities and their role in that
community is changing. After decades with families, spouses, and work roles that attached them directly to so many people and institutions, this loss of
connectedness can cause isolation and disengagement from society and the changes within their community (Itzin, 1970).
This research used the context of a rapid and successful diffusion of a technology to probe more deeply into how American seniors decide to adopt a new technology. Additional questions were asked to eliminate the pro-innovation bias by looking for the rare but observable rejection and discontinuance of use. Questions were also directed to understand the importance of family, friends, and the media in the diffusion of a new technology.
What are the Benefits of Solving the Problem?
The pro-innovation bias, even though it may be justified, keeps
researchers from fully understanding the motivation and real needs of end users (Rogers, 2003). In the context of this research, the primary benefit is the suggested adjustment of the STAM to highlight the motivation of seniors when they decide to stop using an innovation in general and smartphones in specific.
More than 40 years ago, the roles of seniors was understood to be very different from younger people. Senior citizen's leisure activities, available time, financial situation, and social role are changing in society. Children and grand-children become advisors, isolation and fear may separate seniors from their communities, and physical and mental changes are reshaping the world older people live in (Itzin, 1970). These changes are continuing to evolve as more seniors are working into their 70s and their health continues to improve (“Study highlights the role of seniors,” 2007). With the dynamic nature of an aging population, technological diffusion models must be refined and targeted to address the specific needs and changing natures of seniors.
In a more general sense, beyond the diffusion of smartphones, this change will remind and encourage future researchers to ask the probing “why” questions in the diffusion of other technologies with seniors. Another benefit of this research is to remind future researchers that the decision to adopt a technology is
not a terminal one and to make changes to the STAM to reflect the dynamic reality of technology adoption.
How Will This Research Add to the Knowledge Base?
There are several areas in which this research adds to the current state of knowledge. These areas include: (a) the validation of the STAM in the context of American seniors, (b) changes to the STAM to model the discontinuance of use or the desire to reexamine the initial decision to adopt, and (c) addition to the
currently sparse literature on what happens after initial diffusion.
The STAM was originally created based on a study of South-African seniors with the diffusion of plain mobile phones, not smartphones (Renaud & van Biljon, 2008). Based upon the data collected and analyzed in this research it does appear that the STAM applies to the observed population of American seniors, as it did in the original study group.
While STAM, is valid to a point, three of the participants who completed the survey said that they previously used a smartphone, but do not currently have or use one. These individuals, almost 2% of the study population, do not fit into the STAM as there is no path from Actual Use and Acceptance to Rejection. STAM also does not account for the individual who at one point has rejected an innovation but then later reexamines their decision, in the light of new external
influences. This research makes these additions with the hope that the changes to STAM will help to make the model more generalizable in the senior community.
The heightened awareness of the phenomena of discontinuance after adoption of an innovation is the third, and probably the most important area of knowledge, that this research will add to. There has been much work in the field of diffusion but the research of why a technology is rejected subsequent to adoption has not had the same level of research (Rogers, 2003; Sveiby et al., 2009). This huge gap in the research that exists will not be filled by this single dissertation, but any new work will hopefully remind future researchers of the pro-innovation and other biases they may have. This is of vital importance not only to seniors and the STAM but to diffusion research with all groups.
Definition of Terms
Defining who qualifies as a senior citizen is complicated, as there are many definitions. The definition of a senior citizen that guides this research is that they are “an old age pensioner” (“senior citizen,” n.d.). In the U.S., there is not a single national retirement or pension age, but a majority of older Americans qualify for medical coverage under Medicare when they attain age 65 (“Getting Medicare before you get your Full Social Security Retirement Benefits,” 2008).
Medicare eligibility is a national rite-of-passage in the life of an aging individual. The original STAM research used South African seniors aged 60 and over
(Renaud & van Biljon, 2008). This research used the criteria of age 65 or older as the objective measure of whether an individual is a senior citizen.
Throughout this report, the term “technology” is used. It can best be defined as “a design for an instrumental action that reduces the uncertainty in the cause-effect relationships involved in achieving a desired outcome” (Rogers, 2003, p. 13). It is defined elsewhere as the “use of scientific knowledge to solve practical problems” (“technology,” n.d.). Rogers' definition helps to explain why individuals ask questions about the perceived value of an innovation and not only look at technology for technology's sake. A good definition of technology is: a method or device (or both) that reduces the chances of failure in performing a task (Rogers, 2003).
Diffusion, especially in the context of this research, is used to describe the spread of information about a technology and the dispersion of the technology into general use. The process of diffusion is made up of four components: 1) communication about an innovation or technology; 2) a communication channel or channels to distribute this information; 3) a time frame for the communication; and 4) a social group or system having the communication. (Rogers, 2003)
Summary
The topic of technology diffusion has been studied by researchers over decades. Many models, including several very specialized ones, have been created to help describe the acceptance and use of technologies. This research looked at a specific model that was focused on the adoption of technologies by seniors, the STAM, and tested it for validity with American seniors in the context of a different technology. Additionally, this research looked at the process of discontinuance of use caused by the continual reexamination of a previous decision to adopt, as predicted by the IDT.
The research was grounded in prior diffusion research, as discussed in Chapter 2. The questionnaire used and the on-line and face-to-face delivery method for delivery is described in Chapter 3. A summary of the results of the responses of 155 American seniors is included in Chapter 4, and in Chapter 5 significant modifications and additions to the STAM are recommended and a new model for describing technology adoption is proposed. This research adds to the body of knowledge about technology diffusion and specifically to the way seniors approach, adopt, and subsequently discontinue use of an innovation.
Chapter 2
Review of Literature
Overview
Historically seniors, as their lives and daily situations change, often experience a lack of social interaction (Itzin, 1970). This isolation can be moderated through the use of social media and e-mail. The adoption of this technology is being slowed by many seniors’ apprehension toward the technology and vendors'/designers' lack of attention to the special needs of this population (McMurtrey, McGaughey, Downey, & Zeltmann, 2010). The diffusion may also be slowed by a deficiency of direct communication about the possible benefits of the technology.
Technology Diffusion and Acceptance
Extensive research has been done to attempt to model the diffusion, adoption, and acceptance of technological innovations (Davis, 1989; Renaud & van Biljon, 2008; Rogers, 2003; Silverstone & Haddon, 1996; Venkatesh et al.,
2003). There appears to be no single perfect model to predict a person's
willingness to use a new technology. Even harder to understand is the mechanism of how an innovation is fully adopted in a social system. Most of the existing models, of which several are discussed below, were created to describe a general population, while a few of them are targeted at a specific class of individuals.
Innovation Diffusion Theory (IDT)
The Innovation Diffusion Theory (IDT) was originally described in 1962 to model the diffusion of agricultural innovations. Over the decades it has been applied to general technology diffusion and has been used as the basis for much of the research in technology diffusion (Davis et al., 1989; Renaud & van Biljon, 2008; Venkatesh et al., 2003).
A technology needs to be seen as creating an advantage, in some aspect, before it will be adopted. Additionally, no matter how good the innovation is, it needs to be communicated to potential users in a positive light. This process of communicating the advantages of an innovation between members of a social group, over a period, is known in the literature as diffusion (Rogers, 2003). A social group with communication can be as small as a single family discussing a technology over the dinner table or as large as the entire global community sharing ideas advertised through the mass media.
The IDT describes a five phase diffusion process, they are: 1) knowledge, 2) persuasion, 3) decision, 4) implementation, and 5) confirmation. Knowledge, typically gained through the mass media, is where a person learns of the existence of an innovation and what it is/does. In the persuasion phase, a person reduces the uncertainty of a technology by exploring and measuring the advantages and disadvantages in their personal context. In the decision phase, a person goes through the activities that culminate in a choice either to adopt a technology or to reject it. Implementation is the activity of initial use where the user changes their patterns to better utilize the innovation or changes the innovation, through a reinvention process, to better fit into their daily activities. Finally, confirmation is the process of strengthening or weakening the original decision made in phase three. (Rogers, 2003)
Figure 1: The Five Phases of the IDT
Typically the five phases of the IDT are drawn in a straight line or
waterfall to represent them as discrete points that a person passes through as they progress into adoption. Rogers (2003) describes each of the five phases in great detail and an important and often overlooked detail of the decision phase is that a person who rejected an innovation also enters the confirmation phase. During confirmation an individual will continue to look at an innovation and gather additional information from their social group and from their personal experience with or without the technology. This pressure of new information and experience
may cause an individual discomfort about their previous decision and cause them to reexamine their behavior. This state of irritation about a previous decision is known, in much of the research, as dissonance (Rogers, 2003).
Figure 2: Diffusion of Innovation Curve (Rogers, 2003)
The rate of adoption of a new technology typically follows an “S Curve” with one axis representing the saturation percentage in the population and the
other axis representing time. The Perl Curve (Equation 1) is a commonly used mathematical expression to represent and describe this type of behavior (Co, 1999).
y= L 1+ Ae−Bt
Equation 1: The Perl Curve
It has been seen that, typically, once an innovation has reached a
saturation point of 10 to 20% of a social group the innovation begins to diffuse on its own accord, this is called the “take-off”. Take-off may occur because the uncertainty of usefulness is diminished as the invention becomes accepted into the social framework, as users get a chance to give it a try, and as the technology becomes more visible in their lives (Rogers, 2003).
Rogers (2003) also discussed the need of researchers in this field to be cognizant of their potential to a pro-technology bias when trying to understand diffusion. He believes that this bias is a direct result of influence by change agencies and that the diffusion of successful technologies leave an easily accessible body of knowledge for researchers to study. Several strategies are covered to overcome the tendency to this biased view. They include but are not limited to: a) research earlier in the diffusion process; b) questioning the
in the context of the social group; and d) research to understand individuals' motivations for adoption, rejection, and reinvention of an innovation.
Technology Acceptance Model (TAM)
In a group of studies dating back many decades (Davis, 1989), it was shown that an individual's self-reported usefulness of a software system correlated very strongly to the same individuals saying that they would use the software if it were available to them. Ease of use was also found to correlate significantly to current use and self-predicted future usage, but it was not as strongly correlated as usefulness.
Using these findings and other sources of research, Davis developed the Technology Acceptance Model (TAM). This model as shown and validated states that a user's Behavioral Intent (BI) to use a system is a direct combination of their Attitude (A) toward using the system and their perception of Usefulness (U) of that system (Davis et al., 1989).
A limitation of the TAM is that it only looked at an organizational usage of technology. External forces like: employer and supervisor demands, feelings of other co-workers, and personal performance in the workplace have a driving effect on the entire model (Davis et al., 1989). This authoritarian requirement to use a technology, the pressures from a social group, and one's own personal motivations are also described and predicted by the earlier works of Rogers (2003).
When the desire to use a system is for self indulgence or entertainment of the user, the TAM has been shown to break down. After surveying hedonistic users of a computer system it was found that usefulness was not as strongly correlated to predicted future use as ease and pleasure derived by the usage (van der Heijden, 2004). This points to an important difference between technology systems used for pleasure and those used solely for functionality. Van der Heijden goes on to suggest that “if people reject a utilitarian system, system developers may want to add hedonic features” (2004, p. 701). Seniors typically have less restrictions on them from an external organization than most adults.
Unified Theory of Acceptance and Use of Technology (UTAUT)
In an attempt to create a more universal technology adoption model, the Unified Theory of Acceptance and Use of Technology (UTAUT) was created.
The UTAUT describes how usage is influenced by four determinants that describe the user's intent, tempered by four different demographic and environmental factors (Venkatesh et al., 2003). This model was developed by merging eight different technology use models into a single descriptive model. They are: 1) Theory of Reasoned Action; 2) the TAM; 3) the Motivational Model; 4) the Theory of Planned Behavior; 5) a model combining the TAM and the Theory of Planned Behavior 6) the Model of PC Utilization; 7) the IDT; and 8) the Social Cognitive Theory (Venkatesh et al., 2003, p. 425).
Figure 4: Unified Theory of Acceptance and Use of Technology – UTAUT (Venkatesh et al., 2003)
The UTAUT model described much of the variation in the user's intent to use a technology and appeared to do a better job than any one of the theories that
were used in the creation (Venkatesh et al., 2003). The ability to generalize this model to a more inclusive population, from the corporate environment where it was developed and tested, has not been shown.
The Domestication of Information and Communication Technologies
Another way to look at the diffusion process was proposed in the
Domestication of Technology (DOT) model (Silverstone & Haddon, 1996). This process looks more closely at the connections and feedback between the
engineering (design) of a process or an item and the actual adoption and use of the innovation (domestication). This connection happens through commodification in the marketplace. In the marketplace, it can be seen that domestication of an innovation is the direct product of a complete design and that the design is only realized by it being domesticated. This connection is like the two sides of a single coin.
The design of an object or innovation begins with actually creating the artifact. This is the original definition of the form and function of the technology. In the early life of the artifact it is an oddity to be admired, but as it matures it becomes a part of everyday life and looks toward the future innovations. Once the artifact is created the process of constructing the user begins. Images of potential users, their abilities, desires, and limitations are included in the design.
This includes limitations to the capability of the artifact to make it more
compatible with the prospective user. An example of the design limitation may be the size of a smartphone screen, it could be several feet across in measure but it would be unusable in the context of a portable and pocket sized device. The third part of design is catching the consumer. This is including the historical context of familiar technologies in an innovation so the future customer has a point of reference and connection to the technology. An example would be the red and green call buttons on an old mobile phone that are seen drawn on the screens of modern smartphones. The designers could have chosen a different paradigm but looking back at the previous technology made the touch screen innovation more palatable.
The domestication of an innovation begins when a potential user hears and starts to think about it. The domestication process goes through four phases: 1)
appropriation, 2) objectification, 3) incorporation, and 4) conversion. In the
appropriation phase of domestication the user finds out how to get information about an innovation, discovers how to get it, may experiment with it, and subsequently brings it home. This is followed by objectification where the user asks how it will be used, how it will be stored, and where it will be kept. The innovation is a thing at this point, it has not been integrated into the life of the user. The third phase is incorporation. During incorporation a user actually uses the innovation. There is regular interaction, exploration, and learning about the
features of the design and how the design will fit into the user's context. Once a technology is incorporated a user will start to apply a status of importance to the technology or device, this is conversion. A domesticated user, through
conversion, will also signal to others in their social group this importance and the need for them to consider this innovation.
Senior Technology Acceptance & Adoption Model (STAM)
Renaud and van Biljon (2008) proposed a new model called the Senior Technology Acceptance & Adoption Model (STAM) for understanding rejection, actual use, and the acceptance of a technology in a senior population. The STAM differs greatly from the TAM because this model ends with the full adoption of a technology and not just actual use of it. Another way this model is different is that external social influence is also included in the process. The STAM also uses a general structure similar to the one in the DOT model and departs from the IDT.
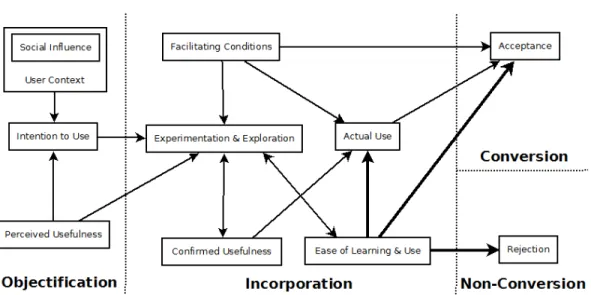
Figure 5: Senior Technology Acceptance & Adoption Model - STAM (Renaud & van Biljon, 2008)
The STAM is divided into four major phases, they are: 1) objectification, 2) incorporation, 3) conversion, and 4) non-conversion. In the objectification
phase (phase one) a person's “user context” (made up of employer pressures, social pressures, ability, and other personal factors) along with a perception that the technology may be useful drives the individual to an intention to try an innovation. In the second phase, incorporation, the user experiments with the technology and is moved to actual use through a combination of outside pressures (facilitating conditions), confirming the usefulness, and ease of use. The user may move from incorporation to either the conversion phase or the
non-conversion phase. The most significant factor in this move is the ease of use of the technology, as shown by the bold arrows in Figure 5. In conversion (phase
three) the individual has accepted the technological innovation into their personal and daily activities and have become a regular user. In the non-conversion phase an individual has moved to reject the technology and is not actually using the technology.
The concept of acceptance is a full embracing of a technological
innovation and includes more than regular use. It may include a concept known as “reinvention”. Reinvention occurs when a user self innovates with a
technology to use it in a way that was not originally communicated or described by the social group (Rogers, 2003). The user develops their own unique and new to them version or configuration of the technology and uses it in an innovative and self-discovered way.
Abraham Maslow's long standing theory of the hierarchy of needs suggests that every human is motivated by the same desires for physiological comfort, safety, love and belonging, esteem (both internal and external) and self-actualization (Maslow, 1970). Even though STAM was originally used to describe diffusion in a population of South-African seniors, the ubiquity of base human needs should allow the model to be equally applicable to other
populations.
There are a few potential issues with the original research that was used to create the STAM. Only a limited population of seniors (n=34) was interviewed using a semi-structured questionnaire. All of the participants were using mobile
phones in some manner and almost half of the individuals interviewed were between the ages of 70 and 80 (n70-80 = 16). In addition to the small sample size,
the racial and economic status of these South African seniors was not collected or reported.
A limitation found in almost all of the technology acceptance models discussed in the review (Davis et al., 1989; Davis, 1989; van der Heijden, 2004; Venkatesh et al., 2003) was that technology acceptance is a binary conclusion. With the complexity of modern systems, it is difficult to make such an absolute decision. A user may be a “power user” of some features and totally ignore other common features. The STAM only included two categories of usage: 1) adoption (actual use); and 2) acceptance (Renaud & van Biljon, 2008). In a separate study with seniors and regular mobile phones that did not explicitly offer a model for technology acceptance, three clusters of users were identified: 1) explorers; 2) basicians; and 3) minimalists (Lee, 2007).
Questionnaires and Data Collection
Several different methods have been used to collect the data used to explore technology acceptance and adoption. Four of these methods, using questionnaires, can be described as: 1) Davis's (1989) single questionnaire; 2)
Kurniawan et al., and Mahmud's (2006) start with a focus group and expand to a questionnaire; 3) Renaud and van Biljon's (2008) use of a semistructured
interview, and 4) Lee's (2007) work of refining her population.
In the research used to suggest the TAM, Davis (1989) used 12 questions, with a 1-7 Likert-like scale, on a questionnaire. This survey method tried to gain an understanding, in corporate and university settings, of: 1) usefulness; 2) ease of use; and 3) if they did use or would they use the software if it were available. The four questions in each of the three areas were selected and refined from a larger list of questions. The reliability (internal consistency) of the questions were tested by calculating the Cronbach's Alpha (Equation 2) which is a ratio of the sum of the variance between the questions and the variance of the total instrument (Bland & Altman, 1997).
a=( k k−1)(1−
∑si2
sT
2 )
Equation 2: Chronbach's Alpha
Kurniawan, et al. (2006) used a two-prong approach in trying to gain an understanding of older people's use and issues with mobile phones. They used a combination of qualitative and quantitative methods. First, a focus group was held with a total of seven participants and they were asked open-ended questions to elicit conversations about problems, benefits, and desired features in mobile phone technology. After the focus group, the researchers created a qualitative
instrument to balance and more broadly validate and understand what was learned. An on-line questionnaire with Likert-like questions was distributed and 100 seniors participated in the survey.
In the research leading to the creation of the STAM, a process of interviews were conducted with a small group (n=34) of participants that were current users of mobile phones (Renaud & van Biljon, 2008). The researchers followed a script to give the interview a structure and to collect the data. The interview was broken into four sections; 1) demographics, 2) five use scenarios, 3) questions about acceptance factors, and 4) a brief prototyping scenario. There was originally a fifth exercise where the participant was asked to recall the specific combination of button presses to accomplish certain tasks, but it was abandoned as too difficult to administer and potentially of no value. (Renaud & van Biljon, 2008)
Other research using more than one questionnaire/survey instrument reversed the order used by Kurniawan et al. (2006). Lee (2007) used a widely distributed questionnaire, in a first phase, to gain an understanding of usage, quality, and how they acquired the technology. In a second phase, she selected a small group of representative respondents and interviewed them to collect usage stories, discuss barriers to technology, and provide recommendations for future change.
Summary
As seen in this literature review, there are many models for describing technology diffusion. Origins for much of this work can be dated back to the 1950s and were originally used to describe the adoption of agricultural
innovations (Rogers, 2003). New technology and the understanding that various populations of individuals react in a different manner have necessitated the need for more research and refinement of the original models.
Chapter 3
Methodology
Overview
The research questions that drove this work attempt to answer: 1) if the STAM is a valid and representative model to study technology use by American seniors with a different technology than was used to originally define the model; and 2) if the phenomena of discontinuance does occur and needs to be added to the STAM. The methodology used to answer these research questions was to survey American seniors about their motivations, adoption, and use of
smartphones. Data collection was accomplished using a computer-based questionnaire with adaptive delivery of sections to specifically address where a participant is on the diffusion curve. The actual delivery was completed independently on-line and face-to-face with senior citizen groups.
Methodology
Several questions were asked during the development of the survey instrument used in this research. These questions were: (Groves et al., 2009)
1. What target population is being studied?
2. What specific properties can be used to identify that an individual could be included in the survey (sampling frame)?
3. If the sampling frame is too large to survey all members how will the final sample be selected?
4. How will the data be collected?
5. Will the survey be of a limited or unlimited duration.
The “sampling frame” for this research was defined as an individual living in a U.S. state or territory who is 65 years old or older. The first two questions of the survey asked a participant their age and residency. The questionnaire delivery software automatically limited participation to only those individuals who self-identified into the desired group.
With the U.S. senior population exceeding 40 million individuals aged 65 or older (Werner, 2011), it would be impossible to survey all of them. Some type of sampling process will be required. A true random sampling would not have been possible because of the voluntary nature of this research and the difficulty of
getting an accurate listing. This research used a convenience sampling of seniors to complete the questionnaire (Appendix A).
The initial participants were identified by face-to-face, email, and social media solicitation of contacts of the researcher. A personal appeal to be a
participant or to suggest participation of friends and family was made. A total of 42 participants of the 155 responses collected were received this way. The remaining 113 participants were approached one-on-one in senior citizens' centers and in a local senior outreach program. All of the face-to-face participation was collected in the Kentucky counties or Greenup, Boyd, Lawrence, Carter, and Elliot and in the Ohio county of Scioto.
The questionnaire was made available on-line until 155 valid and complete responses were collected. The target minimum survey size was
calculated at 150 responses. This target survey size was estimated by identifying a reasonable acceptable error of 5% ( e ), a confidence of 95% (1.96) ( Zα /2 ),
and an estimation of the standard deviation of ( S ) for a population. With these, a sample size can be calculated by solving the Confidence Interval equation (below) for n , where the population size is represented by N and satisfying the acceptable error (Lohr, 2010).
e=Zα /2
√
1− nN S
√
(n)According to Lohr (2010), when a single proportion of a population is of great interest to the researchers it is often advisable to find a sampling size that reflects the desired error and confidence on that ratio ( p̂ ). A common estimation for the standard deviation of a binomial probability for large
populations can be found using S2≈ ̂p(1− ̂p) . Combining the two formulas
for a large population and solving for sample size ( n ), a simplified sample size formula is created.
n=Zα /2 2̂p(1− ̂p)
e2
Equation 4: Sample Size
Using the sample size formula and the proportion that 11% of U.S. seniors have smartphones (Smith, 2011), the target minimum was calculated.
Additionally by solving the sample size formula for confidence ( Zα /2 ), given
the actual sample size of n=155 , a confidence percentage of 95.3% is derived. The questionnaire (Appendix A) was delivered using the Limesurvey software system. The Limesurvey is a free, open-source, server-based, and Web browser presented system for development of surveys, questionnaires, and other applications that require users to fill in data and respond to questions (Limesurvey,
2013). A computer-based survey mechanism was selected because of the
complexity of the survey used. The survey asked a series of focused questions to individuals in each of the five categories: 1) those with little or no knowledge about the technology; 2) those who had looked into the technology; 3) those that had decided against adoption; 4) those that were current users and 5) lastly those that had discontinued usage.
It was a concern that the Web browser and on-line delivery may bias the results by skewing the participation towards individuals who are more
technologically proficient. This risk was accepted and was not a significant factor, as seen in the analyzed data.
Questionnaire
The questionnaire was distributed to a general senior population and asked basic demographic questions and the participants' knowledge and use patterns of smartphone technologies. At this point in the survey, a participant would be grouped into one of five categories based on their current knowledge and use of smartphones. These participants could be described as: 1) knowing little or nothing about the technology (NOK); 2) curious about what the technology can do for them (KNO); 3) individuals who have considered the technology but
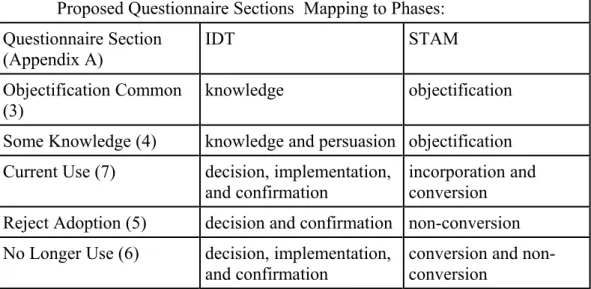
decided against using it (REJ); 4) currently using the technology (USE); and 5) people who have used the technology in the past but have decided to discontinue the use (DIS). Each of these five types of participants map into the phases of the IDT and STAM as shown in Table 1.
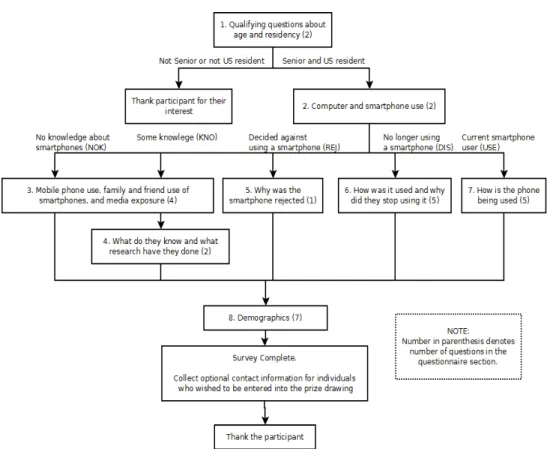
The questionnaire (Appendix A) had a total of 28 questions in eight sections. Early in the questionnaire, question 4, the participants were asked to choose a “statement that best describes your use and knowledge of smartphones and their features.” Based upon their selection only specific sections from the remainder of the questionnaire was presented. Participants answered 12 to 17 questions to complete the survey depending upon where they were in the adoption process. Once they had completed the survey they were asked to optionally enter their contact information for entry into the thank-you prize drawing.
Section Questionnaire Section Title # of Questions
1 Participant Qualifications (All Participants) 2
2 Technology (All Participants) 2
3 Objectification – Common (KNO & NOK) 4
4 Objectification – Knowledge (KNO) 2
5 Reject Innovation (REJ) 1
6 Discontinue After Previously Adopting (DIS) 5
7 Use (USE) 5
8 Demographics (All Participants) 7
Table 1: Questionnaire Sections
Questionnaire Section One: Participant Qualifications
The first two questions presented asked current age and country of residence to potential participants. Individual participation was based on the answer to these two qualifying questions. Only seniors (age 65 and above) who were residents of the United States were allowed to continue. Individuals who did not meet the qualifications were taken to a Web page to thank them for their interest in the study and inform them that they do not qualify as subjects.
Questionnaire Section Two: Technology
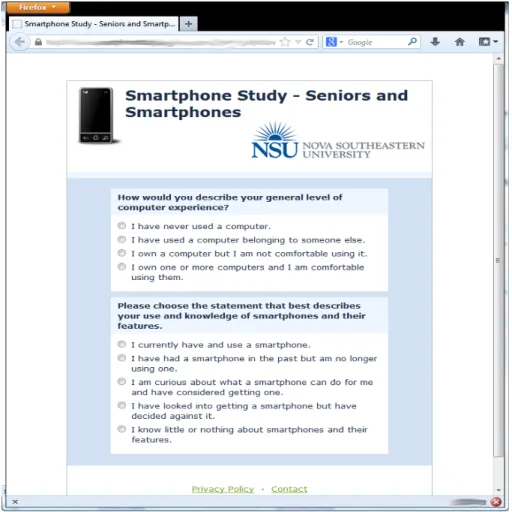
This section was asked to all qualifying individuals and consisted of two questions. The first question in this section “How would you describe your general level of computer experience?” is taken directly from the research by Renaud and van Biljon (2008, p. 218) and was asked to gauge the participant’s comfort with technology adoption in a more general context. The second question asked the participant to personally rate their level of knowledge of smartphones and their current use status. The response to the second question was used to select which of the subsequent questionnaire sections were to be delivered.
Proposed Questionnaire Sections Mapping to Phases: Questionnaire Section (Appendix A) IDT STAM Objectification Common (3) knowledge objectification
Some Knowledge (4) knowledge and persuasion objectification Current Use (7) decision, implementation,
and confirmation
incorporation and conversion
Reject Adoption (5) decision and confirmation non-conversion No Longer Use (6) decision, implementation,
and confirmation
conversion and non-conversion
Table 2: Questionnaire Sections and Mapping to IDT and STAM
Please choose the statement that best describes your use and knowledge of smartphones and their features.
Sections to Deliver 1 2 3 4 5 6 7 8 9 I currently have and use a smartphone - Adoption
and Current Use (USE)
Y Y Y Y Y
I have had a smartphone in the past but am no longer using one - Adoption But No Longer Use (DIS)
Y Y Y Y Y
I am curious about what a smartphone can do for me and have considered getting one - Some Knowledge(KNO)
Y Y Y Y Y Y
I know little or nothing about smartphones and their features - No Knowledge (NOK)
Y Y Y Y Y
I have looked into getting a smartphone but have decided against it - Reject Adoption (REJ)
Y Y Y Y Y
Questionnaire Section Three: Objectification (Common)
This section contained four questions that were asked to individuals who have not adopted (used) a smartphone and have not rejected use (NOK & KNO). These individuals are in the earliest phases of technology adoption. In Roger's IDT model, users at this point in adoption are said to be in either the
“Knowledge” and/or “Persuasion” phases (Rogers, 2003). Individuals who are at this point in the adoption model are said to be in the “Objectification” phase of the STAM (Renaud & van Biljon, 2008). Specifically, this section asked about the current use of a non-smart mobile phone, media exposure to smartphones, smartphone usage in the participant's social group, and communication about smartphones with members of their social group.
Questionnaire Section Four: Objectification (Some Knowledge)
This section extended the questioning from section three and added two additional questions for participants who have expressed that they have some knowledge about smartphone technologies (KNO). These users, while still in the STAM's “Objectification” phase, have started to explore the possibility of
adoption or are feeling significant social pressures to adopt. The IDT refers to these internal and external forces to adopt as the “Persuasion” phase (Rogers,
2003). These questions asked if the participant had personally examined a smartphone in a store or other buying situation and what were their perceptions of the usefulness of the various classes of applications that are available.
Questionnaire Section Five: Reject Innovation
Section five of the questionnaire asked only one question to individuals who have considered adoption of the smartphone technology but who have decided not to adopt (REJ). The participant was asked to pick the reasons, or to add their own reason, that most influenced their decision to not adopt the
technology at the present time. These reasons were grouped into three categories in the analysis. They are: 1) technological; 2) social, and 3) financial motivations.
In the IDT, these participants have entered the “Confirmation” phase of the model, as soon as a decision was made to not adopt. As conditions change and information is gained, a user may reexamine their decision (Rogers, 2003). In the STAM these users have entered into the “Non-Conversion” phase of the model (Renaud & van Biljon, 2008) and there is no explicit path to reexamine the rejection.
Questionnaire Section Six: Discontinue After Previously Adopting
In the IDT model, once an individual makes the decision to adopt using a technology and acts upon that decision they have entered the “Confirmation” phase, just like the individual who had rejected the technology without previously adopting (Rogers, 2003). In the STAM, once a user makes the decision to
actually use a technology in the “Incorporation” phase or to accept a technology in the “Conversion” phase, there is no defined path to subsequently reject or discontinue use (Renaud & van Biljon, 2008).
This section asked five questions to collect information about the motivation of these users who gave up the innovation (DIS). The participants were asked about how they used the technology, why they originally adopted the technology, what were their motivations for discontinuing use, and how long they used the innovation before discontinuing use.
Questionnaire Section Seven: Use
Section seven contained five questions and was directed to individuals who made the decision to adopt the smartphone and were presently using one in their daily lives (USE). In the STAM, these users are either in the “Actual Use” part of the “Incorporation” phase or have fully moved into “Conversion” by
accepting the technology (Renaud & van Biljon, 2008). In the IDT, these current users are in the same “Confirmation” phase as the individuals who reject or discontinue use of an innovation.
This section asked questions about the frequency of use of the various classes of applications, how long they have been using the device, how they acquired the device, and the motivations to originally adopt. They were also asked if they would make the same choice to adopt if they had to do it over today.
Questionnaire Section Eight: Demographics
It is a common questionnaire technique, recommended by several sources (Narins, 1995; “Smart Survey Design,” 2011), that the collection of demographic information be completed toward the end of a survey. It is hypothesized that these questions, including ones about income and education, can be sensitive to individuals. It has been seen that if these questions are asked too close to the beginning of the questionnaire it is more likely to be aborted. The demographics section asked seven questions each with the option to not disclose the information to ascertain household income, personal education, marital status, and the size of the community where the participant lives.
Questionnaire Wrap Up
Once the questionnaire was completed, the on-line participant was taken to a page with a message expressing the gratitude of the researchers and inviting the individual to register for a drawing for an optional “Thank You” prize. The user who wished to stay anonymous could elect to not enter their information. The optional contact information was emailed to the researcher by a simple Web server script and the information was not maintained on the server.
Participants who completed the questionnaire on the researchers' laptop were not directed to the Web site but were asked if they wanted to be entered into the prize drawing. If they wished to be entered their name and contact
information (usually phone number) was written on a piece of paper and stored in a folder with the researcher. For these participants the contact information was not collected electronically.
Questionnaire Presentation
The questionnaire was presented in a Web browser one section at a time. The process also allowed a participant to move back to a previous section to review and possibly change their answers. This functionality was one of the many features of the Limesurvey software system used.
Figure 7: Questionnaire Section Two - Technology
Required Resources
Resources can be divided into two broad categories: 1) fiscal and 2) human. Fiscal resources include financial and computing resources, where human resources include the individuals that responded to the questionnaire.
The Web and database server for the on-line delivery was accomplished with a "shared hosting" account from the Web service provider GoDaddy. This hosting space was donated to the researchers by RENEJM Enterprises, Inc. The questionnaire was served using the MySQL and Limesurvey (2.00+ 130311) software applications. The Web site with introductory text and a link to the survey was created and maintained using the phpSQLiteCMS (2.04) content management system.
The off-line version of the questionnaire, that was presented on a laptop for use in the senior citizens centers, ran on an older dedicated laptop running Windows 7 Professional, the Apache HTTP server (2.4.4), PHP (5.4.12), MySQL Server (5.6), and Limesurvey (2.00+ 130311).
The tools used in the creation and delivery of the questionnaire, including: Apache HTTPD, PHP, MySQL, phpSQLiteCMS, and Limesurvey are open-source. They were licensed for this research under the GNU General Public License, the Apache License, and the PHP License. All of these licenses are approved by the Open Source Initiative's License Review Process (Open Source Initiative, n.d.).
The human resource of participants was initially found by emails to individuals associated with the researcher and by social media posts asking for help with this research. Additional participants were found by soliciting responses in area senior centers and senior organizations.
Summary
The objectives of this study were to gain a current view of the technology adoption of American senior citizens and smartphones and to test the two research questions against this collected data. This was accomplished by surveying 155 American seniors about their knowledge and use patterns of smartphones. This research goes beyond much of the previous research into adoption of technology by specifically looking at the process of reexamination of the initial decision to adopt and the subsequent discontinuance of use.
Chapter 4
Results
The results, as summarized in this chapter, show that there is a large variety of experiences in the senior community regarding technology diffusion. The population sampled in this research consisted of 155 economically,
educationally, and chronologically varied individuals. Their experiences with smartphones are summarized in the Data Analysis which is divided into four sections: 1) individuals with little or some knowledge; 2) individuals who have rejected the technology; 3) current users; and 4)individuals who have
discontinued use. Each of these sections describe the findings of one or more categories of participants as described in the Methodology chapter.
The Sample
The sample for this research consisted of a volunteer sample of American adults aged 65 and older. Their responses were collected through on-line
solicitation and questionnaire and in face-to-face situations. The participants reported residences in seven states with Kentucky being the residence of a
majority (68%, n=106) of participants. A minority of responses (27%, n=42) of them were collected on-line and the remaining 113 were collected face-to-face with seniors, as shown in Figure 8.
The participants in this research were weighted more female (61%, n=94) than male (39%, n=61). According to the 2010 U.S. census of the adult
population 65 and older a similar ratio is seen in the general public, 56.9% female versus 43.1% male (Werner, 2011), so this phenomenon is not unexpected.
Figure 8: Source of Participants
42 42 113 113 Source of Participants (N=155) On-Line Face to Face
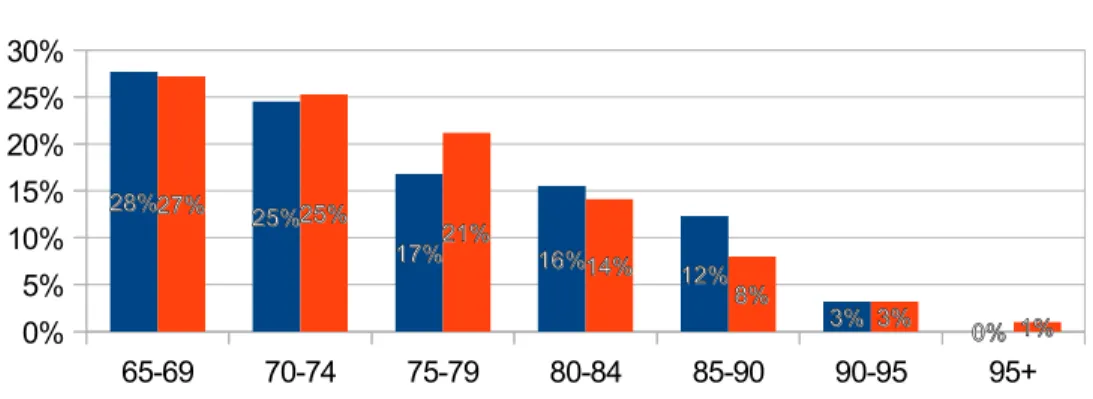
Participant ages ranged between 65 and 93, with each 5 year age bracket being smaller that the last. By comparing the population of this survey to the 2010 U.S. Census we see, in Figure 10, it can be seen that the population used in this research is similar in age composition to the general public. The oldest participant's response was collected in one of the senior center site visits, while the oldest on-line response came from an 87 year old male.
65-69 70-74 75-79 80-84 85-89 90-94 95+ Total
On-line 21 12 6 2 1 0 0 42
Face-to-face 22 26 20 22 18 5 0 113
Table 4: Responses by Collection Method and by Age Figure 9: Gender of Participants
9494
6161
Gender of Participants (N=155)
Female Male
Data Analysis
The questions on the survey fell into two general categories: 1) those with a list of choices that can be converted into a nominal scale; and 2) those that ask for a selection of one or more ordinal responses. The questions that asked a participant about their education, income, friends and family usage, media exposure, application knowledge/use, and others were presented with selectable options representing a range of numeric values. This grouping of values into a single possible response was done to simplify the questionnaire and have been converted back to nominal values in the analysis. Special care has been taken in the assignment of these nominal values to best represent the value of the
Figure 10: Participants by Age With Comparison to 2010 U.S. Census
65-69 70-74 75-79 80-84 85-90 90-95 95+ 0% 5% 10% 15% 20% 25% 30% 28% 28% 25% 25% 17% 17% 16%16% 12% 12% 3% 3% 0% 0% 27% 27% 25%25% 21% 21% 14% 14% 8% 8% 3% 3% 1%1% Participants by Age (N=155)
grouping. On questions with responses with an ordinal assignment, a direct conversion to a nominal value for analysis is not recommended or done. This nominal assignment of a value followed by a simple mean and standard deviation analysis may show some insight (Allen & Seaman, 2007) but may misrepresent the nature of the respondents' choice. These ordinal response questions are presented as counts and ratios of individuals in each of the categories, grouping of these counts, and the relationship between these counts. Many of the questions with ordinal responses included a place for participants to type in a free form response if one of the existing responses was not satisfactory. Few participants took advantage of this capability.
Findings
In this section, each of the five user groups will be analyzed and discussed based on their answers to the questionnaire sections that were presented to them. The first section was presented to all users and asked two questions about
technology. The first question asked about computer usage and the second asked about smartphone use and knowledge. The second question was used to select the remaining sections of the questionnaire that were presented.
In the survey population a majority of seniors, 63% (n=97), have
computers in their homes, and 39% (n=61) have one or more computers in their household and are comfortable using them. In a recent survey it was found that 53% of American adults 65 and older use the Internet or email (Zickuhr & Madden, 2012). It was also seen that 37% of them are on-line in a typical day (Zickuhr & Madden, 2012). The computer usage question in this research was much less detailed than the questions asked by Zickhur and Madden in their research but the findings are strikingly similar.
The second question in the technology section asked seniors to choose a statement that best described their use and knowledge of smartphones and their
Figure 11: Computer Usage
42 42 16 16 36 36 61 61
How would you describe your general level of computer experience? (n=155)
I have never used a computer.
I have used a computer belonging to someone else.
I own a computer but I am not comfortable using it.
I own one or more computers and I am comfortable using them.
features. The five choices, the number of respondents, and the code associated with each of the choices are shown in the table below. This question was used to target specific questions about exposure, knowledge, use patterns, and
motivations to the participants. The questionnaire results are broken down and discussed in four categories of responses: 1) those with little or some knowledge about the technology; 2) those who have considered the technology but have decided against adoption; 3) those who are currently using the technology; and 4) those individuals who had adopted the technology but are not currently using it.
Choice n % Code
I currently have and use a smartphone. 24 15% USE
I have had a smartphone in the past but am no longer using one.
3 2% DIS
I have looked into getting a smartphone but have decided against it.
14 9% REJ
I am curious about what a smartphone can do for me
and have considered getting one. 15 10% KNO
I know little or nothing about smartphones and their features.
99 64% NOK
Total 155 100%