Received 13 Mar 2016|Accepted 25 Aug 2016|Published 11 Oct 2016
Ground-state oxygen holes and the metal–insulator
transition in the negative charge-transfer rare-earth
nickelates
Valentina Bisogni
1,2, Sara Catalano
3, Robert J. Green
4,5, Marta Gibert
3, Raoul Scherwitzl
3, Yaobo Huang
1,6,
Vladimir N. Strocov
1, Pavlo Zubko
3,7, Shadi Balandeh
4, Jean-Marc Triscone
3, George Sawatzky
4,5& Thorsten Schmitt
1The metal–insulator transition and the intriguing physical properties of rare-earth perovskite nickelates have attracted considerable attention in recent years. Nonetheless, a complete understanding of these materials remains elusive. Here we combine X-ray absorption and resonant inelastic X-ray scattering (RIXS) spectroscopies to resolve important aspects of the complex electronic structure of rare-earth nickelates, taking NdNiO3 thin film as representative example. The unusual coexistence of bound and continuum excitations observed in the RIXS spectra provides strong evidence for abundant oxygen holes in the ground state of these materials. Using cluster calculations and Anderson impurity model interpretation, we show that distinct spectral signatures arise from a Ni 3d8 configuration along with holes in the oxygen 2pvalence band, confirming suggestions that these materials do not obey a conventional positive charge-transfer picture, but instead exhibit a negative charge-transfer energy in line with recent models interpreting the metal–insulator transition in terms of bond disproportionation.
DOI: 10.1038/ncomms13017 OPEN
1Research Department Synchrotron Radiation and Nanotechnology, Paul Scherrer Institut, CH-5232 Villigen PSI, Switzerland.2National Synchrotron Light Source II, Brookhaven National Laboratory, Upton, New York 11973, USA.3Department of Quantum Matter Physics, University of Geneva, 24 Quai Ernest-Ansermet, 1211 Geneva 4, Switzerland.4Department of Physics and Astronomy, University of British Columbia, Vancouver, British Columbia, Canada V6T 1Z1. 5Quantum Matter Institute, University of British Columbia, Vancouver, British Columbia, Canada V6T 1Z4.6Beijing National Laboratory for Condensed Matter Physics, and Institute of Physics, Chinese Academy of Sciences, Beijing 100190, China.7London Centre for Nanotechnology and Department of Physics and Astronomy, University College London, 17-19 Gordon Street, London WC1H 0HA, UK. Correspondence and requests for materials should be addressed to V.B. (bisogni@bnl.gov) or to T.S. (email: thorsten.schmitt@psi.ch).
T
he intriguing perovskite nickelates family ReNiO3 (with Re¼rare-earth)1–4 have garnered significant research interest in recent years, due to the remarkable properties they exhibit. These include a sharp metal to insulator transition (MIT) tunable with the Re radius2, unusual magnetic order5and the suggestion of charge order6 in the insulating phase. While ReNiO3single crystals are very hard to synthesize, causing earlier experiments to be mainly restricted to powder samples, extremely high-quality epitaxial thin films can be now produced. As an additional asset, ReNiO3 in thin film form can exhibit even richer properties compared to bulk, for example, tunability of the metal–insulator transition by strain7,8, thickness9–11 or even by ultrafast optical excitation of the substrate lattice degree of freedom12. In addition, there has been a lot of interest in nickelate-based heterostructures, motivated on one hand by theoretical predictions of possible superconductivity13, and on the other hand by recent observations of exchange bias effects14and modulation of the orbital occupation due to strain and interface effects15–18.The origin of the rich physics behind these unique properties is complicated by the usual electron correlation problem of transition metal oxides19. As a consequence, a full understanding of the mechanism driving the MIT in ReNiO3remains elusive still today. Hampering the discovery of a universally accepted description of the MIT is the more fundamental problem of understanding the ReNiO3 electronic structure and the corresponding Ni 3dorbital occupation.
In Fig. 1, we illustrate in a schematic representation of the single-electron excitation spectra how different electronic configurations can result from the two possible regimes of the effective charge-transfer energy D0 (called for simplicity charge-transfer energy throughout the text). Using formal valence rules, it is expected that the Ni atoms exhibit a 3d7 (Ni3þ) character, likely in a low spin (S¼1/2) configuration. This ground state (GS) is obtained in Fig. 1a for D040. However, high-valence Ni3þ systems are rare, and although many studies indeed view ReNiO3 as conventional positive charge-transfer compounds yet with the addition of a strong Ni–O covalency and consequently a GS configuration of the type of aj3d7i þb
3d8L
j i (where L is an O 2p hole)1,20–23, mounting evidence suggests that the ground state disobeys conventional rules. Alternatively, a negative charge-transfer situation24,25, where a finite densitynof holesLnis self-doped into the O 2pband and Ni takes on a 3d8 configuration (that is, Ni 3d8Ln), is recently receiving an increasing interest. This scenario is represented in Fig. 1b forD0o0. Notably, the negative charge-transfer picture is at the base of recent charge or bond disproportionation model theories where, as first suggested by Mizokawa26, the disproportioned insulating state is characterized by alternating Ni 3d8(n¼0) and Ni 3d8L2(n¼2) sites arranged in a lattice with a breathing-mode distortion27–30. These models distinctively differ from the more traditional charge-disproportionation ones where the Ni 3d7lattice moves towards an alternation of Ni 3d6
and 3d8sites in the insulating phase6,31–34.
To get a full understanding of the MIT and of the unique physical properties of the rare-earth nickelates, it is crucial to investigate the ground-state electronic structure in this class of materials. To this purpose, we stress that while both positive and negative charge-transfer interpretations introduced above can be described as highly covalent, there are striking inherent differences between the two. For the former16,20,21,32,34, the GS
aj3d7i þbj3d8Li can be modelled as a Ni 3d7 impurity hybridizing with a full O 2pband. Here the primary low-energy charge fluctuations that couple to the GS in first order are the ones from the O 2pto the Ni 3d7impurity, mixing in some Ni 3d8Land higher-order character into the wavefunction. However,
for the negative charge-transfer case19,25–30, all Ni sites assume a 3d8 state with on average n¼2 holes in the six oxygens coordinating a central Ni ion. This case is more aptly modelled by a Ni 3d8impurity hybridizing with a partially filled O 2pband. The electronic structure and consequently the character of the gap are vastly different in the two scenarios:aj3d7i þbj3d8Li with a O 2p–Ni 3d-like gap or 3d8Lnwith a O 2p–O 2p-like gap (refer to Fig. 1a,b, respectively).
Here we combine two X-ray spectroscopies, namely X-ray absorption (XAS) and resonant inelastic X-ray scattering (RIXS) at the Ni L3-edge, to resolve if the electronic structure of ReNiO3 follows a positive or negative charge-transfer picture. While the XAS results are similar to those previously reported, the first ever measurements of high-resolution Ni L3 RIXS on NdNiO3 provide crucial insights into the nature of the excitations present.
d7 Ground state Ground state ′ > 0 ′ < 0 w w+W 2 Ni 3d band Unoccupied band Occupied band Insulating case Ligand L band W U U d7 d7 L0 L1 Ln Ln+1 Ln Ln–1 d6 d8 Ln d8 d7 d8 d9 EF EF –′ d8 ′ ′ = – a b
Figure 1 | Single-electron excitation spectra in terms of charge removal and charge addition.This sketch introduces conventional parameters used to describe charge dynamics in transition metal oxide (TMO) compounds with formal 3d7filling: (1) charge-transfer energyD: energy cost for transferring an electron/hole from theLband to the Ni 3dband (with respect to the band centre of mass); (2)Hubbard U: energy cost needed to remove an electron from the occupied 3dband and to add it to the unoccupied 3dband; (3) effective charge-transfer energyD0: key parameter
to distinguish between the two different regimes discussed here.D0is
defined by the equation in the figure, starting fromD. This figure identifies the ground state (GS) and the gap character obtained for twoD0regimes:
(a)D040. In conventional positive charge-transfer compounds the lowest
energy removal states are ligand based, and the lowest energy addition states are transition metal based, leading to a charge-transfer derived energy gap (O 2p–Ni 3dlike) and a 3d7GS. (b)D0o0. In negative
charge-transfer compounds, one hole per Ni is doped into the ligand band, giving a density of ligand holesn,Ln. The GS is here Ni 3d8Ln. The red-dashed contour bands are a cartoon-like demonstration of the opening of the gap in the mainly O 2pcontinuum resulting in the metal to insulator transition. In this case, the lowest energy removal and addition states are both ligand based, leading to an O 2p–O 2plike gap. Under no circumstances can this type of gap result from configurationa, unless active doping is considered. Note that this figure neglects Ni–O hybridization, to provide clear distinction between the regimes.
The unusual coexistence of bound and continuum contributions across the narrow Ni L3resonance and the specific nature of the orbital excitations, allows us to verify that the electronic ground state contains abundant O 2p holes and that the Ni sites are indeed best described as Ni 3d8Ln, rather than a low spin Ni 3d7, showing that the ReNiO3are indeed self-doped, negative charge-transfer materials. Further, the RIXS spectra exhibit a clear suppression of the low-energy electron–hole pair continuum in the insulating phase, providing not only a fingerprint of the opening of the insulating gap at ToTMI but also experimental evidence of the dominant O 2p-character for the states acrossEF, as expected for a negative charge-transfer system.
Results
Bulk-like NdNiO3 thin film. Several high-quality NdNiO3thin
films grown on a variety of substrates were investigated. Epitaxial films were prepared by off-axis radiofrequency magnetron sputtering8,9,35,36 and were fully characterized by X-ray diffraction measurements, atomic force microscopy, transport and soft X-ray scattering measurements. In the following, we will focus on 30 nm thick NdNiO3 film grown on (110)-oriented NdGaO3 substrate under tensile strain conditions (þ1.6% of strain) as a representative example of bulk ReNiO3in general. In this case, coupled metal–insulator and paramagnetic-to-antiferromagnetic transitions have been found at TB150 K, consistent with the corresponding bulk compound1.
Bound and continuum excitations across Ni L3resonance. XAS
and RIXS measurements were carried out by exciting at the Ni L3 edge, corresponding to the 2p3/2 to 3d electronic transition at around B852 eV. The XAS spectra have been acquired in the partial fluorescence yield mode, by integrating the RIXS spectra for each incident photon energyhninto insure the bulk sensitivity. Figure 2a–c presents an overview of XAS and RIXS data for
the 30 nm thick NdNiO3 film, measured at both 300 K
(metallic phase, red colour) and at 15 K (insulating phase, blue colour). The Ni L2,3XAS shown in Fig. 2a is in good agreement with the previously published data on NdNiO3(refs 20,21,37–39). At 15 K, the Ni L3 region of the XAS (from 850 to 860 eV), is characterized by two clear structures—a sharp peak at 852.4 eV (A) and a broader peak at 854.3 eV (B)—both of which are present in other ReNiO3as well1,16,20,24. At 300 K both peaks are still recognizable, however, their separation is less evident.
A series of high-resolution RIXS spectra have been recorded across the Ni–L3 resonance in steps of 0.1 eV, as shown in the intensity colour maps of Fig. 2b,c. Each spectrum obtained for a specifichninmeasures the intensities of the emitted photons as a function of the energy loss hn¼hnin-hnout, where hnout is the outgoing photon energy. RIXS is able to simultaneously probe excitations of diverse nature, for example, lattice, magnetic, orbital and charge excitations40,41. In addition, one can distinguish with RIXS between localized, bound excitations and delocalized excitations involving continua. For localized electronic excitations, the RIXS signal appears at a fixedhnwhile scanninghninacross a corresponding resonance (Raman-like behaviour). Conversely, for delocalized electronic excitations involving continua, the RIXS signal has a constant hnout and therefore presents a linearly dispersing energy loss as a function of hnin (fluorescence-like behaviour)40–43.
From the RIXS maps of the NdNiO3thin film in Fig. 2b,c one directly observes a clear, strong Raman-like response at around 1 eV of energy loss when tuning hninto the XAS peak A. These atomic-like dd-orbital excitations, which are sensitive to the local ligand field symmetry, behave similarly to those observed in other oxide materials like the prototypical Ni 3d8 system NiO44.
A fluorescence-like contribution resonates instead at the XAS peak B, contrary to the Raman-like response dominated by multiplet effects observed in NiO at the corresponding Ni L3XAS shoulder44. Already by looking at the colour map, this fluorescence-like spectral signature is clearly visible all across the Ni L3-edge and always with a linearly dispersing behaviour, as suggested by the red-dotted line overimposed to the data. Interestingly, the fluorescence intensity distribution in the NdNiO3RIXS map has also a strong temperature dependence, while at 300 K it merges continuously with thedd-excitations (Fig. 2b), at 15 K a dip in intensity is created corresponding to the incident photon energy C, hnin¼853 eV (see Fig. 2c, dashed grey line).
10 Intensity (a.u) 5 0 850 7 6 5 4 3 2 1 0 851 852 853 A B T=300 K T=15 K 854 Photon energy (eV)
A A C B T=15 K C B T=300 K CT FI dd dd CT FI
Photon energy (eV)
Energy loss (eV)
7 6 5 4 3 2 1 0
Energy loss (eV)
855 856 857 858 850 851 852 853 854 855 856 857 858 850 851 852 853 854 855 856 857 858 a b c
Figure 2 | Overview of XAS and RIXS measurements for a 30 nm NdNiO3 film on NdGdO3.(a) Ni L3,2XAS measured in partial fluorescence yield
mode at 300 K (metallic phase) in red and at 15 K (insulating phase) in blue. Refer to Supplementary Note 2 and Supplementary Fig. 2 for XAS in total electron yield mode. (b,c) RIXS intensity map measured across the Ni L3edge at 300 K (15 K); intensity scale bar from 0 to 5 (a.u.). The white
solid line displays the XAS measured at the same temperature. The letters A, B and C mark the three different incident energies mentioned in the text, whiledd,CTandFlrefer to RIXS excitations of different character, also discussed in the text. The grey-dashed line indicates the incident energy giving the most pronounced changes in the RIXS map and in the XAS across the MIT. The red-dotted line provides a guide to the eye for the linearly energy dispersingFlfeature.
To gain more insight into the origin of the observed Raman-and fluorescence-like spectral response, we closely examine the individual RIXS spectra and we perform a fitting analysis to extract the general behaviour of the main spectral components. As shown in Fig. 3a, the raw RIXS spectrum is decomposed into three different contributions (see Supplementary Note 1 and Supplementary Fig. 1). Referring to the photon energyhnin¼A, we identify from the corresponding RIXS spectrum localized
dd-orbital excitations extending from 1 to 3 eV (black line), a broad background centred around 4 eV (CT, green line), and a residual spectral weight (Fl, magenta line) peaking at 0.7 eV between the elastic line and the dominatingdd-profile.
Remarkably, at this photon energy even the fine multiplet structure of thedd-excitations is in good agreement with that of NiO44, suggesting immediately that NdNiO3 has an unusual Ni 3d8-likeS¼1 local electronic structure similar to NiO. Figure 4
furthermore endorses this concept, displaying the comparison between the RIXS data and cluster model calculations performed for a Ni 3d7GS (grey line, model parameters taken from ref. 39) and a crystal field calculation of the dd-excitations for a Ni 3d8
GS (black line, model parameters from NiO45; see also Supplementary Note 3 and Supplementary Table 1). The
dd-excitations obtained for the Ni 3d7 case strongly differ from the present NdNiO3data not only in the peak energy positions displaced to higher energies, but also in the intensity distribution profile, thus ruling out a Ni 3d7GS scenario. Thedd-excitations calculated for the NiO in Ni 3d8configuration instead present a remarkably good correspondence with the present data, verifying thed8-like character of Ni in this compound: such a finding is the first key result of our study and directly poses the question if NdNiO3 deviates from a conventional positive charge-transfer picture based on a Ni 3d7 GS in favour of a negative charge-transfer scenario based on a Ni 3d8GS, as illustrated in Fig. 1b. Finally, we note that in the insulating phase an extra dd-peak emerges from the experimental data at B0.75 eV, which is not captured by the Ni 3d8 calculation. We speculate that this contribution could be caused by symmetry-breaking phenomena (related to the presence of different Ni sites in the insulating phase). However, more advanced and detailed calculations have to be developed to reproduce this finding.
Referring now tohnin¼B incident photon energy, the three contributions identified above forhnin¼A—dd,CTandFl—can be still distinguished in the corresponding RIXS spectrum. However, comparing the two spectra in Fig. 3a, we observe a shift in energy for the CT- andFl-contributions, contrary to the
dd-excitations which are fixed in energy loss, and a strong redistribution of spectral weight between the three spectral components. 8 6 4 2 0 0 2 4 6 8 hin=B hin=A
Energy loss (eV)
Intensity (a.u.) a T=15 K 852 854 856 0 2 4 6 8 10 Intensity (a.u.) T=15 K b A B C 852 854 856 c T=300 K A C B 852 854 856 8 6 4 2 0
Energy loss (eV)
Photon energy (eV)
T=15 K d CT Fl 852 854 856 T=300 K e Raw data dd-fit Fl-fit CT-fit Sum-fit
Figure 3 | RIXS data analysis across the MIT.(a) RIXS line spectra (grey open-dot line) measured athnin¼A andhnin¼B at 15 K. The thin solid lines
refer to Gaussian fits ofdd-excitations (black), theCTexcitation (green) and theFlexcitation (magenta). The blue-dashed line refers to the sum of the three fitting contributions, plus the elastic line at 0 eV. (b,c) Integrated intensity of the fitdd-,CT- andFl-excitations together with the total integrated intensity at 15 K (300 K). The grey arrow marks the incident energy giving the most pronounced changes in the RIXS integrated intensity across the MIT. (d,e) Peak energy dispersion for theCT- andFl-excitation at 15 K (300 K). The same colour code as inais used throughout the figure. The error bars of the model parameters are evaluated using the least square fitting routine and expressed in s.e.d. The error bars of the initial RIXS spectra were estimated assuming Poisson statistics.
Intensity (a.u.)
7 6 5 4 3 2 1 0 –1
Energy loss (eV) NdNiO3 -hin=A Experiment: T=300 K T=15 K Calculation: GS 3d7 GS 3d8
Figure 4 | Comparison between experimental and calculateddd -excitations.Data: RIXS spectra atT¼15 K (blue circles) and atT¼300 K (red circles),hnin¼A,spolarization. Calculation: crystal field RIXS
calculation for a Ni 3d8GS based on NiO parameters45(black line); cluster calculation for a Ni 3d7GS using the parameters in ref. 39 (grey line). Please note that the elastic lines have been removed from the calculated spectra to better display the differences at the low energies. The experimentaldd-line shape is well reproduced by the Ni 3d8cluster calculation, supporting the negative charge-transfer scenario for ReNiO3.
The good matching between data and calculation shows that: (1) there is no inversion of crystal field in ReNiO3compared with NiO, in agreement with
ref. 25 for dominating Coulomb interaction; (2) being the Ni–O distance shorter in ReNiO3than in NiO, the negative charge-transfer energy may
To disentangle localized versus delocalized character of the RIXS excitations, we extend in Fig. 3b–e the fitting analysis to all the RIXS spectra between 852 and 858 eV incident photon energies and we track for each contribution the integrated intensity (Fig. 3b,c) and the peak energy dispersion (Fig. 3d,e; see Supplementary Note 1 and Supplementary Fig. 1). While the
dd-excitations (black dots) have a Raman-like behaviour throughout the energy range and clearly resonate athnin¼A, the other two contributions (CT in green and Fl in magenta dots) resonate instead athnin¼B (see Fig. 3b, 15 K). Interestingly, and contrary to the similarity in their resonant behaviour, the CT- and the
Fl-contributions present different peak energy dispersions as a function of the incident photon energy (Fig. 3d). The broad
CT-peak (FWHMB6 eV) displays a behaviour characteristic of well-known charge-transfer excitations between the central Ni site and the surrounding oxygens: constant energy loss (B4 eV) up to the resonant energyhnin¼B, and a fluorescence-like linear dispersion at higher incident photon energies. The Fl-peak (FWHM B1 eV), instead, linearly disperses versus incident photon energy across the full Ni L3 resonance: as introduced above, this behaviour is a clear fingerprint for a delocalized excitation involving continua. Overall, these findings are common to both low and high temperature data sets. However, in the metallic state (see Fig. 3c,e, 300 K) the intensity of bothCT- and
Fl-peaks is enhanced athnin¼C: the resulting extra weight in the integrated RIXS intensity profile (Fig. 3c, blue dots) mimics the filling of the valley observed in the XAS spectrum at 300 K, and explains the absence of a dip in the intensity distribution of the RIXS map (Fig. 2b) at the same incident energy.
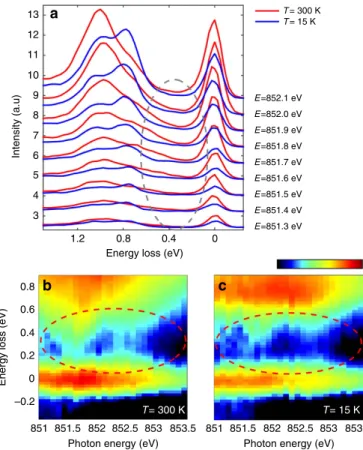
In addition, we examine the Fl-excitations more closely in Fig. 5, where we focus on the low energy loss range (o1.5 eV) of the high-statistics RIXS spectra obtained at the Ni L3 pre-peak region, starting 1 eV before peak A. In Fig. 5a, we observe changes in the dd-excitations between 300 and 15 K (across the MIT) likely due in part to local rearrangements of the NiO6octahedra. Moreover, a sizeable spectral weight continuum around 0.2–0.5 eV (see Fig. 5a, inside the ellipse area) is present only at 300 K in the metallic phase, as better displayed by the RIXS colour maps for 300 and 15 K (see Fig. 5b,c, respectively).
Anderson impurity model. To understand the origin of the
various RIXS excitations and their link to the electronic structure,
one can employ an Anderson impurity model (AIM)
interpretation (Supplementary Note 4). While the schematics in Fig. 1a,b show the single-particle removal and addition excitations for different charge-transfer scenarios, RIXS actually measures charge neutral excitations, which are well represented in a configuration interaction-based AIM. These charge neutral excitations are shown schematically in Fig. 6a for the negative charge-transfer caseD0o0 and the positive charge-transfer case D040 (NiO like) of a Ni 3d8impurity. As previously mentioned, for the D040 case, the only charge fluctuations possible in the AIM are from the full O 2pband to the Ni impurity level. While conserving the total charge, these fluctuations give rise to a Ni 3d9Lband corresponding to charge-transfer excitations (shown in green in Fig. 6a for NiO). However, for the D0o0 case (recall Fig. 1b), the presence of a self-doped, partially filled O 2pdensity of states (DOS) extending across the Fermi level opens additional pathways for the neutral charge fluctuations. Electrons can either hop from the O 2pvalence band to the O 2pconduction band leaving the Ni impurity occupation unchanged, yielding a characteristic low energy electron-hole pair continuum of
m excitations d8vmcm marked in magenta (v is a hole in the valence band andcan electron in the conduction band, as shown in the small O 2pDOS inset of Fig. 6a); or, to and from the Ni
impurity level, from the O 2pvalence band and toward the O 2p
conduction band, respectively, causing the impurity occupation to change by plus or minus one and yielding a charge-transfer like continuum of excitations at higher energy. Eventually these charge-transfer excitations can be dressed by associated electron– hole pair excitations, vmcm, resulting ind9vmþ1cmord7vmcmþ1
bands of excitations (green band). We stress that the here introduced low-energy electron–hole pair excitations can be obtained only for theD0o0 case, where the O 2pDOS crossesE
F. The effects of these two impurity models on RIXS are detailed in Fig. 6b. The case of NiO can be solved numerically including the full correlations within the Ni 3d shell, and we show the calculated RIXS map in Fig. 6b. Comparing this to the schematic NiO configurations in Fig. 6a, we see that there are Raman-like
dd-excitations below 4 eV, corresponding to reorganized Ni 3d8
orbital occupations, and a charge-transfer band at distinctively higher energy losses which is Raman-like for lower incident photon energies up to ca. 855 eV, before dispersing like fluorescence for higher photon energies. However, as the schematic in Fig. 6a suggests, the charge-transfer excitations do not extend down to low energy losses for the NiO case (D040). To gain further insight into the NdNiO3 experimental data, the extractedCT- andFl-dispersion curves of Fig. 3d are overlaid on the calculated RIXS map in Fig. 6b. Indeed, the NdNiO3
13 a b c T= 300 K T= 15 K T= 300 K T= 15 K E=852.1 eV E=852.0 eV E=851.9 eV E=851.8 eV E=851.7 eV E=851.6 eV E=851.5 eV E=851.4 eV E=851.3 eV 12 11 10 Intensity (a.u) 9 8 7 6 5 4 3 1.2 0.8 0.6 0.4 0.2 0 –0.2
Photon energy (eV) Photon energy (eV) 851 851.5 852 852.5 853 853.5 851 851.5 852 852.5 853 853.5
0.8
Energy loss (eV)
Energy loss (eV)
0.4 0
Figure 5 | Low-energy electron–hole pair continuum in the RIXS spectra. (a) RIXS line spectra measured for incident energies going fromhnin¼A-1 eV
up tohnin¼A-0.2 eV in steps of 0.1 eV at 15 K (blue) and 300 K (red). Each
spectrum has been acquired for 5 min. The grey ellipse highlights the energy loss region where the electron–hole pair continuum is more prominent. (b,c), Magnification of the low energy loss region (o0.9 eV) of the RIXS map with a logarithmic intensity scale at 300 K (15 K); intensity scale bar from
3 to 1 (a.u.). The spectra have been normalized to thedd-area to have comparable background signal in the low energy loss region. The red ellipses underline the electron–hole pair continuum present at 300 K (b) and the intensity gap in the same energy window at 15 K (c).
CT-excitations (open green dots) show a similar behaviour as the NiO CT ones (solid green line). The NdNiO3 Fl-excitations, instead, with their distinctive fluorescence-like dispersion differ from any of the NiO excitations. Interestingly, the identified
Fl-contribution propagating down to very low energy losses is compatible instead with the electron–hole pair continuum excitations d8vmcm coming from the broad O 2p band: this finding is the second key result of our study and naturally occurs for the negative charge-transfer case (D0o0) as represented in the AIM schematic of Fig. 6a (magenta band).
Discussion
The main findings of the presented data analysis and interpretation are as follows: localized dd-excitations sharply resonate at the XAS peak A with a lineshape consistent with a Ni 3d8 configuration; delocalized Fl-excitations mostly resonate at the XAS peak B and are interpreted as electron–hole pair excitations across the O 2p band cut by EF (Fig. 1b, green contours); spectral weight reduction of the electron–hole pair excitations close to zero energy loss (Fig. 5b,c) suggests the opening of an O–O insulating gap (Fig. 1b, red-dashed contours) at low temperature, in line with previously reported optical conductivity46,47studies and similarly as in more recent ARPES data48revealing a spectral weight transfer from nearEFto higher binding energies across MIT.
This collection of results clearly identifies NdNiO3as a negative
D0charge-transfer material, with a local Ni 3d8configuration49, a predominant O 2p character across the Fermi level50 and a consequent GS of mainly Ni 3d8Ln. This picture is compatible with the scenario proposed by Mizokawa26, also discussed as bond disproportionation model in recent theoretical approaches27–30,51,52, which comprises an expanded 3d8 Ni site (n¼0, S¼1) and a collapsed 3d8L2 Ni site (n¼2, S¼0) alternating in the insulating phase with the following spin order
m0k0 and a homogeneous Ni 3d8L (n¼1) GS in the metallic phase. As underlined in previous works28,29, this model is in agreement with several breakthrough experimental findings: (1/2 0 1/2) antiferromagnetic Bragg peak in the insulating phase5; charge ordering6, which in this model is distributed among both Ni and O
sites instead of only Ni sites; absence of orbital order34; evidence of strong Ni–O covalence in the GS4,20,21.
Furthermore, the different resonant behaviour extracted in this study for localized and delocalized RIXS excitations suggests that the two distinct XAS peaks marked at low temperature mostly result from the two different components of the GS, being XAS peak A mostly associated with a Ni 3d8configuration, and XAS peak B with the delocalized ground-state Ni 3d8L2
configuration. This is in line with the energy dependence of the (1/2 0 1/2) peak resonating athnin¼A (refs 31,37), here assigned to the magnetically active S¼1 site.
In conclusion, by combining Ni L3 XAS and RIXS measure-ments we studied the electronic ground-state properties of ReNiO3, to discriminate the electronic structure between a negative and a positive charge-transfer scenario. By analysing the first ever high-resolution Ni L3RIXS data obtained for ReNiO3, we identified the coexistence of bound, localized excitations and strong continuum excitations in both the XAS and the RIXS spectra, in contrast to earlier absorption studies which assumed primarily charge-transfer multiplet effects in the XAS. Further, we disentangled the continuum features in the RIXS spectra into charge-transfer and fluorescence excitations, showing the latter to arise due to the presence of a ground state containing holes in the oxygen 2pband. Electron–hole pair excitations from oxygen 2p states across the Fermi level have been identified down to zero energy loss, mimicking the opening of a gap forToTMI. All these experimental observations provide clear indication of an O 2phole-rich ground state with Ni 3d8Ln electronic configuration as the main component, as expected for a negative charge-transfer system. This GS configuration lends support to the treatment of the ReNiO3as aS¼1 Kondo or Anderson lattice problem with a Ni 3d8Ln (n¼1) metallic GS, and realizing the MIT by a bond disproportionation leading to two Ni site environments: Ni 3d8
(n¼0, S¼1) and Ni 3d8L2 (n¼2, S¼0), differing in the hybridization with the O 2phole states yet leaving the charge at the nickel sites almost equal. While this result is vital for the understanding of the rare-earth nickelate family per se, the combined XAS and RIXS approach demonstrated here opens the opportunity to classify the electronic structure for other cases of very small or negative charge-transfer gapsD0, which could
a O 2p DOS NdNiO3 ′ < 0 NiO ′ > 0 EF b c
|
d9 L〉
|
d7m cm+1〉
|
d9m+1 cm〉
|
d8m cm〉
|
d8〉
|
d8〉
10 NiO ×8 NiO CT NdNiO3CT NdNiO3FI 8 6 4 2Energy loss (eV)
Photon energy (eV) 0
852 854 856 858 860
Figure 6 | Anderson impurity model interpretation of the RIXS and XAS spectra.(a) AIM schematic for charge neutral RIXS excitations. The configurations of the AIM are very different forD0o0 (NdNiO
3) andD040 (NiO) 3d8compounds.CT-like excitations are obtained in both cases (green
bands), whileFl-like excitations (magenta band) are found only forD0o0 and correspond to electron–hole pair excitations as shown in the O 2pDOS inset.
(b) Calculated RIXS map for the positive charge-transfer compound NiO, using the AIM. The NdNiO3CT- andFl-excitations dispersion curves from Fig. 3d
are overlaid for comparison (green and magenta open dots, respectively), as well as the NiO CT-excitation dispersion (green solid line). Horizontal coloured lines make the connection between the RIXS excitations and the assigned interpretation in the AIM schematic ofa.
be common to other materials with unconventionally high formal oxidation states (as for example sulfides, selenides and tellurides).
Methods
Experimental details.XAS and high-resolution RIXS measurements have been performed at the ADRESS beamline of the Swiss Light Source53, Paul Scherrer Institute. The sample has been oriented in grazing incidence, with the incoming photon beam impinging at 15°with respect to the sample surface. The scattering plane for the RIXS measurements was coinciding with the crystallographicac-plane (orbc-plane, equivalently). All the data displayed here have been measured for incoming photons polarized parallel to thea(b) axis (also referred to ass polarization, perpendicular to the scattering plane). For the RIXS measurements we used the SAXES spectrometer54prepared with a scattering angle of 130°and a total energy resolution of 110 meV. The spectrometer was set in the high-efficiency configuration, using the 1,500 lines per mm VLS spherical grating. This set-up allowed acquiring around 600–800 photons at the maxima of the prominent spectral structures already in 1 min. The recorded scattered photons were not filtered by the outgoing polarization.
Data availability.The XAS and RIXS data that support the findings of this study are available from the corresponding authors V.B. and T.S. upon request. References
1. Medarde, M. L. Structural, magnetic and electronic properties of
RNiO3 perovskites (R¼rare earth).J. Phys. Condens. Matter.9,1679–1707 (1997).
2. Torrance, J. B., Lacorre, P., Nazzal, A.l., Ansaldo, E. J. & Niedermayer, C. Systematic study of insulator-metal transitions in perovskites RNiO3(R¼Pr,
Nd, Sm, Eu) due to closing of charge-transfer gap.Phys. Rev. B45,8209–8212 (1992).
3. Catalan, G. Progress in perovskite nickelate research.Phase Transit.81, 729–749 (2008).
4. Jaramillo, R., Ha, S. D., Silevitch, D. M. & Ramanathan, S. Origins of bad-metal conductivity and the insulator–metal transition in the rare-earth nickelates. Nat. Phys.10,304–307 (2014).
5. Garcia-Munoz, J. L., Rodriguez-Carvajal, J. & Lacorre, P. Sudden appearance of an unusual spin density wave at the metal-insulator transition in the perovskites RNiO3(R¼Pr, Nd).Eur. Phys. Lett.20,241–247 (1992).
6. Alonso, J. A.et al.Charge disproportionation in RNiO3perovskites:
simultaneous metal-insulator and structural transition in YNiO3.Phys. Rev.
Lett.82,3871–3874 (1999).
7. Liu, J.et al.Heterointerface engineered electronic and magnetic phases of NdNiO3thin films.Nat. Commun.4,2714 (2013).
8. Catalano, S.et al.Electronic transitions in strained SmNiO3 thin films. App. Phys. Lett. Mater.2,116110 (2014).
9. Scherwitzl, R.et al.Electric-field control of the metal-insulator transition in ultrathin NdNiO3films.Adv. Mater.22,5517–5520 (2010).
10. Scherwitzl, R.et al.Metal-insulator transition in ultrathin LaNiO3films.
Phys. Rev. Lett.106,246403 (2011).
11. Son, J.et al.Low-dimensional Mott material: transport in ultrathin epitaxial LaNiO3films.App. Phys. Lett.96,062114 (2010).
12. Caviglia, A. D.et al.Ultrafast strain engineering in complex oxide heterostructures.Phys. Rev. Lett.108,136801 (2012).
13. Chaloupka, J. & Khaliullin, G. Orbital order and possible superconductivity in LaNiO3/LaMO3superlattices.Phys. Rev. Lett.100,016404 (2008).
14. Gibert, M., Zubko, P., Scherwitzl, R., Iniguez, J. & Triscone, J.-M. Exchange bias in LaNiO3/LaMnO3superlattices.Nat. Mat.11,195–198 (2012).
15. Chakhalian, J.et al.Asymmetric orbital-lattice interactions in ultrathin correlated oxide films.Phys. Rev. Lett.107,116805 (2011).
16. Wu, M.et al.Strain and composition dependence of orbital polarization in nickel oxide superlattices.Phys. Rev. B88,125124 (2013).
17. Benckiser, E.et al.Orbital reflectometry of oxide heterostructures.Nat. Mater.
10,189–193 (2011).
18. Disa, A. S.et al.Orbital engineering in symmetry-breaking polar heterostructures.Phys. Rev. Lett.114,026801 (2015).
19. Zaanen, J., Sawatzky, G. A. & Allen, J. W. Band gaps and electronic structure of transition-metal compounds.Phys. Rev. Lett.55,418 (1985).
20. Medarde, M. L.et al.RNiO3perovskites (R¼Pr, Nd): Nickel valence and
the metal-insulator transition investigated by X-ray-absorption spectroscopy. Phys. Rev. B46,14975–14984 (1992).
21. Mizokawa, T.et al.Electronic structure of PrNiO3studied by photoemission
and X-ray-absorption spectroscopy: band gap and orbital ordering.Phys. Rev. B
52,13865–13873 (1995).
22. Abbate, M.et al.Electronic structure and metal-insulator transition in LaNiO3-d.Phys. Rev. B65,155101 (2002).
23. Horiba, K.et al.Electronic structure of LaNiO3x: anin situsoft X-ray
photoemission and absorption study.Phys. Rev. B76,155104 (2007). 24. Mizokawa, T.et al.Origin of the band gap in the negative
charge-transfer-energy compound NaCuO2.Phys. Rev. Lett.67,1638 (1991).
25. Khomskii, D. I. Unusual valence, negative charge-transfer gaps and self-doping in transition-metal compounds.Lithuanian J. Phys.37,65 (1997).
26. Mizokawa, T., Khomskii, D. I. & Sawatzky, G. A. Spin and charge ordering in self-doped Mott insulators.Phys. Rev. B61,11263–11266 (2000).
27. Park, H.et al.Site-selective Mott transition in rare-earth-element nickelates. Phys. Rev. Lett.109,156402 (2012).
28. Lau, B.et al.Theory of the magnetic and metal-insulator transitions in RNiO3 bulk and layered structures.Phys. Rev. Lett.110,126404 (2013).
29. Johnston, S., Mukherjee, A., Elfimov, I., Berciu, M. & Sawatzky, G. A. Charge disproportionation without charge-transfer in the rare-earth-element nickelates as a possible mechanism for the metal-insulator transition.Phys. Rev. Lett.112, 106404 (2014).
30. Subedi, A., Peil, O. E. & Georges, A. Low-energy description of the metal-insulator transition in the rare-earth nickelates.Phys. Rev. B91,075128 (2015). 31. Scagnoli, V.et al.Role of magnetic and orbital ordering at the metal-insulator
transition in NdNiO3.Phys. Rev. B73,100409 (2006).
32. Mazin, I. I.et al.Charge ordering as alternative to Jahn-Teller distortion. Phys. Rev. Lett.98,176406 (2007).
33. Medarde, M. L.et al.Charge disproportionation in RNiO3perovskites (R¼rare
earth) from high-resolution X-ray absorption spectroscopy.Phys. Rev. B80, 245105 (2009).
34. Staub, U.et al.Direct observation of charge order in an epitaxial NdNiO3film.
Phys. Rev. Lett.88,126402 (2002).
35. Scherwitzl, R., Zubko, P., Lichtensteiger, C. & Triscone, J.-M. Electric-field tuning of the metal-insulator transition in ultrathin films of LaNiO3.App. Phys.
Lett.95,222114 (2009).
36. Catalano, S.et al.Tailoring the electronic transitions of NdNiO3films through
(111)pc oriented interfaces.Appl. Phys. Lett. Mater.3,062506 (2015). 37. Bodenthin, Y.et al.Magnetic and electronic properties of RNiO3(R¼Pr, Nd,
Eu, Ho and Y) perovskites studied by resonant soft X-ray magnetic powder diffraction.J. Phys. Condens. Matter.23,036002 (2011).
38. Liu, J.et al.Metal-insulator transition and orbital reconstruction in Mott-type quantum wells made of NdNiO3.Phys. Rev. Lett.109,107402 (2012).
39. Freeland, J. W., van Veenendaal, M. & Chakhalian, J. Evolution of electronic structure across the rare earth RNiO3series.J. Electron Spectros. Relat.
Phenomena208,56–62 (2016).
40. Kotani, A. & Shin, S. Resonant inelastic X-ray scattering spectra for electrons in solids.Rev. Mod. Phys.73,203 (2001).
41. Ament, L. J. P., van Veenendaal, M., Devereaux, T. P., Hill, J. P. & van den Brink, J. Resonant inelastic X-ray scattering studies of elementary excitations. Rev. Mod. Phys.83,705 (2011).
42. Schmitt, T.et al.Electronic structure studies of V6O13 by soft X-ray emission spectroscopy: band-like and excitonic vanadium states.Phys. Rev. B69,125103 (2004).
43. Zhou, K.J.et al.Localized and delocalized Ti 3d carriers in LaAlO3/SrTiO3 superlattices revealed by resonant inelastic X-ray scattering.Phys. Rev. B83, 201402(R) (2011).
44. Ghiringhelli, G.et al.Observation of two nondispersive magnetic excitations in NiO by resonant inelastic soft-X-ray scattering.Phys. Rev. Lett.102,027401 (2009).
45. Ghiringhelli, G.et al.NiO as a test case for high resolution resonant inelastic soft X-ray scattering.J. Phys. Condens. Matter17,5397–5412 (2005). 46. Katsufuji, T.et al.Optical spectroscopy of the metal-insulator transition in
NdNiO3.Phys. Rev. B51,4830 (1994).
47. Stewart, M. K., Liu, J., Kareev, M., Chakhalian, J. & Basov, D. N. Mott physics near the insulator-to-metal transition in NdNiO3.Phys. Rev. Lett.107,176401 (2011).
48. Dhaka, R. S.et al.Tuning the metal-insulator transition in NdNiO3
heterostructures via Fermi surface instability and spin fluctuations.Phys. Rev. B
92,035127 (2015).
49. Fabbris, G.et al.Orbital engineering in nickelate heterostructures driven by anisotropic oxygen hybridization rather than orbital energy levels. Preprint at http://arxiv.org/abs/1603.08873 (2016).
50. Butorin, S. M.et al.Intra- versus inter-site electronic excitations in NdNiO3by
resonant inelastic ultra-soft X-ray scattering at Ni 3p edge.Solid State Commun.
135,716–720 (2005).
51. Ko, W.-H., Jiang, H.-C., Rau, J. G. & Balents, L. Ordering and criticality in an underscreened Kondo chain.Phys. Rev. B87,205107 (2013).
52. Zhang, J. Y.et al.Key role of lattice symmetry in the metal-insulator transition of NdNiO3films.Sci. Rep.6,23652 (2016).
53. Strocov, V. N.et al.High-resolution soft X-ray beamline ADRESS at the Swiss Light Source for resonant inelastic X-ray scattering and angle-resolved photoelectron spectroscopies.J. Synchrotron Radiat.17,631–643 (2010).
54. Ghiringhelli, G.et al.SAXES, a high resolution spectrometer for resonant X-ray emission in the 400–1600 eV energy range.Rev. Sci. Instrum.77,113108 (2006).
Acknowledgements
This work was performed at the ADRESS beamline of the Swiss Light Source at the Paul Scherrer Institut, Switzerland. Part of this research has been funded by the Swiss National Science Foundation through its National Centre of Competence in Research MaNEP and the Sinergia network Mott Physics Beyond the Heisenberg (MPBH) model. The research leading to these results has received funding from the European Community’s Seventh Framework Program (FP7/2007–2013) under Grant Agreement No. 290605 (COFUND: PSI-FELLOW) and ERC Grant Agreement No. 319286 (Q-MAC). Moreover, this work has received support through funding from the Canadian funding agencies NSERC, CRC, and the Max Planck/UBC center for Quantum Materials.
Author contributions
V.B., S.C., M.G., R.S., G.S., J.-M.T. and T.S. planned the project. S.C, M.G., R.S., P.Z. and J.-M.T. grew and characterized the thin film samples. V.B., S.C., R.S., Y.H., V.S. and T.S. carried out the experiment. V.B. and T.S. analysed the data. R.G., S.B. and G.S. carried out the theoretical calculations. V.B., R.G., G.S. and T.S. wrote the paper with contributions from all authors.
Additional information
Supplementary Informationaccompanies this paper at http://www.nature.com/ naturecommunications
Competing financial interests:The authors declare no competing financial interests.
Reprints and permissioninformation is available online at http://npg.nature.com/ reprintsandpermissions/
How to cite this article:Bisogni, V.et al.Ground state oxygen holes and the metal– insulator transition in the negative charge-transfer rare-earth nickelates.Nat. Commun.
7, 13017 doi: 10.1038/ncomms13017 (2016).
This work is licensed under a Creative Commons Attribution 4.0 International License. The images or other third party material in this article are included in the article’s Creative Commons license, unless indicated otherwise in the credit line; if the material is not included under the Creative Commons license, users will need to obtain permission from the license holder to reproduce the material. To view a copy of this license, visit http://creativecommons.org/licenses/by/4.0/