The Effect of Environmental Accounting, Corporate Social
Responsibility and Corporate Performance to Corporate
Reputation
Gilbert Rely (IBI KKG)
ABSTRACT
This study is to examine the effect of moderating variable of corporate reputation between environmental accounting and corporate social responsibility with corporate performance. The independent variable is environmental accounting and corporate social responsibility, the dependent variable is corporate performance and moderation variable is corporate reputation. The populations are listed manufacturing companies in Indonesia Stock Exchange for 2014-2016 periods and have an environmental impact with samples of 185 manufacturing companies and use a quantitative method. This research result shows how variable of corporate reputation, environmental accounting and corporate social responsibility simultaneously influence to corporate performance in model 1 and model 2. This result indicates that there is no influence between environmental accounting with corporate performance, there is influence between corporate social responsibilities with corporate performance, corporate reputation does not weaken or strengthen the relationship between environmental accounting and corporate performance and corporate reputation strengthen the relationship between corporate social responsibility and corporate performance.
Keywords: corporate reputation, environmental accounting, corporate social responsibility, corporate
performance.
INTRODUCTION
Public companies are currently facing increasing pressure to disclose their corporate social responsibility (CSR) documentation and inform all stakeholders about their voluntary activities that have been done in the course of economic, social or possibly sustainable living (e.g. community involvement, worker equality, workers' human rights and environmental impacts). Since 2001, the publication of the European union of green paper: promoting the framework of social responsibility in Europe has made much progress in this field. Social responsibility is defined as "a series of various, economic, social and environmental commitments adopted by public, private and value-added companies, organizations and institution, contributing to social and economic progress for sustainable development''. The EU in the formulation of the latest strategy noted that "corporate responsibility has an impact on society", with special reference, stakeholders to integrate social, environmental, ethical, adherence to human rights, concerns about their business operations and core strategies. (Vázquez & Sánchez-Hernández, 2014).
How the influence of corporate social responsibility and environmental accounting in moderated corporate reputation to firm performance, (Sawitri, 2017), Government of Indonesia is currently focusing on the development and welfare of the community and making it happen is by taking part in supporting MDGs (Millennium Development Goals) program which has 17 goals. Government needs support from all parties, especially the support of business society, through environmental performance and environmental accounting; it is expected to increase the value of the firm.
Corporate reputation is used as a moderating variable, because companies with a good reputation are more resilient to market changes and ambiguities. Corporate stakeholder groups, in running a business in a firm, avoid a high degree of uncertainty, so that the firm's stakeholders are more dependent on good corporate reputation conditions to formulate their actions. The rapid growth in the number of studies in the field of corporate reputation reflects the growing interest of academics as well as the attention of the companies’ management so that their entities always have a high reputation in the market. The firm's reputation is extensively researched to see its relationship with the consequences and effects of its consequences, a firm's reputation is an important competitive advantage, research on the determinants and consequences of corporate reputation is important to be examined in every circle. (Ali, Lynch, Melewar, & Jin, 2015).
Over the past two decades there has been a growth in research on corporate reputation (Fombrun & Shanley's, 1990, Waker's, 2010) from various academic disciplines such as accounting, economics, marketing, organizational behavior, sociology and strategy, the firm's reputation has long been recognized as a significant competitive advantage and as a value creation in making consistent and superior market performance. (Ali, Lynch, Melewar, & Jin, 2015).
The formulation research problem is (1) whether environmental accounting has significant effect to corporate performance, in IDX firm having environmental impact for 2012-2016 periods, (2) Does corporate social responsibility have significant effect to corporate performance at IDX firm which have environmental impact for 2012-2016 periods?, (3) Does corporate reputation moderate the relationship between environmental accounting and corporate performance at IDX companies that have an environmental impact for 2012-2016 periods? And (4) does corporate reputation moderate the relationship between corporate social responsibility and corporate performance on IDX companies that have an environmental impact for 2012-2016 periods?
This research purpose is to find out an empirical evidence about (1) the effect of environmental Accounting on corporate performance in IDX firm that have environmental impact for 2012-2016 periods, (2) to know the influence of corporate social responsibility to corporate performance in IDX firm that have an environmental impact for 2012-2016 periods; (3) to obtain empirical evidence that corporate reputation can moderate the relationship between environmental accounting and corporate performance on IDX companies with environmental impact for 2012-2016 periods; and (4) to obtain empirical evidence that corporate reputation may moderate the relationship between Corporate social responsibility and corporate performance at IDX companies that have an environmental impact for 2012-2016 periods.
LITERATURE REVIEW AND HYPOTHESES DEVELOPMENT
Signaling theory explains why firms have an incentive to voluntarily report information to the stock market, voluntary disclosure is required in order for companies to compete successfully in risky capital markets. Insiders know more about the firm and its future prospects than the investors will protect themselves by bidding lower prices on the companies concerned. However, firm value can be increased if they do a voluntarily report such as, CSR report and that is credible and reduce uncertainty from outside parties. (Omran, 2015).
Su et al., (2014) argue that the practice of corporate social responsibility may be an additional signal of disclosure of information to relevant stakeholders, especially in developing countries. CSR practices can meet two requirements for quality signal. First, it takes more cost and effort to implement CSR practices for less-capable companies compared to higher-performing firms. Second, the premium for the firm to engage in CSR is just enough for a highly capable firm.
Barnet (2007) & Su et al., (2014) argue that companies gather their capabilities from CSR activities also raises monetary and management costs. However, these costs will eventually pay off when the firm gains "capacity for influence on the stakeholders", the firm also has the ability to identify, act and benefit from opportunities in improving relationships with stakeholders through this CSR practice. This capacity is heavily dependent on existing channels and something costly to imitate a competitor with low ability, as this kind of capability must be built over time through a series of investments. (Su, Pang, Tan, & Cheung, 2014).
Environmental Accounting
Environmental accounting brings added value that is as an innovation in activities related to the environment, such as recycling resources and then using it in other activities and can lead to reduced environmental costs, which may also lead to an increase in the profitability of the entity economically, but it may also contribute to improving the quality of internal / external environmental reporting through environmental costs based on data in the environmental impacts of each production activity different from economic entity, (Rakos & Antohe, 2014). Murray et al., (2006) although social and environmental disclosures may not be part of a clear core activity for the firm in general, but this is an area of concern to all parties and especially has significant instrument potential as well as a strong moral strength and potential. The increased power of financial markets, intrinsic indifference to non-financial issues, social and environmental disclosure becomes a very important link between excessive financial reality and the life of the world. (Murray, Sinclair, Power, & Gray, 2006).
Corporate Social Responsibility
The shareholder value or return in terms of profit and dividends, was once considered to be a key driver of all corporate activity. perhaps the best known is the definition of CSR Milton Friedman (1970), published in a time magazine article, New York 1970, which states that the firm's responsibility is "to run the business as their
wishes, which will generally make as much perhaps money while conforming to the basic rules of society, whether embodied in the law or embodied in ethical customs.”
In other words, under this perspective, the only legitimate business function is to maximize profits, which implicitly maximize shareholder value in financial terms, while conforming to legal, ethical norms and has led CSR researchers to respond by trying to prove that this view is too narrow about the relationship between business and society, (Yeom, 2012).
Corporate Reputation
The firm's reputation continues to attract scientists and practitioners. Barnett et al., (2006) found that the average number of scientific articles published doubled from 2000 to 2003. Furthermore, the average number of scientific articles published between 2001 & 2003 was five times the average between 1990 & 2000. Corporate reputation is an interdisciplinary construction with conventional meaning. It attracted research in various fields such as economics, marketing, management, psychology and sociology, (Ponzi, Fombrun, & Gardberg, 2011).
A firm's reputation is a valuable and intangible asset because it influences the consumer's decision about the firm whose products and services they will buy, the creditor or investor's decision regarding the companies they will lend money, the price at which they will lend and the employment decision about the firm they are ready to work, (Fombrun, 1996). Various authors’ state that corporate reputation is an economic asset because they affect the firm's profitability or reputation is unique and incomparable. But firm's reputation is intangible and difficult to measure. An extensive discussion of the importance of developing a strong corporate reputation measurement has been widely written, both in academic publication. However, some researchers now use the firm's reputation in ways that fit their definition, (Ponzi, Fombrun, & Gardberg, 2011).
For the management to have a reputation effectively as an asset and a proper understanding of its role as an antecedent or its consequence, it is important for practitioners and researchers to be able to measure the firm's reputation. Various measurement approaches have been used in research for this purpose; however, the lack of a single and consistent approach poses a problem for managers and researchers in this field. Although existing literature does indicate a bias towards the use of some higher measures, there are still significant differences in approaches and measurement techniques. (Ali, Lynch, Melewar, & Jin, 2015).
The reputation data comes from a capital magazine survey similar to the one in fortune's annual compilation in the US, survey provides a measure of experts' perceptions of firm quality and results show that the firm's reputation changes over time. This survey is based on the following key attributes; 1) information and investment technology, 2) quality of service or product, 3) financial reliability, 4) new product development, innovation, 5) quality management 6) social benefits and employee rights, 7) payment policy and wage rate, 8) improvement employee qualifications, 9) marketing and sales strategies, 10) communication and public relations, 11) employee qualifications, 12) ethics in competitive behavior, 13) job satisfaction, 14) customer satisfaction, 15) management and transparency of the firm, (Tomak, 2014).
Corporate Performance
Firm performance is defined as achieving productive and efficient organizational goals (Bourguignon, 1995) & (Niculescu, 2003). Define by (Lorino, 2004) which states that the performance of the firm as something contributes to improving the firm cost and not only contributes to a decrease or increase in corporate costs. Furthermore, corporate entities must continually prove their economic and financial performance to the surrounding environment, (Dorina, Victoria, & Diana, 2012). Performance measurement is a necessary condition to ensure the progress of an entity and the progress of an unmeasured entity is unlikely known, (Tatiana & Marioara, 2012).
The GRI (Global Reporting Initiative) argues that one aspect of measuring the economic impact of a firm's operations is the economic performance directly distributed by the firm to shareholders, creditors, governments and local communities. The economic value includes sales revenue, operating expenses, employee compensation, donations and investment for the community, retained earnings, interest payments to creditors and tax payments to the government. Therefore, financial performance is a very important factor in the firm. (Yustiana, 2011).
Financial ratios are designed to analyze or evaluate financial statements, which contain data about the firm's position at a point of time and the firm's operations in the past. Analysis of financial statements is the beginning
of the future when viewed from the point of view of investors, while for management is useful to help anticipate the future conditions and be the starting point of planning actions that will affect the course of future events. If the pressures of stakeholders are very strong and affect the continuity and performance of the firm, then the firm should be able to develop policies and programs of targeted and integrated social and environmental policies (Brigham & Houston, 2006). Mulyati 2011 concluded that suitable and feasible performance measures depend on the unique circumstances that researchers face. One of the most valuable ratios that can provide the best information is Tobin's Q (James Tobin) of Yale university after he got a Nobel Prize. Morck et al., (1988), McConnell et al., (1990), Mulyati (2011) to use Tobin's Q as a measure of the firm's financial performance on the grounds that with Tobin's Q it can be found in the market value of the firm, reflecting the future profits of a firm such as profit currently in comparison with other ratios like ROA that only see earnings at that time. The greater the value of Tobin's Q indicates that the firm has good growth prospects. This happens because the greater the market value of the firm's assets, the greater the willingness of investors to sacrifice more to own the firm.
Conceptual framework
The framework of this research will be explaining how corporate reputation moderate effects between environmental accounting and corporate social responsibility to corporate performance. Firm performance is the work that can be achieved by a person or group of people within a firm in accordance with the authority and responsibility of each in an effort to achieve the objectives of the firm legally, and not violate the law, and not against moral and ethical value. The connection with the firm's reputation is that the firm's reputation from various literatures can moderate the relationship between environmental accounting and corporate social responsibility (CSR) to the firm's performance. Corporate reputation is an economic asset because they affect the firm's profitability due to the firm's reputation is unique and incomparable; it also deals with environmental accounting that can help improve the competitive advantage of productive economic entities through environmental management accounting. In addition, managers must follow the basic principles to maximize
shareholder value and continue to promote social responsibility activities that can improve firm performance.
1st Conceptual Framework Development of Hypotheses
Effect of Environmental Accounting with Corporate Performance
Revealing environmental costs can provide information regarding the distribution of environmental costs that are beneficial for the improvement and control of environmental performance. The disclosure of environmental costs is good if it provides cost information based on the type of activity. If reporting of environmental costs is disaggregated by type of activity, it will be easy to identify the costs incurred from each activity. Environmental costs are costs arising from the environmental quality, (Hansen & Mowen, 2015). Beer & Friend (2005) found that by disclosing environmental costs, the allocation of activity-based costs to systematic environmental accounting can contribute well to environmental performance. The firm's environmental disclosure will provide a positive signal for investors where the firm has done a good environmental performance and expects it to have a positive impact on the firm's value. (Sawitri, 2017).
Companies need support from stakeholders in order to maintain firm survival, (Gray et al., 1995). One way to gain support is by reporting the firm's environmental performance. Firms that have good environmental performance tend to report on their performance and on the other hand that have poor performance will tend not to inform stakeholders and this result was supported by Guthrie & Parker (1990) where companies that have lower performance will reveal less environmental performance. Disclosure of the firm's environmental performance was the impact of social priorities, responses to government pressure, accommodation to public pressure, protection of corporate rights and image. If corporate activities endanger the community then the
Environmental Accounting (X1)
Corporate Social
Responsibility (CSR) (X2)
Corporate Performance (Y)
government will intervene to protect the rights of the community (Gray et al., 1995). Interventions that arises the firm interests so that firms will tend to disclose to maintain the rights and firm values, (Sawitri, 2017).
H1: There is an effect of Environmental Accounting with Corporate Performance at IDX Firm that has an environmental impact for 2012-2016 periods.
Influence of Corporate Social Responsibility with Corporate Performance
Corporate social responsibility is very important to be disclosed in annual report, because from an economic perspective, the firm will disclose an information if the information will increase firm value. In addition, by applying corporate social responsibility, the firm hopes to gain social legitimacy and maximize its financial strength in the long term. This proves that firms expressing their social activities expect a positive response by market participants. Therefore, the welfare and safety of employees must be considered by the firm. To maintain the welfare of employees of the firm must provide social costs in the form of employee costs. Employee welfare costs can include incentives, benefits, employee benefits, and pensions. With the cost of employees then employees will feel appreciated and will be more active in the work. Thus it can be concluded that the cost of employees can increase job satisfaction that affects employee productivity and will have implications for the firm's ability to create revenue through sales. If the firm's social concern for the welfare of employees gets sympathy from the community, and the society can accept the price and the quality of the resulting product, as a result the firm will have a good sales performance and increase in sales performance then firm will get a profit. (Pujiasih, 2013).
H2: There is influence of Corporate Social Responsibility with Corporate Performance at IDX Firm that has environmental impact for 2012-2016 periods.
The Influence of Corporate Reputation as moderating the relationship between Environmental Accounting and Corporate Performance
The firm's reputation is "a collection of attributes that are inferred from past corporate actions and deemed from the firm". Miller & Plot argue that one of the behaviors that build a reputation that companies can do is to sell high-quality products and charge higher prices. One might ask, can this reputation be regarded as socially responsible behavior?. A stakeholder perspective, it can be seen as a single dimension because it produces different and high quality products. However, this does not qualify the firm if it has a low CSR rating and this is a strategic action that reflects a differentiation strategy.
The reputation of the firm is largely built on the quality of their products, services, produce unique and different products enjoy premium benefits for high quality products. That is, reputation is built over time; need to be in line with the firm's independent CSR assessment in order to achieve a better performance, suppose a firm have a positive number added to a negative number, there are three possible outcomes: + A + -B, if A> B we know for sure the result is positive, if A <B we know for sure the result is negative. If A = B the result is 0. In the CSR and reputation context, the same logic applies, and both CSR and existing reputation must be positive to trigger CSR feasibility, (Alshammari, 2015).
H3: Corporate Reputation moderates between Environmental Accounting and Corporate Performance at IDX firms that have an environmental impact for 2012-2016 periods.
The influence of Corporate Reputation as a moderator of the relationship between Corporate Social Responsibility and Corporate Performance
The firm's reputation has been debated to affect the firm's financial performance, for an example, Turban & Greening build theory over social identity and find CSR performance is positively related to the reputation and attractiveness of the firm as an entrepreneur, can attract potential talented employees, can set profits in an industry where competition for high human capital and resources.
Employees want to work for reputable firms and have unique brand names, have a loyalty and commitment to it, firms with strategic skills such as human capital capability and technology-specific assets will utilize competencies to create and sustain a competitive advantage, the relationship between these two constructions is positively related to suggest by Arendt & Sebastian. The firm's reputation play a moderate role in such relationships, firm activity undertakes to improve its reputation, where CSR is a key pillar, is important to create a better reputation and therefore increase employee capital commitments, (Alshammari, 2015).
H4: Corporate Reputation moderates between Corporate Social Responsibility and Corporate Performance at IDX companies that have an environmental impact for the 2012-2016 periods.
RESEARCH METHODOLOGY
In general research can be interpreted as a scientific way to get data with a specific purpose and for certain uses. In conducting the research should determine the research method. The research design uses associative method with quantitative approach.
Association research is a research that aims to determine the influence or relationship between two or more variables. Type of associative research has the highest level when compared with descriptive or comparative research, while the quantitative approach is more emphasis on meaning, reasoning, the definition of a particular situation, more researching things related to everyday life, (Sugiyono, 2014).
Sekaran & Bougie (2013) defines quantitative methods as a simple descriptive method of the contained variables and builds statistical relationships between variables through complex statistical modeling. It is used to explain, predict data and to obtain sampling probability and requires a larger sample size compared to qualitative methods.
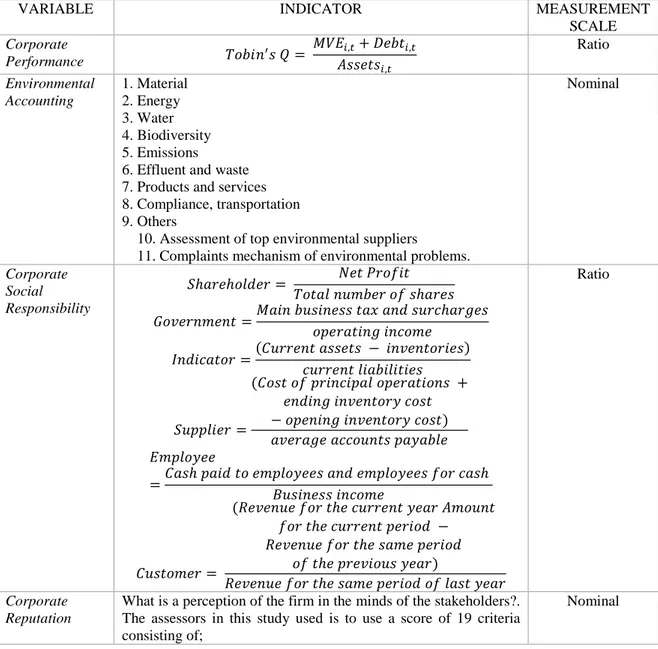
Variables and Measurements
The variables used consists of dependent, independent variables and proxies, as follow;
Table 1 Definition of Variable Operationalization
VARIABLE INDICATOR MEASUREMENT
SCALE Corporate Performance = , + , , Ratio Environmental Accounting 1. Material 2. Energy 3. Water 4. Biodiversity 5. Emissions
6. Effluent and waste 7. Products and services 8. Compliance, transportation 9. Others
10. Assessment of top environmental suppliers
11. Complaints mechanism of environmental problems.
Nominal Corporate Social Responsibility ℎ ℎ = ℎ ! " = # $ℎ % & % $ ' $ =() − " + $ && =
() & $ & & + % " , $
− & % " , $ + " % $$ & , & ,
=) ℎ & & , & , $ ℎ
- $ ) = (. " ℎ $ , ℎ $ & − . " ℎ & ℎ & " , + . " ℎ & , Ratio Corporate Reputation
What is a perception of the firm in the minds of the stakeholders?. The assessors in this study used is to use a score of 19 criteria consisting of;
1. The firm's investment in information technology. 2. Quality of service or product
3. Financial Reliability
4. Innovation and new product development 5. Quality Management
6 Social benefits and employee rights 7. Policy and salary range
8. Improvement of employee qualifications 9. Marketing and sales strategies
10. Communication and public relations 11. Employee qualification
12. Ethics in competitive behavior 13. Employee satisfaction
14. Consumer satisfaction
15. Management and enterprise transparency 16. Value Creation for investors
17. Social Responsibility
18. Integration into the international market
19. Contribution of investigations to regional economies and the economy as a whole
DATA ANALYSIS METHOD
A number of statistical procedures have been used to examine the effects of moderation that was hypothesized before, one of which exists with moderated multiple regression (MMR) or moderate regression.
Several independent evaluations conducted over the last four decades indicate that MMR is an appropriate method for detecting the influence of moderator variables.
MMR is a technique often used to detect the effects of moderator; MMR were used in at least one or two items to detect moderate effects in applied psychology journals from 1991 to 1992, (Aguinis, 1995).
MMR consists of comparing two least squares regression equations or commonly known as OLS, criteria of the dependent variable Y, the predictor X and the second predictor Z are hypothesized to be the moderator variable. The equation of the 1st model shows the least common sample-based squares regression used to test the main effect model additives to predict Y from X and Z, while the 1st regression model is as follows;
) & $ = / + 01) . + 02 + 03). + 4 (Equation 1)
Where, / = intercept
01 - 02 = slope X1-X2
03 = slope Z (moderator)
In equation 1, data population used must meet the four requirements of character assumption: (1) the expected residual value is 0 (E (e) = 0) or the residual value has a normal distribution, (2) the residual value is not auto correlated in each period of sample,
(3) residuals have a constant variance of each value in each predicator or there is no heteroscedasticity, and (4) the variables X and Z no high collinearity or no multicollinearity.
The second equation is formed by creating a new variable, the result between the predicator (i.e., X * Z), and entering into the equation known as the third variable term (moderating variable), equation as follows;
) & $ = / + 01) . + 02 + 03). + 05) . ∗ ). + 07 ∗ ). + 4 (Equation 2)
Where,
05 - 07 = slope X1*Z – X2*Z
ANALYSIS AND DISCUSSION Data Description
This study the data used is secondary data from the annual report of 50 companies listed on the Indonesia Stock Exchange 2012-2016 that meets the criteria that have been determined.
The firms to be sampled are the manufacturing firms group with the determination of purposive sampling method, with criteria as follows;
Table 2 - Data Description Research Objects
Amount
Manufacturing firms for 2012-2016 periods 690 Which does not publish an annual report containing an environmental or
corporate social responsibility report for 2012-2016 periods
(96)
Outlier Test (13)
Number of sample firms 37
Number of years research 5
Number of samples during research 185 Source: processed researchers
Based on the above table, manufacturing firms listed in Indonesia Stock Exchange (IDX) respectively for 2012-2016 periods were 690 firms or 138 firms per year and which do not publish annual reports containing the environmental report, annual corporate social responsibility report were 480 firms or 96 firms per year. Outlier test aims to see data that has a very large residual value, (Gujarati, 2010), suppose data owned outlier value; its means that the element of the sample contains a residual value is very large and must be removed. Based on outlier test in data regression model to be analyzed, found some data that have a very large value compared to the other, outlier test results were 13 firms per year or 65 firms for 5 years, thus, this study after the test outlier was 185 samples for five years or 37 sample firms +per year.
Descriptive Statistics
Table 4.2 Descriptive Statistics
N Minimum Maximum Mean Standard.
Deviation Tobin’s Q 185 .20 2.49 .9766 .48366 Shareholder 185 -37.14 939654.13 24081.0311 137063.42299 Government 185 -.19 2.43 .2669 .26564 Indicator 185 -.72 12.41 1.6793 1.74112 Supplier 185 -2.72 5.20 .6811 .94203 Employee 185 -4.26 65.44 2.6555 8.04978 Customer 185 -.91 21.87 .1961 1.61389 EA 185 .42 .83 .6335 .15015 CR 185 .42 .95 .7202 .12446 Valid N (listwise) 185 Source: Processed by SPSS
Based on table 3 above, it can be seen that the object under study (N) in 2012-2016 is as many as 185 firms, the above table its read the value of minimum, maximum, mean, and standard deviation of each variable, this table is used to assist in identifying the size of deviation on each variable affecting with each other.
Descriptive statistical analysis shows the following results;
In the Tobin's Q variable, the statistical results show a minimum value of 0.20, Lionmesh Prima in 2014 and a maximum value of 2.49, Gudang Garam in 2012, the average value of Tobin's Q is 0.9766. The standard deviation score of 0.48366 shows the variation contained in the Tobin's Q variable. The lower standard deviation value of the mean indicates that the distribution of the low data variable or the gap is quite low. These results also indicate that the results which is quite good, because the standard deviation is a very high reflection deviation, so the spread of data shows normal results and does not cause bias.
Research result 1;
Corporate social responsibility is proxies KLD index, reputation index, pollution control and environmental protection related indicators, based on stakeholder theory to measure CSR, mainly from shareholders, government, creditors, suppliers, staff, customers 6 aspects to measure the CSR of manufacturing companies.
The first CSR indicator is shareholders; this proxy is used to measure how much the firm creates value for the firm shareholder that has an important role in building the internal management mechanism, the statistic shows
the minimum value of -37.14, Holcim Indonesia in 2016 and the maximum value of 939,654.13, Semen Indonesia in 2014. The average shareholder value is 24, 081, 0311. The standard deviation value of 137,063,42299 indicates variations contained in the shareholder variable, this result explains that the standard deviation value higher than the average indicates a high variable data distribution or a high enough gap from the shareholder data. These results also indicate that the results are not good. Because the standard deviation is a very high reflection deviation, so the dissemination of data shows abnormal results and cause bias.
The second CSR indicator is government, this proxy is used to measure the firm should pay attention to the implementation of responsibility to the government, to some extent, to prevent political risks. Recognizing and analyzing the advantages and disadvantages of the law, it can play a risk-prevention role, so internal control concepts can be more perfect. The firm is responsible to the government and provides policy support for sustainable and stable development. In government variables, statistical results show a minimum value of -0.19 i.e. (Eratex Djaja, 2016) and a maximum value of 2.43 i.e. gudang garam on 2012. The average value of government is 0.2669. The standard deviation value of 0.26564 shows the variations contained in government variables. The lower standard deviation scores from the mean indicate that the distribution of low data variables or the low gap of government data. These results also indicate that the results are quite good. This is because the standard deviation is a very high reflection deviation, so the spread of data shows normal results and does not cause bias.
The third CSR is variable, the proxy is used to view the internal control of a high-level firm, and the creditor will see more signals of protection, and then relax the conditions of the debt contract to the firm's feedback. In the indicator variable, the statistical result shows the minimum value of -0.72 i.e. Indah Kiat Pulp in 2012 and the maximum value of 12, 41 i.e. Duta Pertiwi Nusantara in 2016. The average value of the indicator is 1.6793 and standard deviation is 1.74112 indicates the variations contained in the indicator variable, its explains that the standard deviation value higher than the average indicates a high variable data distribution or a high enough gap from the data indicator. These results also indicate that the results are not good. Because the standard deviation is a very high reflection deviation, so the dissemination of data shows abnormal results and cause bias.
The fourth CSR indicator is a supplier, this proxy is used through internal control activities, using firm assets rationally, and suppliers can be paid on time. The faster the repayment of the firm, the more profitable the interests of suppliers. Often, information between companies and suppliers is often asymmetric, easy to lead to unreasonable market allocation of resources; good internal controls can play a role in signal transmission. In the supplier variables, statistical results show a minimum value of -2.72, Lionmesh Prima Indonesia in 2015 and a maximum value of 5.20 Astra Otoparts in 2013. The average supplier value of 0.6811. The standard deviation score of 0.94203 indicates the variation contained in the supplier variable, this result explains that the standard deviation value higher than the average indicates a high variable data distribution or a high enough gap from supplier data. These results also indicate that the results are not good. Because the standard deviation is a very high reflection deviation, so the dissemination of data shows abnormal results and cause bias.
The fifth CSR indicator is an employee, this proxy used as an internal control that influences decision making, at the same time, also affects the implementation of decision making. Good internal control not only allows companies to rationally allocate resources, but also makes staff perform their jobs better in employee variables, statistical results show a minimum value of -4.26 of Holcim Indonesia in 2016 and a maximum value of 65.44 is Indo Spring in 2015. The average value of employee is 2, 6555. The standard deviation score of 8, 04978 indicates the variation in the employee variable, this result explains that the standard deviation value higher than the average indicates a high variable data distribution or a high enough gap of employee data. These results also indicate that the results are not good. Because the standard deviation is a very high reflection deviation, so the dissemination of data shows abnormal results and cause bias.
In the customer variable, the statistical results show the minimum value of -0.91, (Budi Stracth & Sweetener, 2014) and the maximum value of 21.78 is (Budi Stracth & Sweetener, 2013). The average value of the customer is 0, 1961. The standard deviation value of 1.61389 indicates the variation contained in the customer variable, this result explains that the standard deviation value higher than the average indicates a high variable data distribution or a high enough gap of customer data. These results also indicate that the results are not good. Because the standard deviation is a very high reflection deviation, so the dissemination of data shows abnormal results and cause bias.
In the environmental accounting variable, the statistic shows the minimum value of 0.42, Tiga Pilar Sejahtera Food in 2013 and the maximum value of 0.83, Cahaya Kalbar in 2013. The average value of environmental
accounting is 0.6335. The standard deviation value of 0.15015 shows the variations contained in the environmental accounting variable. These results explain that the higher than average standard deviation scores indicate high distribution of data variables or a high gap of environmental accounting data. These results also indicate that the results are not good. Because the standard deviation is a very high reflection deviation, so the dissemination of data shows abnormal results and cause bias.
In the corporate reputation variable, the statistical results show the minimum value of 0.42, Indal Aluminum Industry in 2013 and the maximum value of 0.95, Sepatu Bata in 2016. The average corporate reputation value is 0.7202. The standard deviation score of 0.12246 indicates variations contained in the corporate reputation variable. This result explains that the standard deviation value higher than the average indicates the distribution of high data variables or a high gap of corporate reputation data. These results also indicate that the results are not good. Because the standard deviation is a very high reflection deviation, so the dissemination of data shows abnormal results and cause bias.
Q = 0,792 – 0,215 Shareholder + 0,158 Government – 0,234 Indicator + 0,247 Supplier – 0,184 Employee – 0,025 Customer – 0,076 Environmental Accounting + 0,119 Corporate Reputation + e
Table 4 – T Test (Partial Test) – REGRESSION MODEL 1 Variable B Sig. Conclusion
Constant 0,792 0,000 Shareholder -0,215 0,002 Ha accepted Government 0,158 0,021 Ha accepted Indicator -0,234 0,001 Ha accepted Supplier 0,247 0,000 Ha accepted Employee -0,184 0,007 Ha accepted Customer -0,025 0,702 Ha accepted Environmental Accounting -0,076 0,265 Ha denied
Corporate Reputation 0,119 0,099 Ha denied Source: processed by SPSS
REGRESSION MODEL 2
Q = -0,825 + 1,034 Shareholder + 0,181 Government – 0,215 Indicator + 0,263 Supplier – 0,206 Employee – 0,033 Customer + 0,737 Environmental Accounting + 0,709 Corporate Reputation – 1,094 Shareholder_cr – 0,314 Government_cr + 0,385 Indicator_cr – 2,489 Supplier_cr + 1,657 Employee_cr + 0,671 Customer_cr -
1,140 Environmental Accounting_cr + e
Table 5 – T Test (Partial test) – REGRESSION MODEL 1
Variable B Sig Conclusion
Constant -0,825 0,353 Shareholder 1,034 0,327 Ha denied Government 0,181 0,008 Ha accepted Indicator -0,215 0,002 Ha accepted Supplier 0,263 0,000 Ha accepted Employee -0,206 0,002 Ha accepted Customer -0,033 0,616 Ha denied
Environmental Accounting 0,737 0,114 Ha denied Corporate reputation 0,709 0,022 Ha accepted
Shareholder_CR -1,094 0,221 Ha denied Government_CR -0,314 0,578 Ha denied Indicator_CR 0,385 0,715 Ha denied Supplier_CR -2,489 0,002 Ha accepted Employee_CR 1,657 0,025 Ha accepted Customer_CR 0,671 0,006 Ha accepted
Environmental Accounting_CR -1,140 0,063 Ha denied
Hypothesis 1
Ho1: No environmental accounting with firm performance.
Ha1: including the influence of environmental accounting with firm performance.
Based on the result of partial regression test (t-test) shown in Table 4 it is known that the environmental accounting variable has a sig value of 0.265> 0.05, it shows the environmental accounting variable is not significant at 5% level, so the decision is Ha rejected (Ho accepted). This indicates that there is no effect of environmental accounting with corporate’s performance.
This result is not in line with research conducted by Guthrie and Parker (1990) who found that companies that have poor performance will reveal less environmental performance. These results indicate that the high level of disclosure of environmental performance will not affect the size of the firm's performance.
Hypothesis 2
Ho2: There is no influence of corporate social responsibility with corporate performance. Ha2: There is influence of corporate social responsibility with corporate performance.
Based on the result of partial regression test (t-test) shown in table 4 it is known that corporate social responsibility variable measured by shareholder has sig value 0.002 <0.05, it shows significant shareholder at 5% level. Government has a sig value of 0.021 <0.05, this indicates a significant government level of 5%. Indicator has sig value 0.001 <0,05, this indicates significant indicator at level 5%. Supplier has a sig value of 0,000 <0.05, this indicates a significant supplier at the 5% level. Employee has a sig value of 0.007 <0.05, this indicates significant employee at level 5%, customer has a value of sig 0.702> 0.05, this shows the customer is not significant at the level of 5%.
This results indicate that corporate social responsibility is very important to be disclosed in the annual report, because from an economic perspective, firm swill disclose an information if the information will increase its value. By applying corporate social responsibility, the firm hopes to gain social legitimacy and maximize its financial strength in the long term and proves that firms expressing their social activities expect a positive response by market participants. Implementation of social responsibility activities can be done by spending social costs to conduct social activities. Manufacturing firm is one firm that produces waste of production that can disrupt the surrounding environment. So inevitably the manufacturing firms have to spend a number of costs to manage waste and reduce pollution. Manufacturing firms in the production process also requires a lot of manpower because from the beginning to prepare raw materials until the settlement process.
Therefore, the welfare and safety of employees must be considered by the firms, to maintain the welfare of employees of the firm must provide social costs in the form of employee costs. Employee welfare costs may include incentives, benefits, employee benefits, pensions, and the cost of employees then employees will feel appreciated and will be more active in the work.
Thus it can be concluded that the cost of employees can increase job satisfaction that affects employee productivity and will have implications for the firm's ability to create revenue through sales. If the firm's social concern for the welfare of employees gets sympathy from the community, and the society can accept the price and the quality of the resulting product, as a result the firm will have a good sales performance.
Hypothesis 3
Ho3: Corporate Reputation does not weaken the relationship between Environmental Accounting and Corporate
Performance.
Ha3: Corporate Reputation weakens the relationship between Environmental Accounting and Corporate Performance.
Based on the result of partial regression test (t-test) shown in Table 5, it is known that the corporate reputation variable moderate environmental accounting has a sig value of 0.063> 0.05, this indicates the corporate reputation does not moderate environmental accounting and shows that corporate reputation does not weaken the relationship between environmental accounting and corporate performance.
This result is not in line with Alshammari (2015) and shows that the reputation of the firm cannot strengthen or weaken the environmental accounting conducted by the firm to affect firms performance.
Hypothesis 4
Ho4: Corporate Reputation does not weaken the relationship between Corporate Social Responsibility and Corporate
Performance.
Ha4: Corporate Reputation weakens the relationship between Corporate Social Responsibility and Corporate Performance.
Based on the result of partial regression test (t-test) shown in Table 5, it is known that corporate social responsibility variable measured by shareholder moderated by corporate reputation has sig value 0.221> 0.05, it shows the shareholder is not significant at 5% level and shows that corporate reputation does not moderate corporate social responsibility and indicate that corporate reputation does not weaken / strengthen the relationship between corporate social responsibility and corporate performance.
Corporate social responsibility variables as measured by government moderated corporate reputation have a sig value of 0.578> 0.05, this indicates the government is not significant at the 5% level and shows that corporate reputation does not moderate corporate social responsibility and indicate that corporate reputation does not weaken / strengthen the relationship between corporate social responsibility and corporate performance.
Corporate social responsibility variable measured by indicator moderated by corporate reputation has sig value 0,578> 0,05, it shows indicator is not significant at level 5%, that corporate reputation does not moderate corporate social responsibility and indicate that corporate reputation does not weaken / strengthen the relationship between corporate social responsibility and corporate performance.
Corporate social responsibility variables as measured by suppliers moderated by corporate reputation have sig value 0.002 <0.05, this indicates a significant supplier at the 5% level, with regression coefficient of -2.489, corporate reputation of moderating corporate social responsibility and indicate that corporate reputation weakens the relationship between corporate social responsibility and corporate performance.
Corporate social responsibility variables as measured by employee moderated corporate reputation have a sig value of 0.025 <0.05, it shows significant employee at 5% level, with regression coefficient of 1.657, corporate reputation of moderating corporate social responsibility and indicate that corporate reputation strengthens the relationship between corporate social responsibility and corporate performance.
Corporate social responsibility variable measured by customer that moderated corporate reputation has sig value 0.006 <0.05, this shows significant customer at level 5%, with coefficient of regression equal to 0,671, corporate reputation of moderating corporate social responsibility and indicate that corporate reputation strengthens the relationship between corporate social responsibility and corporate performance.
This result is in line with Alshammari (2015) and explains that companies with good reputations can improve corporate social responsibility activities that will be done to improve the firm's performance.
CONCLUSION AND RECOMENDATION
Research samples were manufacturing firms which has been listed in Indonesia Stock Exchange (IDX) for 2014-2016 periods, and there were not many manufacturing firms provide data on the variables required.
This study results is less than the maximum because of the influence of corporate social responsibility and environmental accounting with firm value as a moderation variable was 20.7%, so there are many other variables that have an influence the firms value that is not examined.
RECOMMENDATION
Firms should pay attention to the indicators that shape corporate reputation to help firms in carrying out corporate social responsibility activities that will have an impact on corporate performance. Investors should see the reputation of the firm because firms that have a good management will pay attention to corporate social responsibility activities that will impact the firm’s performance that can bring benefits to investors. For further research it is suggested to use all listed firms which provide data about the variables needed in this research so that the result could be maximal and add the other variables that are not researched.
REFERENNCE
Ali, R., Lynch, R., Melewar, T., & Jin, Z. (2015). The Moderating Influences on the Relationship of Corporate Reputation with Its Antecedents and Consequences: a Meta-Analytic Review. Journal of Business Research 68, pp. 1105-1117.
Alshammari, M. (2015). Corporate Social Responsibility and Firm Performance: The Moderating Role of Reputation and Institutional Investors. International Journal of Business and Management; Vol. 10, No. 6, pp. 15-28.
Bourguignon, A. (1995). Peut-on Definer La Performance? Revue Francais de Gestion.
Dorina, P., Victoria, B., & Diana, B. (2012, July). Aspects of Firm Performance Analysis Based on Relevant Financial Information and non Financial. Economic Science Series, 1, pp. 956-961.
Hansen, D. R., & Mowen, R. (2015). Cornerstones of Cost Management. Canada: Cengage Learning. Lorino, P. (2004). Le Balanced Score Card Revisite: Dynamique Strategique et Pilotage de Performance. Murray, A., Sinclair, D., Power, D., & Gray, R. (2006). Do Financial Markets Care About Social and
Environmental Disclosure? Accounting, Auditing & Accountability Journal, Vol. 19, No. 2, pp. 228-255.
Nazari, J. A., Hrazdil, K., & Mahmoudian, F. (2017). Assesing Social and Environmental Performance Through Narrative Complexity in CSR Reports. Journal of Contemporary Accounting & Economics 13, pp. 166-178.
Niculescu. (2003). Dignistic Global Strategy. Editura Economica.
Omran, M. A. (2015). Theoretical Perspectives on Corporate Social Responsibility Disclosure: A Critical Review. International Journal of Accounting and Financial Reporting, Vol. 5, No. 2, pp. 38-55.
Ponzi, L. J., Fombrun, C. J., & Gardberg, N. A. (2011). Rerak™ Pulse: Conceualizing and Validating a Short-Form Measure of Corporate Reputation. Corporate Reputation Review Volume 14 Number 1, pp. 15-35. Pujiasih. (2013). Pengaruh Kinerja Lingkungan Terhadap Kinerja Keuangan Dengan Corporate Social
Responsibility (CSR) Sebagai Variabel Intervening. Semarang: Universitas Negeri Semarang.
Rakos, I.-S., & Antohe, A. (2014, October). Environmental Cost - An Environment Management Accounting Component. International Journal of Academic Research in Accounting, Finance and Management Sciences, Vol. 4, No.4, pp. 166-175.
Sawitri, A. P. (2017, Mei 17). Analisis Pengaruh Pengungkapan Akuntansi Lingkungan dan Kinerja Lingkungan Terhadap Nilai Perusahaan. Seminar Nasional & Call For Paper, FEB Unikama, pp. 177-187.
Su, W., Peng, M. W., Tan, W., & Cheung, Y.-L. (2014, November 19). The Signaling Effect of Corporate Social Responsibility in Emerging Economies. J Bus Ethics, pp. 1-13.
Tatiana, D., & Marioara, B. (2012, July). Financial Performance Versus non Financial Performance Case Study at Antibiotice Trading Firm IASI. Economic Science Series, 1, pp. 901-909.
Tomak, S. (2014). Corporate Reputation and Financial Performance of Firms in Turkey. Niğde Üniversitesi İİBF Dergisi, Cilt: 7, Sayı: 1, pp. 289-303.
Vázquez, D. G., & Sánchez-Hernández, M. I. (2014). Structural Analysis of The Strategic Orientation to Environmental Protection in SMEs. BRQ Business Research Quarterly 17, pp. 115-128.
Yeom, J. H. (2012). Corporate Social & Environmental Accounting, Physical Performance, and Reputation: How are they related and which matters to financial decision-makers? United Kingdom: University of Bath, School of Management.
Yongming, Z., & Yini, S. (2017). The Impact of Coupling Interaction of Internal Control and CSR on Corporate Performance-Based on The Perspective of Stakeholder. Procedia Engineering 174, pp. 449-455. Yusoff, H., Mohamad, S. S., & Darus, F. (2013). The Influence of CSR Disclosure Structure on Corporate
Financial Performance: Evidence from Stakeholders' Perspectives. Procedia Economics and Finance 7 , pp. 213-220.