Accounting Faculty Research and Publications
Business Administration, College of
4-1-2012
Ex Ante Severance Agreements and Timely
Disclosures of Bad News
Qianhua Ling
Marquette University, qianhua.ling@marquette.edu
Accepted version.
Journal of Accounting, Auditing & Finance
, Vol. 27, No. 2 (April, 2012): 177-207.
DOI
. © 2012 Sage Publications. Used with permission.
Journal of Accounting, Auditing & Finance, Vol. 27, No. 2 (2012): pg. 177-207. DOI. This article is © 2012 Sage Publications and permission has been granted for this version to appear in e-Publications@Marquette. 2012 Sage Publications does not grant permission for this article to be further copied/distributed or hosted elsewhere without the express permission from 2012 Sage Publications.
1
Ex-Ante Severance Agreements and
Timely Disclosure of Bad News
Qianhua (Q.) Ling
Accounting Department, Marquette University
Milwaukee, WI
Abstract
This study explores the puzzle of CEO severance agreements by examining the association between the existence of ex ante severance agreements and the timeliness of bad news disclosure. The results suggest that the single-trigger severance agreement alone plays a role (which may not be causal) in eliciting timely disclosure of bad news. The association between this severance agreement and timely disclosure of bad news is stronger among the CEOs with a highly variable pay structure than among the CEOs with a low variable pay structure. In the last year of the CEO’s tenure where the performance is poor, the association between this severance agreement and timely disclosure of bad news remains positive. The results are consistent with the theory of information disclosure by Inderst and Mueller (2005) and Laux (2008).
Journal of Accounting, Auditing & Finance, Vol. 27, No. 2 (2012): pg. 177-207. DOI. This article is © 2012 Sage Publications and permission has been granted for this version to appear in e-Publications@Marquette. 2012 Sage Publications does not grant permission for this article to be further copied/distributed or hosted elsewhere without the express permission from 2012 Sage Publications.
2
1. Introduction
This study explores the puzzle of chief executive officer (CEO) severance agreements by investigating the association between the existence of ex ante severance agreements and the timeliness of bad news disclosures. CEO severance agreements present a puzzle
because in addition to annual compensation they guarantee a
significant amount of money if the CEO’s employment is terminated. This is true even if the termination is based on poor or improper performance. This promise of payment reduces the menace of employment termination that intends to mitigate the moral hazard arising from the separation of ownership and management. The large payment also directly reduces funds available for business operation and sends a negative signal to the incoming executives by rewarding failure (Bebchuk and Fried 2004). Why do boards sign severance agreements with the CEOs?
Accounting literature has examined this issue from different perspectives. In theory, ex ante severance agreements have a positive effect on shareholder wealth. Analytical models suggest that severance agreements align CEOs’ risk preference with that of the firm (Van Wesep 2008), induce CEOs to exert greater effort (Berkovitch et al. 2000, Almazan and Suarez 2003), or encourage CEOs to disclose private information (Inderst and Mueller 2005, Laux 2008). Empirical studies have focused on the determinants of granting the severance agreements (Rusticus 2006) and the magnitude of the severance agreement (Rau and Xu 2008). CEOs in companies with unstable performance and strong corporate governance are more likely to have severance agreements. Studies have also examined theories
explaining the value related to severance. Rau and Xu (2008) report that the value specified in the ex-ante contract is consistent with the hypothesis of human capital risk and inconsistent with the hypothesis of wealth transfer by management. Yermack (2006) examines the actual size of the ex post severance pay (i.e., separation pay) for departing CEOs. He finds evidence consistent with the following theories: separation pay is the result of poor governance; separation pay serves to reduce management human capital risk; and separation pay is used to prevent possible damage by the departing CEO to the company. Except for the study by Rusticus (2006), which examines
Journal of Accounting, Auditing & Finance, Vol. 27, No. 2 (2012): pg. 177-207. DOI. This article is © 2012 Sage Publications and permission has been granted for this version to appear in e-Publications@Marquette. 2012 Sage Publications does not grant permission for this article to be further copied/distributed or hosted elsewhere without the express permission from 2012 Sage Publications.
3
the relation between ex ante severance agreements and CEO turnover, empirical studies have not investigated the actual business outcomes of having severance agreements in place.1 Taking a step in this
direction, this study tests the association between ex ante severance agreements and the timeliness of bad news disclosures.
Following prior literature, severance agreements are studied by type, the single-trigger severance agreement (ST) and the double-trigger severance agreement also called the golden parachute (DT). In addition, severance agreements are studied by the way boards grant them. Boards may grant a single-trigger severance agreement only (STONLY), or a double-trigger severance agreement only (DTONLY), or both (STDT) to their CEOs. Though both types of severance
agreements are triggered by the termination of employment, for the double-trigger agreement the termination must be within a specified period following a defined change in control of the firm. This additional trigger of change-in-control may signal the expectation of takeover bids (Lambert and Larker 1985). Thus it provides the CEO with a disclosure incentive different from the one provided by a single-trigger severance agreement.
Theory predicts that the existence of ex ante severance
agreements and the timeliness of bad news disclosures are positively associated. The separation of ownership and management creates an information advantage for CEOs over boards. CEOs will be indifferent to disclosure or non-disclosure of their private information if boards do not act on the information. It is easy for boards to refrain from
reacting to good news. However, it is difficult for boards to ignore bad news. Given bad news, boards may reallocate resources or even replace the CEO. Intervention from boards makes CEOs unwilling to reveal their private information, especially bad news. An incentive is warranted to induce timely disclosure of bad news (Levitt and Snyder 1997). Severance agreements promise a compensation to offset CEO personal losses from doing so. Severance agreements provide an incentive for CEOs to disclose bad news early.
Using the full sample, a positive association is found between the timeliness of bad news disclosures and the single-trigger
Journal of Accounting, Auditing & Finance, Vol. 27, No. 2 (2012): pg. 177-207. DOI. This article is © 2012 Sage Publications and permission has been granted for this version to appear in e-Publications@Marquette. 2012 Sage Publications does not grant permission for this article to be further copied/distributed or hosted elsewhere without the express permission from 2012 Sage Publications.
4
severance agreement alone (DTONLY) or the combined severance agreements (STDT). An effect by type, ST or DT, is not found. The results are robust after controlling for the possible effect of firm size, historical accounting practice, the demand by debt holders, and the legal environment of the industry. These findings suggest that the single-trigger severance agreement alone plays a role (which may not be causal, but is important) in producing timely disclosure of bad news. The association is also tested in the context of the CEO’s last year of tenure, where performance is poorer than in normal years. It is in poor performance years that timely disclosure of bad news is
especially valuable to boards. The positive association between the single-trigger severance agreement (alone) and the timeliness of bad news disclosures still exists.
Theory also predicts that before reaching the disclosure decision, CEOs may compare their severance pay with the compensation pay. If the severance pay is higher than the
compensation pay, CEOs are likely to disclose the bad news. If the severance pay is lower, CEOs may hide the bad news and keep collecting rent. A significant amount of compensation based on
performance, namely, performance-based pay, enhances the chance of the severance pay being greater than the annual compensation in the poor performance scenario (Inderst and Mueller 2005, Van Wesep 2008). Therefore, a highly variable pay structure is expected to be accompanied by a stronger association between ex ante severance agreements and timely disclosure of bad news.
This study uses different approaches to determine the CEO’s pay structure: the level of the CEO’s performance-based pay, the change in the CEO’s performance-based pay over a three-year time period, and the volatility of the performance-based pay over the CEO’s tenure. A high level of performance-based pay or a wide fluctuation in
performance-based pay reflects the significant influence of
performance and indicates a highly variable pay structure for the CEO. In the subsamples, the positive association between the single-trigger severance agreement and the timeliness of bad news disclosures is stronger among a group of CEOs with a highly variable pay structure than among a group of CEOs with a low variable pay structure. These findings are consistent with the theoretical predictions.
Journal of Accounting, Auditing & Finance, Vol. 27, No. 2 (2012): pg. 177-207. DOI. This article is © 2012 Sage Publications and permission has been granted for this version to appear in e-Publications@Marquette. 2012 Sage Publications does not grant permission for this article to be further copied/distributed or hosted elsewhere without the express permission from 2012 Sage Publications.
5
This study makes two contributions to the literature. First, it complements other work on severance agreements by examining the business outcome of severance agreements. The results suggest that single-trigger severance agreements play a role in timely disclosure of bad news. These findings are consistent with the theory of information disclosure by Inderst and Mueller (2005) and Laux (2008). Together with other studies, they suggest that the impact of one-time rewards on management incentives should not be ignored (Fee and Hadlock 2003, Grinstein and Hribar 2004, Hartzell et al. 2004, Yermack 2006). Second, this study provides insight into corporate governance. The results suggest that boards can use the severance agreement as a mechanism to elicit early disclosure of bad news. This study also provides evidence that pairing the severance agreement with a highly variable pay structure may enhance the power of this mechanism.
The paper proceeds as follows: Section 2 introduces severance agreements and payments. Section 3 discusses the hypotheses and the empirical model. Section 4 explains the sample. Section 5 presents the results, followed by the sensitivity tests in Section 6. Section 7 concludes the paper.
2. Severance Agreements and Payments
Severance agreements promise CEOs pay and benefits if they lose their position. Severance agreements are roughly classified as single-trigger severance agreements and double-trigger severance agreements. The difference between the two types is that under the double-trigger severance agreement, the employment termination must be within a specified period of time following a defined change in control over the firm. Both types of severance agreements qualify the CEO for the pay and benefits if his employment is terminated without cause or he resigns for a good reason. What is considered “cause” varies across firms? The most commonly specified causes are “willful misconduct”, “moral turpitude” and “failure to perform duties”
(Schwab and Thomas 2004). The CEO resigns for a “good reason” if the firm changes his duty, fails to compensate him as promised, or relocates him (Schwab and Thomas 2004). Leaving for a position at another firm is not a good reason for resigning from the present
Journal of Accounting, Auditing & Finance, Vol. 27, No. 2 (2012): pg. 177-207. DOI. This article is © 2012 Sage Publications and permission has been granted for this version to appear in e-Publications@Marquette. 2012 Sage Publications does not grant permission for this article to be further copied/distributed or hosted elsewhere without the express permission from 2012 Sage Publications.
6
employment. Termination for cause or resignation without a good reason does not trigger the severance pay under any type of severance agreements.
An ex-ante severance agreement typically provides two times of the CEO’s annual salary and bonus, allows the CEO to accelerate the vesting of his stock options and restricted stocks, and offers the CEO a supplemental executive retirement plan, insurance, and other
perquisites (Schwab and Thomas 2006, Rau & Xu 2008, Rusticus 2006, Yermack 2006). A termination without cause or a resignation with a good reason awards the departing CEO a similar amount (Schwab and Thomas 2004). However, the amount specified in a
double-trigger severance agreement is usually larger, partly because it is the acquiring firm not the current hiring firm that will make the payment later (Schwab and Thomas 2004). In ex post settlements, CEOs receive more generous pay than what is specified in the severance agreement; CEOs removed from office usually receive a higher separation pay than CEOs who voluntarily retire (Bebchuk and Fried 2003, 2004; Yermack 2006).
3. Hypothesis Development and Empirical Model
Hypothesis Development
The separation of ownership and management creates a situation in which CEOs have an information advantage over boards because they manage the business on a daily basis. A CEO knows his own talents and he learns faster than the board whether his human capital fits the firm, whether the current corporate strategy could succeed, and whether the investment projects will make a profit. The separation of ownership and management also means that CEOs want to maximize their private benefits, which may not be aligned with shareholders’ objectives. When things go wrong, the CEO worries about his private benefits and may be unwilling to reveal negative information. Releasing bad news has an adverse impact on the CEO’s private benefits from different perspectives. Stock markets react negatively to bad news (e.g., Skinner 1994). The CEO’s wealth will shrink as the result of a falling stock price and of a smaller award of
Journal of Accounting, Auditing & Finance, Vol. 27, No. 2 (2012): pg. 177-207. DOI. This article is © 2012 Sage Publications and permission has been granted for this version to appear in e-Publications@Marquette. 2012 Sage Publications does not grant permission for this article to be further copied/distributed or hosted elsewhere without the express permission from 2012 Sage Publications.
7
stock options or restricted stocks. The CEO may also face a termination of employment, loss of directorship, and difficulty in finding another job. With these concerns, some managers admit that they delay the disclosure of bad news, hoping that good news will come out in the subsequent period and then investors will not notice the changes (Graham et al. 2005). Managers intentionally delay bad news and gradually leak good news, leading to asymmetric market reactions to bad news and good news (Kothari et al. 2009).
Lack of private information from managers prevents boards from taking necessary actions to minimize shareholder loss. For example, managers engage in “empire building”, keeping negative present value projects going. Without information on projects, boards are unable to identify the loss creating projects and terminate those projects (Watts 2003). Regardless of their productivity, mangers keep resources to themselves. Without information on individual
productivity, boards cannot re-assign resources for their best use (Eisfeldt and Rampini 2008). Managers undertake projects with excessive risks that the company cannot afford if managers believe that they cannot meet the board’s expectations even given their best effort (Van Wesep 2008). Not knowing management’s ability, boards may have unrealistic expectations, thus creating pressure for
excessive risk taking. Overall, access to management’s private information is important for boards to maximize shareholder value.
An incentive is needed to achieve early disclosure of bad news from the CEO. Levitt and Snyder (1997) model information flow from the agent to the principal. Theoretically, the principal can obtain private information from the agent without cost. If the principal promises not to intervene in the business operation following the information disclosure, the disclosure will not affect the agent’s benefits. Therefore, the agent is indifferent to revealing or hiding the private information. However, if the principal decides to take actions such as reassigning resources or terminating projects based on the revealed information, then the agent will be unwilling to reveal the information. Therefore, the principal has to reward early disclosure of private information if he wishes to avoid non-disclosure or a delay in disclosure. Applying this line of reasoning to the CEO (the agent) and the board (the principal), if the board does not take actions on the
Journal of Accounting, Auditing & Finance, Vol. 27, No. 2 (2012): pg. 177-207. DOI. This article is © 2012 Sage Publications and permission has been granted for this version to appear in e-Publications@Marquette. 2012 Sage Publications does not grant permission for this article to be further copied/distributed or hosted elsewhere without the express permission from 2012 Sage Publications.
8
CEO’s private information, then the board does not need to provide incentive for the CEO to disclose the information. However, if the board wants to take actions given the information, then the board has to reward the early revelation of the private information. In practice, it is easy for boards not to take actions given good news, but difficult not to do so given bad news. An extreme example is that 24 percent of CEOs in Yermack’s (2006) sample were forced to leave by their board.
An ex-ante severance agreement provides an incentive for the CEO to disclose bad news early. Inderst and Mueller (2005) argue that the CEO evaluates the cost and benefit of revealing bad news. If the disclosure costs his job and there is nothing in return, then the CEO will try to hide the information. If he receives a severance pay while losing his job, then the CEO is better motivated to disclose the bad news. Similarly, Van Wsep (2008) argues that severance pay helps the board distinguish high quality from low quality CEOs, because
severance pay induces the low quality CEO to disclose the bad news and then leave. The value of the bad news increases in proportion to the eagerness that the board has for the information. The bad news appears more valuable if the board has an aggressive policy of replacing incumbent CEOs (Laux 2008). These theoretical studies suggest that severance pay offsets some costs that the CEO will incur if the disclosure leads to the termination of his employment, and that the expectation of severance pay encourages the CEO to disclose the bad news early. This leads to the first hypothesis stated in the
alternate form:
H1: The existence of ex ante severance agreements and the timeliness of bad news disclosures are positively associated.
A properly designed compensation package improves the chance of a successful transfer of information from the CEO to the board of directors (Inderst and Mueller 2005, Van Wesep 2008). To make the information transfer work effectively, the CEO’s compensation must include stock options or other forms of performance-based pay. This part of compensation varies with performance. Before coming to the decision to share the news, the CEO will compare the severance pay with the expected performance-based pay if he stays. Without a severance agreement, the low pay based on poor performance is preferred to receiving nothing resulting from being fired. The CEO is
Journal of Accounting, Auditing & Finance, Vol. 27, No. 2 (2012): pg. 177-207. DOI. This article is © 2012 Sage Publications and permission has been granted for this version to appear in e-Publications@Marquette. 2012 Sage Publications does not grant permission for this article to be further copied/distributed or hosted elsewhere without the express permission from 2012 Sage Publications.
9
financially better off hiding the bad news. With a severance agreement, the pay from severance may be greater than the
compensation pay based on poor performance. The CEO is better off disclosing the bad news. A highly variable pay structure lowers the CEO’s expected annual pay in the case of poor performance, which in turn enhances the relative value of the severance pay, thus providing a strong incentive for the CEO to communicate the bad news.
H2: The association between the existence of ex ante severance agreements and the timeliness of bad news disclosures is stronger among CEOs with a highly variable pay structure than among CEOs with a low variable pay structure.
Empirical Model
This study examines disclosures that take the form of
recognizing bad news in accounting earnings. Basu’s (1997) model separates good news and bad news and captures the timeliness of the disclosures. Good news is indicated by positive stock returns and bad news by negative stock returns. The relationship between the stock returns and accounting earnings shows the timeliness of news disclosure. The Basu model is specified as:
EARN = β0 + β1 NEG + β2 RET + β3 NEG * RET + ε (1)
Where EARN is earnings before extraordinary items, RET is the buy-and-hold return, and NEG is a dummy variable that equals 1 for a negative RET, and 0 otherwise. The coefficients on the variable RET
and the interaction term NEG*RET captures the timeliness of good news disclosure and bad news disclosure, respectively.
The Basu (1997) measures may be contaminated by accounting treatment of economic events in the past. To address this concern, the market-to-book ratio (MTB) is included as a control variable in this study’s empirical model because the composition of equity value at the beginning of the year reflects the cumulative effect from accounting practice (Roychowdhury and Watts 2007). This study also controls for other variables that have a potential impact on timely disclosure of
Journal of Accounting, Auditing & Finance, Vol. 27, No. 2 (2012): pg. 177-207. DOI. This article is © 2012 Sage Publications and permission has been granted for this version to appear in e-Publications@Marquette. 2012 Sage Publications does not grant permission for this article to be further copied/distributed or hosted elsewhere without the express permission from 2012 Sage Publications.
10
bad news. These variables are firm size, leverage and litigation risk. They are discussed below.
The empirical model testing the association between ex ante severance agreements and timely disclosure of bad news is as follows:
EARNt = β0 + β1 NEGt + β2 RETt + β3 NEG t*RET t + β4 SIZE t-1
+ β5NEGt * SIZE t-1+β6RET t*SIZE t-1+ β7 NEG t*RET t*SIZE t-1 + β8 MTB t-1 + β9NEGt *MTB t-1+ β10RET t*MTB t-1
+ β11 NEG t*RET t*MTB t-1 + β12 LEVERAGE t-1 + β13 NEGt*LEVERAGE t-1+ β14RET t*LEVERAGE t-1
+ β15 NEG t*RET t*LEVERAGE t-1 + β16 LIT t-1 + β17NEGt *LIT t-1 + β18 RET t*LIT t-1+ β19 NEG t*RET t*LIT t-1 + β20 SA t-1
+ β21 NEGt *SA t-1+ β22RET t*SA t-1 + β23NEG t*RET t*SA t-1 + εt (2)
where NEG*RET*SA is the variable of interest, whose coefficient indicates whether the existence of ex ante severance agreements and the timeliness of bad news disclosures are positively associated. SA
captures the existence of the ex-ante severance agreement by type, a single-trigger severance agreement (ST) or a double-trigger severance agreement (DT), or by the way boards grant them, a single-trigger severance agreement alone (STONLY), a double-trigger severance agreement alone (DTONLY), or both types of severance agreements granted to the same CEO (STDT). The coefficient on NEG*RET*SA is expected to be positive. RET is the buy-and-hold stock return over the same fiscal year as EARN covers. EARN is earnings before
extraordinary items scaled by the market value of equity at the
beginning of the year, and NEG is a dummy variable equal to 1 if RET
is negative and 0 otherwise.
Following LaFond and Roychowdhury (2007), variables SIZE,
MTB, and LEVERAGE take the scaled decile rank values of their respective underlying measures. Each of these variables is the yearly decile rank of its underlying measure from 0 to 9 and then scaled by 9. This step makes the values of these variables fall
Journal of Accounting, Auditing & Finance, Vol. 27, No. 2 (2012): pg. 177-207. DOI. This article is © 2012 Sage Publications and permission has been granted for this version to appear in e-Publications@Marquette. 2012 Sage Publications does not grant permission for this article to be further copied/distributed or hosted elsewhere without the express permission from 2012 Sage Publications.
11
between 0 and 1. The underlying measure of SIZE is the market value of equity (MV), that of MTB is the ratio of market value of equity to book value of equity (MV/BV), and that of LEVERAGE is the ratio of total debt to total assets (DEBT/ASSETS). The predicted sign of the coefficient on NEG*RET*SIZE is negative, as large firms are less likely to report bad news in a timely manner (Givoly, Hayn, and Natarajan 2007, LaFond and Watts 2006). The coefficient on
NEG*RET*MTB is also predicted to be negative, because a high level of unrecorded good news, captured by a high value of MTB, lowers the need to record bad news in the subsequent period (Roychowdhury and Watts 2007). The expected sign of the
coefficient on NEG*RET*LEVERAGE is positive because debt holders exhibit a strong demand for timely disclosure of bad news (Zhang 2004, Wittenberg-Moerman 2008, Ball, Robin and Sadka 2008, Frankel and Roychowdhury 2007, and Beatty, Weber, and Yu 2007). Firms in high litigation risk industries tend to disclose bad news early, so the coefficient on NEG*RET*LIT is predicted to be positive (Basu 1997, Watts 2003). The dummy variable LIT equals 1 if the standard industry classification (SIC) code of the firm falls in one of these ranges, 2833–2836, 3570– 3577, 3600–3674, 5200–5961 and 7370-7374 (Francis, Philbrick, and Schipper 1994).
4. Sample Selection and Descriptive Statistics
RiskMetrics (formerly, Investor Responsibility Research Center - IRRC) provides the severance agreement information. The main
sample starts with the RiskMetrics governance biannual data from 1993 to 2006, with 12,531 observations. New governance data became available in July 1993, July 1995, February 1998, February 2000, February 2002, January 2004 and January 2006. As governance was less likely to change immediately after the information update, this data is most applicable to the fiscal year ending after the cut-off point. Taking the relative relationship between the cut-off month of the RiskMetrics data and the firm fiscal year-end month into consideration, the RiskMetrics 1993 data are matched with Standard & Poor's
Compustat financial data for 1993 and 1994, the RiskMetrics 1995 data with Compustat data for 1995 and 1996, the RiskMetrics 1998
Journal of Accounting, Auditing & Finance, Vol. 27, No. 2 (2012): pg. 177-207. DOI. This article is © 2012 Sage Publications and permission has been granted for this version to appear in e-Publications@Marquette. 2012 Sage Publications does not grant permission for this article to be further copied/distributed or hosted elsewhere without the express permission from 2012 Sage Publications.
12
data with Compustat data for 1997 and 1998, the RiskMetrics 2000 data with Compustat data for 1999 and 2000, the RiskMetrics 2002 data with Compustat data for 2001 and 2002, the RiskMetrics 2004 data with Compustat data for 2003 and 2004, and the RiskMetrics 2006 data with Compustat data for 2005 and 2006. There are 11,303 firm year observations resulting from this step. Out of the 11,303 observations, 10,904 observations have corresponding stock return information from the Center for Research in Security Prices (CRSP). This study retrieved CEO compensation information from Standard & Poor's ExecuComp dataset, which begins with fiscal year 1992. To test hypothesis 2, this study requires that ExecuComp has more than three observations each year in each two-digit SIC industry. This
requirement reduces the sample size to 8,803 observations. Another 34 observations are lost because they have no SIC information. Firms in the utility and financial industries (SIC codes 4900-4999 and 6000-6900) are excluded because such firms are subject to different legal constraints. After deleting these firms, the full sample includes 6,986 observations.
Table 1 presents descriptive statistics on the sample. In Panel A, the statistics show that the mean of ST is 7.7% and that of DT is
63.5%. Approximately 6.8% of CEOs have the single-trigger severance agreement alone (STONLY), 62.6% of CEOs have the double-trigger severance agreement alone (DTONLY), and 0.9% of CEOs have both severance agreements (STDT). This is consistent with other studies of severance agreements that more double-trigger severance agreements are granted than are single-trigger severance agreements that are not contingent on change in firm control (Rusticus 2006; Rau and Xu 2008). On average, the sample has a positive income before
extraordinary items scaled by the beginning market value of equity (EARN). The sample also shows an average of 13.6% of one year buy-and-hold return (RET), but 40.3% of the firms experience a negative return (NEG). The market value of equity (MV) at the beginning of the year varies dramatically across sample firms with an average value of 6.6 billion. The average market-to-book ratio (MV/BV) is 4.1. Twenty-two percent of corporate capital comes from debt (DEBT/ASSETS). Approximately 32.4% of the sample firms are in industries with high litigation risk (LIT).
Journal of Accounting, Auditing & Finance, Vol. 27, No. 2 (2012): pg. 177-207. DOI. This article is © 2012 Sage Publications and permission has been granted for this version to appear in e-Publications@Marquette. 2012 Sage Publications does not grant permission for this article to be further copied/distributed or hosted elsewhere without the express permission from 2012 Sage Publications.
13
Panel B presents the severance agreements granted by year. The grant of single-trigger severance agreements declines from a peak of 11.6% to 4.0%. That of the double-trigger severance agreements increases over time from a low 50% to 76.5%. The number of double-trigger severance agreements is much higher than that of single-trigger severance agreements.
Panel C reports the correlations between the variables. The Pearson product-moment correlations are reported above the diagonal and the Spearman rank-order correlations below the diagonal. The correlation between ST and DT is significantly negative, with a
correlation coefficient of -0.307. ST exhibits a positive correlation with
LIT. DT shows a positive correlation with DEBT/ASSETS. The correlation between EARN and RET is significantly positive and the correlation between EARN and NEG is significantly negative,
suggesting that firms’ accounting systems and the stock market capture similar economic events.
TABLE 1 Descriptive Statistics and Correlations Panel A: Descriptive Statistics
Variable N Mean Dev Std 10th Pctl Quartile Median Lower Quartile Upper 90
th Pctl ST 6986 0.077 0.267 0.000 0.000 0.000 0.000 0.000 DT 6986 0.635 0.481 0.000 0.000 1.000 1.000 1.000 STONLY 6986 0.068 0.251 0.000 0.000 0.000 0.000 0.000 DTONLY 6986 0.626 0.484 0.000 0.000 1.000 1.000 1.000 STDT 6986 0.009 0.097 0.000 0.000 0.000 0.000 0.000 EARN 6986 0.025 0.194 0.044 - 0.022 0.049 0.072 0.101 RET 6986 0.136 0.557 0.390 -0.159 - 0.085 0.329 0.659 NEG 6986 0.403 0.490 0.000 0.000 0.000 1.000 1.000 MV 6986 6561 23002 251 537 1286 3892 11862 MV/BV 6986 4.051 67.925 1.085 1.606 2.410 3.893 6.291 DEBT/ASSSETS 6986 0.220 0.178 0.000 0.068 0.212 0.329 0.439 LIT 6986 0.324 0.468 0.000 0.000 0.000 1.000 1.000
Journal of Accounting, Auditing & Finance, Vol. 27, No. 2 (2012): pg. 177-207. DOI. This article is © 2012 Sage Publications and permission has been granted for this version to appear in e-Publications@Marquette. 2012 Sage Publications does not grant permission for this article to be further copied/distributed or hosted elsewhere without the express permission from 2012 Sage Publications.
14
Panel B: Severance Agreements by Year
Year 1993 1995 1998 2000 2002 2004 2006
N 660 801 1108 1030 1139 1157 1091
Mean Mean Mean Mean Mean Mean Mean
(Std Dev) (Std Dev) (Std Dev) (Std Dev) (Std Dev) (Std Dev) (Std Dev)
ST 0.042 0.099 0.116 0.102 0.068 0.066 0.040
(0.202) (0.298) (0.321) (0.303) (0.251) (0.248) (0.197)
DT 0.535 0.532 0.526 0.607 0.681 0.724 0.765
(0.499) (0.499) (0.500) (0.489) (0.466) (0.447) (0.424)
Panel C: Pearson and Spearman Correlations
Variable ST DT EARN RET NEG MV MV/BV /ASSSETS DEBT LIT
ST 0.307 - 0.015 0.022 -0.002 0.020 0.000 -0.007 0.053 DT 0.307 - -0.020 0.025 - -0.005 0.106 - 0.005 0.083 0.060- EARN -0.003 0.003 0.181 0.177 - 0.023 0.007 -0.038 0.067- RET 0.008 -0.011 0.429 0.596 - 0.026 - -0.012 -0.016 0.026 NEG -0.002 -0.005 0.374 - 0.849 - 0.011 0.016 0.000 0.059 MV -0.008 -0.022 0.021 0.005 0.039 - 0.010 -0.014 0.075 MV/BV 0.021 0.078 - 0.085 - 0.051 - 0.035 0.491 0.027 -0.002 DEBT/ASSSETS 0.026 - 0.103 0.084 0.010 - -0.010 0.042 0.189 - 0.237- LIT 0.053 0.060 - 0.174 - 0.031 - 0.059 0.050 0.145 -0.269 Note:
Variable definitions: ST = 1 if the CEO has a single-trigger severance agreement, and 0 otherwise
DT = 1 if the CEO has a double-trigger severance agreement, and 0 otherwise
STONLY = 1 if the CEO has only a single-trigger agreement, and 0 otherwise
DTONLY = 1 if the CEO has only a double-trigger severance agreement, and 0 otherwise
STDT = 1 if the CEO has both a single-trigger severance agreement and a double-trigger severance agreement, and 0 otherwise
EARN = earnings before extraordinary items scaled by the market value of equity at the beginning of the year
RET = the buy-and-hold stock return over the fiscal year
NEG = 1 if RET is negative, and 0 otherwise
MV = the market value of equity at the beginning of the year
MV/BV = the ratio of the market value of equity to the book value of equity at the beginning of the year
DEBT/ASSSETS = the ratio of total debt to total assets
LIT = 1 if the standard industry classification (SIC) code of the firm falls in one of these ranges, 2833–2836, 3570– 3577, 3600–3674, 5200–5961, and 7370-7374, and 0 otherwise
Journal of Accounting, Auditing & Finance, Vol. 27, No. 2 (2012): pg. 177-207. DOI. This article is © 2012 Sage Publications and permission has been granted for this version to appear in e-Publications@Marquette. 2012 Sage Publications does not grant permission for this article to be further copied/distributed or hosted elsewhere without the express permission from 2012 Sage Publications.
15
In Panel C: The Pearson product-moment correlations are reported above the diagonal and the Spearman rank-order correlations below the diagonal. Bold text indicates significant at the 0.01 and 0.05 level using a two-tailed t-test.
5. Results
In this section, hypothesis 1 will be tested using the full sample. Then hypothesis 1 will be tested in the context of the CEO’s last year in office (a smaller sample). Since CEO turnover relates to
performance to some extent, it is expected that performance in the CEO’s last year of tenure is worse than in other years, thus more bad news will be in this year than in other years. This context provides an opportunity to test the association between the ex-ante severance agreements and the timeliness of bad news disclosures, where having private information from the CEO is more valuable to the board than usual. Following that, the full sample will be partitioned based on the proxies for the pay structure. Model (2) is run within each subsample, i.e., the highly variable pay structure group and the low variable pay structure group, to test hypothesis 2.
Testing H1:
Full Sample
Table 2 reports the test results for the association between the existence of ex ante severance agreements and the timeliness of bad news disclosures. The association is first examined by type of
severance agreements and then by the way boards grant them to the CEO. Column I presents the result for the single-trigger severance agreement. The coefficient on NEG*RET*ST is not significant. This does not support an effect by the single-trigger severance agreement that bad news is disclosed in a timelier manner by CEOs with the single-trigger severance agreement than by CEOs without such a severance agreement. The coefficients on the control variables are all consistent with the literature. The coefficient on NEG*RET*SIZE is negative, supporting the inverse relationship between firm size and timely disclosure of bad news (-0.214). The coefficient on
NEG*RET*MTB is also negative (-0.308). The positive coefficient on
NEG*RET* LEVERAGE (0.117) indicates that firms with a high level of debt disclose bad news early. The coefficient on NEG*RET*LIT (0.065)
Journal of Accounting, Auditing & Finance, Vol. 27, No. 2 (2012): pg. 177-207. DOI. This article is © 2012 Sage Publications and permission has been granted for this version to appear in e-Publications@Marquette. 2012 Sage Publications does not grant permission for this article to be further copied/distributed or hosted elsewhere without the express permission from 2012 Sage Publications.
16
suggests that timely disclosure of bad news is more common in industries with high litigation risk.
Column II reports the results for the double-trigger severance agreements. In general, CEOs with the double-trigger severance agreement do not disclose bad news in a timelier manner than CEOs without such an agreement, as the coefficient on NEG*RET*DT is not significant. The results on the control variables are similar to those in Column I, thus they are not repeated here.
Column III separates the CEOs with one severance agreement from the CEOs with two severance agreements. The coefficient on
NEG*RET*STONLY is significantly positive (0.085), and the coefficients on NEG*RET*DT and NEG*RET*STDT are not significant. The result suggests that bad news is disclosed earlier by CEOs with a single-trigger severance agreement alone than by CEOs without a severance agreement. This is not observed among CEOs with a double-trigger severance agreement alone or CEOs with both types of severance agreements. Using the full sample, hypothesis 1 is supported for the single-trigger severance agreement when it is granted alone to the CEO.
TABLE 2 Tests on the association between severance agreements and timely disclosure of bad news (Full Sample)
(I) (II) (III)
Parameter Est t Est t Est t
Intercept 0.057 4.62 *** 0.053 4.71 *** 0.053 4.45 *** NEG -0.004 -0.25 0.009 0.54 0.006 0.35 RET -0.003 -0.10 0.012 0.42 0.009 0.32 NEG*RET + 0.407 7.00 *** 0.409 6.94 *** 0.397 6.67 *** SIZE 0.002 0.21 0.001 0.12 0.001 0.18 NEG*SIZE -0.007 -0.37 -0.006 -0.34 -0.008 -0.42 RET*SIZE 0.058 2.98 *** 0.059 2.96 *** 0.058 2.94 *** NEG*RET*SIZE - -0.214 -3.02 *** -0.217 -3.04 *** -0.219 -3.07 *** MTB 0.010 1.24 0.012 1.64 0.012 1.51 NEG*MTB -0.013 -0.72 -0.016 -0.88 -0.015 -0.85
Journal of Accounting, Auditing & Finance, Vol. 27, No. 2 (2012): pg. 177-207. DOI. This article is © 2012 Sage Publications and permission has been granted for this version to appear in e-Publications@Marquette. 2012 Sage Publications does not grant permission for this article to be further copied/distributed or hosted elsewhere without the express permission from 2012 Sage Publications.
17 RET*MTB -0.041 -2.24 ** -0.048 -2.88 *** -0.046 -2.62 *** NEG*RET*MTB - -0.308 -4.33 *** -0.300 -4.24 *** -0.301 -4.26 *** LEVERAGE -0.016 -1.62 -0.015 -1.55 -0.016 -1.57 NEG*LEVERAGE 0.041 2.55 *** 0.041 2.61 *** 0.041 2.57 *** RET*LEVERAGE 0.022 0.86 0.020 0.80 0.022 0.83 NEG*RET*LEVERAGE + 0.117 2.06 ** 0.121 2.14 ** 0.113 2.00 ** LIT -0.023 -4.34 *** -0.021 -4.19 *** -0.021 -4.24 *** NEG*LIT 0.018 1.91 * 0.016 1.72 * 0.017 1.80 * RET*LIT 0.002 0.11 -0.003 -0.25 -0.003 -0.24 NEG*RET*LIT + 0.065 1.82 ** 0.069 1.96 ** 0.073 2.05 ** ST 0.000 0.01 NEG*ST 0.024 1.95 ** RET*ST 0.008 0.57 NEG*RET*ST + 0.048 0.97 DT 0.004 1.04 NEG*DT -0.016 -2.14 ** RET*DT -0.015 -2.01 ** NEG*RET*DT + -0.005 -0.18 STONLY 0.001 0.14 NEG*STONLY 0.020 1.54 RET*STONLY 0.008 0.61 NEG*RET*STONLY + 0.085 1.60 ** DTONLY 0.004 1.07 NEG*DTONLY -0.013 -1.59 RET*DTONLY -0.013 -1.71 NEG*RET*DTONLY + 0.013 0.43 STDT -0.001 -0.04 NEG*STDT 0.005 0.14 RET*STDT -0.019 -0.38 NEG*RET*STDT + -0.068 -0.77 N 6986 6986 6986 R2 26.52% 26.58% 26.73% Note:
Variable definitions: ST = 1 if the CEO has a single-trigger severance agreement, and 0 otherwise
DT = 1 if the CEO has a double-trigger severance agreement, and 0 otherwise
STONLY = 1 if the CEO has only a single-trigger severance agreement, and 0 otherwise
Journal of Accounting, Auditing & Finance, Vol. 27, No. 2 (2012): pg. 177-207. DOI. This article is © 2012 Sage Publications and permission has been granted for this version to appear in e-Publications@Marquette. 2012 Sage Publications does not grant permission for this article to be further copied/distributed or hosted elsewhere without the express permission from 2012 Sage Publications.
18
STDT = 1 if the CEO has both a single-trigger severance agreement and a double-trigger severance agreement, and 0 otherwise
EARN = earnings before extraordinary items scaled by the market value of equity at the beginning of the year
RET = the buy-and-hold stock return over the fiscal year
NEG = 1 if RET is negative, and 0 otherwise
SIZE = the yearly decile rank value of the market value of equity at the beginning of the year, scaled by 9
MTB = the yearly decile rank value of the ratio of the market value of equity to the book
value of equity at the beginning of the year, scaled by 9
LEVERAGE = the yearly decile rank value of the ratio of total debt to total assets, scaled by 9
LIT = 1 if the standard industry classification (SIC) code of the firm falls in one of these
ranges, 2833–2836, 3570– 3577, 3600–3674, 5200–5961, and 7370-7374, and 0 otherwise
t-values are based on the firm-clustered standard errors. *, **, and *** indicate significance at the 10%, 5%, and 1% level, respectively. p-values are one-tailed for coefficients with a predicted sign, and two-tailed otherwise.
Departing CEOs
This section examines the timeliness of bad news disclosures in the CEO’s last year in office. The departing CEO sample begins with ExecuComp 1992-2008, with a specific date of departure for the CEO (ExecuComp item: LEFTOFC). CEOs in the financial and utility
industries or departing due to death are deleted. The number of observations declines from 2,820 to 2,289 because of these
restrictions. Next, interim CEOs are dropped from the sample because over their short CEO time, an interim CEO is unlikely to have much influence on the company’s information disclosure policy. An interim CEO is defined as being in office for less than one year. This requires comparing the date of becoming the CEO and the date of departing as the CEO. If the information of the starting date (ExecuComp item: BECAMECEO) is missing from ExecuComp, the data is then collected by hand from the company’s proxy statement or 8-K or news release. Some of the dates retrieved from ExecuComp appear to be mistakes because the year of BECAMECEO is later than the fiscal year they are shown as the CEO. For example, ExecuComp records Bernard Gordon as the CEO of Analogic Corp in 1999 and 2003 while his dates of BECAMECEO are all listed as November 8th, 2006. After checking the public records, it became clear that Bernard Gordon was the CEO of the Company from 1973 to 2000, from 2002 to 2003, and then became the CEO again in 2006. ExecuComp updates all the historical
Journal of Accounting, Auditing & Finance, Vol. 27, No. 2 (2012): pg. 177-207. DOI. This article is © 2012 Sage Publications and permission has been granted for this version to appear in e-Publications@Marquette. 2012 Sage Publications does not grant permission for this article to be further copied/distributed or hosted elsewhere without the express permission from 2012 Sage Publications.
19
dates of becoming the CEO and the departure as the CEO for returned CEOs like Bernard Gordon. For cases like this, this study only keeps the CEO’s last departure from the company as a regular CEO. After deleting the interim CEOs, the departing CEO sample has 2,117 observations.
This study intends to examine the disclosure practice in the departing CEO’s last year of significant influence. 2 A fiscal year is
defined to be under the CEO’s significant influence if the CEO is in office for more than nine months of the fiscal year. This is determined by comparing the CEO’s departure date with the firm’s fiscal year-end date. Specifically, if the CEO was in office for more than nine months in the fiscal year of his departure, then the year of his departure is the last fiscal year under his significant influence. Otherwise, the last fiscal year under his significant influence would be the fiscal year before the year of his departure. The cut-off point of nine months is a subjective but reasonable choice. It ensures that the disclosure practice is
primarily under the departing CEO’s not the incoming CEO’s influence. The departing CEO sample is matched with the RiskMetrics severance data (1990-2006) and Compustat financial data and CRSP stock price information. Some observations are lost during this
matching process because of missing data in one or more of the three datasets. The final sample includes 1,568 observations. The
descriptive statistics for this sample are reported in Table 3. The
statistics support the conjecture that the performance in the CEO’s last year of tenure is worse than in other years. Earnings in Table 3 are lower (EARN = -0.010), compared to those reported in Table 1 (EARN
= 0.025). Stock returns are lower as well (RET =4.9%, NEG =48.7% vs. RET =13.6%, NEG =40.3% in Table 1).
The severance agreement statistics for these departing CEOs are similar to those for the CEOs in the full sample: on average, 7.5% of the CEOs have the single-trigger severance agreement; 6.3% of them only have this agreement, while 1.3% of them have this agreement in addition to a double-trigger severance agreement. Approximately 65.9% of the CEOs have the double-trigger severance agreement; 64.7% of them have this agreement alone, while the other
Journal of Accounting, Auditing & Finance, Vol. 27, No. 2 (2012): pg. 177-207. DOI. This article is © 2012 Sage Publications and permission has been granted for this version to appear in e-Publications@Marquette. 2012 Sage Publications does not grant permission for this article to be further copied/distributed or hosted elsewhere without the express permission from 2012 Sage Publications.
20
1.3% of the CEOs have both a single-trigger severance agreement and a double-trigger severance agreement.
TABLE 3 Descriptive Statistics (Departing CEOs)
Variable N Mean Std Dev 10th Pctl Lower Quartile Median Upper Quartile 90th Pctl ST 1568 0.075 0.264 0.000 0.000 0.000 0.000 0.000 DT 1568 0.659 0.474 0.000 0.000 1.000 1.000 1.000 STONLY 1568 0.063 0.242 0.000 0.000 0.000 0.000 0.000 DTONLY 1568 0.647 0.478 0.000 0.000 1.000 1.000 1.000 STDT 1568 0.013 0.112 0.000 0.000 0.000 0.000 0.000 EARN 1568 -0.010 0.261 0.121 - 0.008 0.044 0.067 0.090 RET 1568 0.049 0.501 0.473 -0.238 - 0.012 0.241 0.561 NEG 1568 0.487 0.500 0.000 0.000 0.000 1.000 1.000 MV 1568 7891 25233 238 559 1533 4798 15833 MV/BV 1568 3.593 20.008 1.061 1.574 2.342 3.870 6.541 DEBT/ASSSETS 1568 0.220 0.174 0.000 0.084 0.210 0.322 0.436 LIT 1568 0.333 0.471 0.000 0.000 0.000 1.000 1.000
Variable definitions: ST = 1 if the CEO has a single-trigger severance agreement, and 0 otherwise
DT = 1 if the CEO has a double-trigger severance agreement, and 0 otherwise
STONLY = 1 if the CEO has only a single-trigger severance agreement, and 0 otherwise
DTONLY = 1 if the CEO has only a double-trigger severance agreement, and 0 otherwise
STDT = 1 if the CEO has both a single-trigger severance agreement and a double-trigger severance agreement, and 0 otherwise
EARN = earnings before extraordinary items scaled by the market value of equity at the beginning of the year
RET = the buy-and-hold stock return over the fiscal year
NEG = 1 if RET is negative, and 0 otherwise
MV =
the market value of equity at the beginning of the year
MV/BV = the ratio of the market value of equity to the book value of equity at the beginning of the year
DEBT/ASSSETS = the ratio of total debt to total assets
LIT = 1 if the standard industry classification (SIC) code of the firm falls in one of
these ranges, 2833–2836, 3570– 3577, 3600–3674, 5200–5961, and 7370-7374, and 0 otherwise
Journal of Accounting, Auditing & Finance, Vol. 27, No. 2 (2012): pg. 177-207. DOI. This article is © 2012 Sage Publications and permission has been granted for this version to appear in e-Publications@Marquette. 2012 Sage Publications does not grant permission for this article to be further copied/distributed or hosted elsewhere without the express permission from 2012 Sage Publications.
21
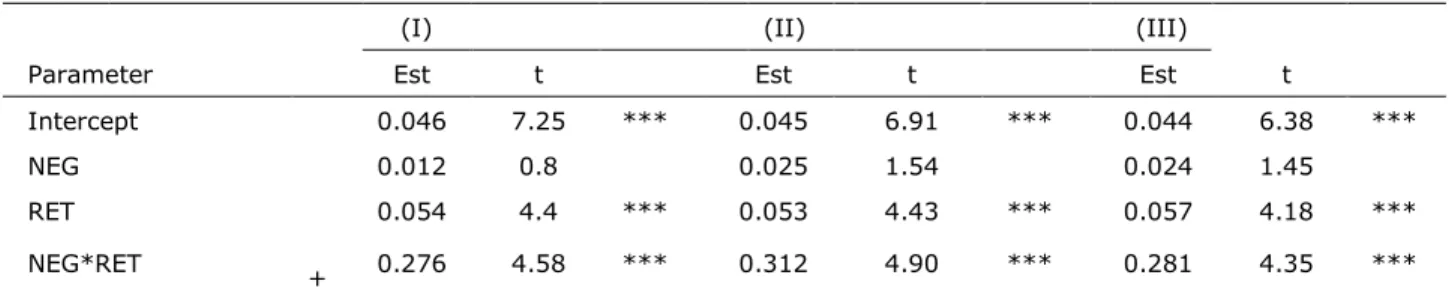
The analyses in Table 4 are similar to those in Table 2. Column I presents the results of the association between the existence of a single-trigger severance agreement and the timely disclosure of bad news. Column II reports the association between the existence of a double-trigger severance agreement and the timely disclosure of bad news. Column III separates the CEOs with one severance agreement from the CEOs with both severance agreements. The coefficient on
NEG*RET*ST is significantly positive (0.395). It suggests that in the CEO’s last year of strong influence, bad news is revealed earlier by CEOs with a single-trigger severance agreement than by CEOs without such an agreement. Column II shows that this phenomenon is not observed among CEOs with the double-trigger severance agreement, as evidenced by the non-significant coefficient on NEG*RET*DT. Consistent with the result in Table 2, the coefficient on
NEG*RET*STONLY is significantly positive (0.416), indicating the strong role played by the single-trigger severance agreement in eliciting timely disclosure of bad news. Neither the coefficient on
NEG*RET*DTONLY nor the one on NEG*RET*STDT is significant. The results in this table provide additional evidence that the existence of ex ante single-trigger severance agreements and timeliness of bad news disclosure are positively related. The single-trigger severance agreement plays an important role in eliciting early disclosure of bad news. The coefficients on the control variables are all in the predicted direction. The coefficients are significantly negative on NEG*RET*SIZE
and NEG*RET*MTB. The coefficients on NEG*RET*LEVERAGE and
NEG*RET* LIT lose their significance but are still positive.
TABLE 4 Tests on the association between severance agreements and timely disclosure of bad news (Departing CEOs)
(I) (II) (III)
Parameter Est t Est t Est t Intercept 0.022 1.13 0.026 1.37 0.028 1.43 NEG 0.064 1.49 0.083 1.79 * 0.069 1.54 RET -0.061 -1.01 -0.046 -0.81 -0.038 -0.69 NEG*RET + 0.862 5.25 *** 0.944 5.23 *** 0.886 4.83 *** SIZE 0.016 0.90 0.017 0.98 0.017 0.97 NEG*SIZE -0.041 -0.79 -0.038 -0.73 -0.044 -0.84
Journal of Accounting, Auditing & Finance, Vol. 27, No. 2 (2012): pg. 177-207. DOI. This article is © 2012 Sage Publications and permission has been granted for this version to appear in e-Publications@Marquette. 2012 Sage Publications does not grant permission for this article to be further copied/distributed or hosted elsewhere without the express permission from 2012 Sage Publications.
22 RET*SIZE 0.038 0.77 0.027 0.56 0.027 0.54 NEG*RET*SIZE - -0.376 -2.20 ** -0.362 -2.10 ** -0.372 -2.14 ** MTB 0.053 2.37 ** 0.048 2.18 ** 0.048 2.15 ** NEG*MTB -0.080 -1.40 -0.081 -1.43 -0.073 -1.28 RET*MTB -0.010 -0.14 0.002 0.02 0.003 0.04 NEG*RET*MTB - -0.669 -3.33 *** -0.692 -3.47 *** -0.675 -3.31 *** LEVERAGE -0.024 -1.24 -0.021 -1.05 -0.021 -1.05 NEG*LEVERAGE -0.011 -0.22 -0.014 -0.28 -0.013 -0.28 RET*LEVERAGE 0.105 1.87 * 0.098 1.72 * 0.101 1.77 * NEG*RET*LEVERAGE + -0.190 -1.20 -0.173 -1.08 -0.185 -1.18 LIT -0.036 -3.50 *** -0.033 -3.26 *** -0.033 -3.20 *** NEG*LIT 0.059 2.29 ** 0.054 2.20 ** 0.053 2.13 ** RET*LIT 0.038 1.24 0.028 0.98 0.025 0.90 NEG*RET*LIT + 0.106 1.07 0.102 1.08 0.110 1.15 ST 0.018 0.79 NEG*ST 0.075 1.11 RET*ST -0.067 -0.97 NEG*RET*ST + 0.395 1.67 * DT -0.006 -0.65 NEG*DT -0.019 -0.82 RET*DT -0.020 -0.83 NEG*RET*DT + -0.091 -0.96 STONLY 0.008 0.32 NEG*STONLY 0.079 1.03 RET*STONLY -0.099 -1.18 NEG*RET*STONLY + 0.416 1.52 * DTONLY -0.008 -0.91 NEG*DTONLY 0.006 -0.26 RET*DTONLY -0.028 -1.22 NEG*RET*DTONLY + -0.036 -0.39 STDT 0.030 1.87 ** NEG*STDT 0.031 0.45 RET*STDT -0.042 -0.83 NEG*RET*STDT + 0.165 0.82 N 1568 1568 1568 R2 30.09% 29.91% 30.36%
Journal of Accounting, Auditing & Finance, Vol. 27, No. 2 (2012): pg. 177-207. DOI. This article is © 2012 Sage Publications and permission has been granted for this version to appear in e-Publications@Marquette. 2012 Sage Publications does not grant permission for this article to be further copied/distributed or hosted elsewhere without the express permission from 2012 Sage Publications.
23
Note:
Variable definitions: ST = 1 if the CEO has a single-trigger severance agreement, and 0 otherwise
DT = 1 if the CEO has a double-trigger severance agreement, and 0 otherwise
STONLY = 1 if the CEO has only a single-trigger severance agreement, and 0 otherwise
DTONLY = 1 if the CEO has only a double-trigger severance agreement, and 0 otherwise
STDT = 1 if the CEO has both a single-trigger severance agreement and a double-trigger severance agreement, and 0 otherwise
EARN = earnings before extraordinary items scaled by the market value of equity at the beginning of the year
RET = the buy-and-hold stock return over the fiscal year
NEG = 1 if RET is negative, and 0 otherwise
SIZE = the yearly decile rank value of the market value of equity at the beginning of the year, scaled by 9
MTB = the yearly decile rank value of the ratio of the market value of equity to the book value of equity at the beginning of the year, scaled by 9
LEVERAGE = the yearly decile rank value of the ratio of total debt to total assets, scaled by 9
LIT = 1 if the standard industry classification (SIC) code of the firm falls in one of these ranges, 2833–2836, 3570– 3577, 3600–3674, 5200–5961, and 7370-7374, and 0 otherwise
t-values are based on the firm-clustered standard errors. *, **, and *** indicate significance at the 10%, 5%, and 1% level, respectively. p-values are one-tailed for coefficients with a predicted sign, and two-tailed otherwise.
Testing H2:
Compensation Structure Determined by the Level of Performance-Based Pay
Hypothesis 2 predicts that the relationship between the
existence of severance agreements and timely disclosure of bad news will be stronger among CEOs with a highly variable pay structure. How to determine a highly variable pay structure versus a low variable pay structure is not clear in the literature and it is a difficult issue. A highly variable pay structure means that the CEO has a large component of his compensation based on performance. This compensation design leads to a high amount of performance-based pay for a year of good performance, while a low amount for a year of poor performance. By contrast, a low variable pay structure is less affected by performance. It produces a low amount of performance-based pay. An extreme example is that regardless of performance a CEO’s performance-based pay is always zero if he only works on salary. A highly variable pay
structure does not always mean a high amount of performance-based pay in annual compensation. However, a high amount of performance-based pay is a signal of a highly variable pay structure for the CEO. Based on this property, the full sample is partitioned into a highly
Journal of Accounting, Auditing & Finance, Vol. 27, No. 2 (2012): pg. 177-207. DOI. This article is © 2012 Sage Publications and permission has been granted for this version to appear in e-Publications@Marquette. 2012 Sage Publications does not grant permission for this article to be further copied/distributed or hosted elsewhere without the express permission from 2012 Sage Publications.
24
variable pay structure group and a low variable pay structure group. Models are run within each subsample.
CEOs’ performance-based pay information is obtained from ExecuComp. The proxy for performance-based pay, PBP, treats salary as the only fixed component paid to the CEO. The performance-based pay is calculated as the total annual compensation minus salary, where the total annual compensation (ExecuComp item: TDC1) includes salary, bonus, other annual compensation, total value of restricted stock granted, total value of stock options granted (using Black-Scholes), long-term incentive payouts, and all other
compensations.
CEO’s performance-based pay may be affected by the overall economy of the year and industry-specific differences in the design of compensation package. Therefore, CEO performance-based pays are sorted by year and industry (defined by the 2-digit SIC code), using all
the observations available in ExecuComp. These observations are then assigned to four groups of equal size, with the lowest performance-based pay in group 1 and the highest performance-performance-based pay in group 4.3 Group 4 is the highly variable pay structure group. The remaining
observations of the full sample constitute the low variable pay structure group.
Table 5 reports the results, with Panel A for the highly variable pay structure group and Panel B for the low variable pay structure group. Panel A Column I presents the results for the single-trigger severance agreement. The coefficient on NEG*RET*ST is significantly positive (0.072), indicating that among CEOs with a highly variable pay structure, bad news is disclosed earlier by CEOs with a single-trigger severance agreement than by CEOs without such an agreement. The coefficient is still negative on NEG*RET*MTB and positive on NEG*RET*LIT. The coefficients on NEG*RET*SIZE and
NEG*RET*LEVERAGE become not significant but are in the predicted direction. Column II tests for the double-trigger severance agreement. The coefficient on NEG*RET*DT is not significant. This indicates that CEOs with this severance agreement do not disclose bad news in a timelier manner. In Column III, the results suggest again that CEOs with the single-trigger severance agreement alone demonstrate the
Journal of Accounting, Auditing & Finance, Vol. 27, No. 2 (2012): pg. 177-207. DOI. This article is © 2012 Sage Publications and permission has been granted for this version to appear in e-Publications@Marquette. 2012 Sage Publications does not grant permission for this article to be further copied/distributed or hosted elsewhere without the express permission from 2012 Sage Publications.
25
tendency to disclose bad news earlier. CEOs with the double-trigger severance agreement alone or with both types of severance
agreements do not show this tendency. The coefficient on
NEG*RET*STONLY is 0.074 in this subsample.
Panel B presents the analysis for the association between ex ante severance agreements and timely disclosure of bad news within the low variable pay structure subsample. The coefficients on the variables of interest, NEG*RET*ST, NEG*RET*DT, NEG*RET*STONLY,
NEG*RET*DTONLY and NEG*RET*STDT, are not significant. The results indicate that among CEOs with a low variable pay structure, bad news is not revealed earlier by CEOs with a severance agreement than by CEOs without a severance agreement. Among these CEOs, severance agreements do not play a role in eliciting timely disclosure of bad news. Turning to the control variables, the signs of the
coefficients on NEG*RET*SIZE, NEG*RET*MTB, and
NEG*RET*LEVERAGE are consistent with the literature. The coefficient on NEG*RET*LIT loses its significance. Combining the results in Panel A and Panel B, H2 is supported.
TABLE 5 Tests on the association between severance agreements and timely disclosure of bad news (Sample Partitioned by Performance-Based Pay Level)
Panel A: Highly Variable Pay Structure
(I) (II) (III)
Parameter Est t Est t Est t
Intercept 0.064 8.05 *** 0.061 6.30 *** 0.065 7.02 *** NEG 0.003 0.16 0.017 0.75 0.011 0.48 RET 0.021 1.45 0.021 1.16 0.016 0.90 NEG*RET + 0.280 4.02 *** 0.308 3.67 *** 0.298 3.36 *** SIZE 0.002 0.30 0.004 0.50 0.004 0.42 NEG*SIZE 0.040 1.78 * 0.037 1.68 * 0.037 1.62 RET*SIZE 0.014 1.02 0.012 0.87 0.011 0.75 NEG*RET*SIZE - 0.110 1.12 0.112 1.15 0.106 1.06 MTB -0.016 -1.68 * -0.016 -1.56 -0.016 -1.57 NEG*MTB -0.067 -2.78 *** -0.068 -2.79 *** -0.066 -2.68 *** RET*MTB -0.028 -1.57 -0.028 -1.38 -0.027 -1.37 NEG*RET*MTB - -0.492 -4.34 *** -0.495 -4.33 *** -0.486 -4.09 *** LEVERAGE 0.000 0.03 0.001 0.13 -0.001 -0.10 NEG*LEVERAGE 0.009 0.41 0.008 0.39 0.011 0.50
Journal of Accounting, Auditing & Finance, Vol. 27, No. 2 (2012): pg. 177-207. DOI. This article is © 2012 Sage Publications and permission has been granted for this version to appear in e-Publications@Marquette. 2012 Sage Publications does not grant permission for this article to be further copied/distributed or hosted elsewhere without the express permission from 2012 Sage Publications.
26 RET*LEVERAGE 0.015 0.98 0.013 0.81 0.019 1.22 NEG*RET*LEVERAGE + 0.045 0.55 0.050 0.61 0.047 0.57 LIT -0.019 -3.70 *** -0.019 -3.74 *** -0.020 -4.11 *** NEG*LIT 0.046 3.59 *** 0.044 3.41 *** 0.046 3.53 *** RET*LIT -0.001 -0.07 -0.001 -0.10 0.003 0.34 NEG*RET*LIT + 0.149 2.69 *** 0.145 2.58 *** 0.141 2.50 *** ST -0.001 -0.09 NEG*ST 0.016 1.00 RET*ST -0.015 -1.11 NEG*RET*ST + 0.072 1.38 * DT 0.003 0.49 NEG*DT -0.015 -1.24 RET*DT 0.001 0.15 NEG*RET*DT + -0.034 -0.78 STONLY -0.005 -0.44 NEG*STONLY 0.015 0.91 RET*STONLY -0.004 -0.32 NEG*RET*STONLY + 0.074 1.25 * DTONLY 0.000 0.02 NEG*DTONLY -0.010 -0.81 RET*DTONLY 0.003 0.37 NEG*RET*DTONLY + -0.022 -0.46 STDT 0.021 0.81 NEG*STDT -0.045 -0.89 RET*STDT -0.068 -4.01 *** NEG*RET*STDT + -0.044 -0.39 N 1806 1806 1806 R2 28.03% 27.97% 28.27%
Panel B: Low Variable Pay Structure
(I) (II) (III)
Parameter Est t Est t Est t
Intercept 0.057 3.88 *** 0.052 3.89 *** 0.053 3.64 ***
Journal of Accounting, Auditing & Finance, Vol. 27, No. 2 (2012): pg. 177-207. DOI. This article is © 2012 Sage Publications and permission has been granted for this version to appear in e-Publications@Marquette. 2012 Sage Publications does not grant permission for this article to be further copied/distributed or hosted elsewhere without the express permission from 2012 Sage Publications.
27 RET -0.013 -0.34 0.013 0.39 0.005 0.14 NEG*RET + 0.433 6.26 *** 0.421 6.03 *** 0.416 5.83 *** SIZE -0.009 -0.94 -0.009 -0.88 -0.008 -0.85 NEG*SIZE -0.024 -1.13 -0.024 -1.13 -0.025 -1.20 RET*SIZE 0.095 3.94 *** 0.091 3.72 *** 0.091 3.81 *** NEG*RET*SIZE - -0.391 -5.20 *** -0.388 -5.16 *** -0.389 -5.19 *** MTB 0.026 2.58 *** 0.029 2.85 *** 0.028 2.73 *** NEG*MTB 0.003 0.15 0.000 0.01 0.002 0.07 RET*MTB -0.065 -2.61 *** -0.073 -3.03 *** -0.069 -2.84 *** NEG*RET*MTB - -0.180 -2.20 ** -0.171 -2.09 ** -0.176 -2.14 ** LEVERAGE -0.023 -1.93 ** -0.020 -1.75 * -0.022 -1.82 * NEG*LEVERAGE 0.061 3.18 *** 0.060 3.16 *** 0.061 3.15 *** RET*LEVERAGE 0.024 0.72 0.017 0.56 0.022 0.66 NEG*RET*LEVERAGE + 0.165 2.41 ** 0.174 2.56 *** 0.163 2.35 ** LIT -0.023 -3.79 *** -0.021 -3.47 *** -0.021 -3.52 *** NEG*LIT 0.008 0.71 0.006 0.56 0.006 0.56 RET*LIT 0.002 0.10 -0.005 -0.29 -0.005 -0.34 NEG*RET*LIT + 0.039 0.95 0.047 1.14 0.051 1.23 ST 0.000 0.01 NEG*ST 0.027 1.93 ** RET*ST 0.024 1.21 NEG*RET*ST + 0.030 0.56 DT 0.004 0.79 NEG*DT -0.015 -1.67 * RET*DT -0.023 -2.06 ** NEG*RET*DT + 0.006 0.18 STONLY 0.003 0.31 NEG*STONLY 0.020 1.34 RET*STONLY 0.021 1.16 NEG*RET*STONLY + 0.063 1.06 DTONLY 0.004 0.83 NEG*DTONLY -0.012 -1.25 RET*DTONLY -0.019 -1.59 NEG*RET*DTONLY + 0.020 0.54 STDT -0.017 -0.48 NEG*STDT 0.045 0.96