Effectiveness of Climate Change Adaptation Strategies:
Household-Level Evidence from Ethiopia
Tsegaye Ginbo Gatiso
Ethiopian Development Research Institute (EDRI), Addis Ababa, Ethiopia Abstract
In response to climate change and variability, farmers use various adaptation strategies.This study examines the effectiveness of those adaptation strategies in ensuring farmers’ food security in rural villages of Boricha from southern Ethiopia. In addition to data obtained from meteorological stations, cross-sectional data is collected interviewing 208 farm households. Analyses show that there is climate change and variability in the area and household adapt using various strategies. Two-Stage Least Square estimation results reveal that rainfall and temperature variability have negative impact on household’s food security. Moreover, results confirm effectiveness of climate adaptation strategies namely soil and water conservation, modern varieties and crop diversification in mitigating climatic risks and ensuring household food security. Results also indicate that education, agricultural extension, access to market and credit are key factors enhancing adaptation decisions. Consequently, programs that augment households’ climate awareness and adaptation decision could help reducing risks pertaining to climate.
Keywords: Climate change and variability, adaptation strategies, household food security, Two-Stage Least Square, Boricha, Sidama, Ethiopia
1. Introduction
There is global consensus about the adverse effect of climate change on agriculture and food production. Rural livelihoods became extremely vulnerable to climate in the case of developing countries. Climate change impacts may exacerbate in these countries due to their economy’s substantial dependence on agriculture sector. For instance, agriculture supports livelihood for the majority of people in Ethiopia. It contributes 80 percent of employment, 90 percent of export revenues and 43 percent of GDP (MoARD, 2010; IMF, 2012). This implies that any negative shock in agricultural sector can cause devastating impacts on the whole economy.
Studies like Mendelsohn et al. (2004), Deressa et al. (2005), Deressa (2007), Yesuf et al. (2008), Deressa and Hassan (2009), Muamba and Kraybill (2010), and Krishna (2011) reported negative impact of climate change on crop production and net farm revenue in low-income countries. In response to the impacts of climate change and variability, farmers use various adaptation strategies so as to reduce risks pertaining to climate change and variability. According to IPCC (2014), adaptation refers to the process of adjustment to actual or expected climate condition and its effects. It can be undertaken at individual or farm-level and national or country level. In both cases, adaptations aim to moderate harms pertaining to climate change or exploit beneficial opportunities.
In view of that, vast majority of previous studies in developing countries have focused on investigating determinants of climate adaptation strategies. Deressa et al. (2008), Hassan and Nhemachena (2008), Seo (2010), Falco et al. (2011a, 2011b) and Tessema et al. (2013) assessed farmers’ perception about climate change and factors affecting their decisions to use adaptation mechanisms. To our knowledge, though growing, there is little evidence on the effectiveness of individual climate adaptation strategies adopted by smallholder farmers. This is particularly important to inform policy makers in identifying most effective adaptation measures that could help reduce farmers’ vulnerability to climate change and variability. In this regard, Molua (2002) for Cameroon and Falco et al. (2011b) for Ethiopia partly assessed the effect of adaptation on food security. Their analyses took crop production and net farm revenue as measures of household food security. But, both crop production and farm revenue can indicate only one dimension of food security i.e. food availability.
However, FAO framework document in 2008 pointed out that any analysis aiming to examine the potential impacts of climate change on food security must be viewed within the larger and multidimensional framework encompassing all of the indicators under observable changes in multiple socio-economic and environmental variables (FAO, 2008). In global as well as Ethiopian contexts, studies examining climate change and multidimensional food security nexus are lacking.
Motivated by the above research gaps, this study aims at identifying common farm-level adaptation options and examining effectiveness of each climate adaptation strategies in ensuring household food security in case of Boricha district in Southern Ethiopia.
2. Climate and Food Security in Boricha
Boricha district is one of the districts found in lowland areas of Sidama zone and part of southern mid-altitude drylands of Ethiopia. It is located 305 km South of Addis Ababa at about 30 km away from Hawassa.
Geographically, the district is positioned at 6º 46' - 7º 01' North and 38º 04' - 38º 24' East with an estimated area of 588.05 square kilometers. For administrative purpose, the district is divided into 39 villages of which 3 villages are semi-urban and the remaining are rural. Semi-urban centers in Boricha are Yirba, Balela and Darara where Yirba is the district administration town. Based on the 2007 census conducted by the CSA, the total population of Boricha district was 250,260 of which 239858 (95.84%) lives in rural areas.
Boricha is most vulnerable district among other districts in Sidama zone. The livelihood of communities is largely based on smallholder farming dependent on indigenous ‘Enset’ (locally named ‘Weese’), maize and coffee production. Though not promoted by the government and religious people, Chat is also produced in the district as cash crop generating income for farmers. The district is characterized by rain deficiency as compared to other areas in the zone. As there are also no water sources for irrigation purpose in the district, agricultural production is totally based on scarce and variable natural rainfall which makes a livelihood most vulnerable to climatic conditions.
According to the SNNPR livelihood zone report in 2012, there are three dominant livelihood zones in Boricha district. These are Sidama Maize Belt Livelihood Zone, Sidama Coffee Livelihood Zone and Bilate Basin Agro-Pastoral Livelihood Zone. Sidama Maize Belt Livelihood Zone is largest livelihood zone and much of the population living in this area was food insecure. They obtain less than half their food needs from their own production. The dominant crop in this area is maize and there also some ‘Enset’ producers. Whereas, the population in Sidama Coffee Livelihood Zone is largely food secure though densely populated. They produce coffee, enset and livestock. The majority of population, about 70 percent, in Bilate Basin Agro-Pastoral Livelihood Zone bases their life on cattle and milk products and food secure.
In general, Boricha district is regarded as one of the food insecurity prone areas in Sidama zone of southern Ethiopia. Significant numbers of people in the district are food and water insecure. As result, the district is subjected to various governmental and non-governmental relief programs including Safety Net, Food for Work and other relief and development schemes.
3. Methodolaogy
3.1. Description of Survey Instruments and Data
The study utilizes both qualitative and quantitative data from primary as well as secondary sources. Cross-sectional data is generated from surveying 208 farm households from selected villages of Boricha district in Southern Ethiopia using questionnaire. Based on feedbacks from the pre-testing stage, further improvements on the questionnaire were made before the survey.
In this study, two climatic variables namely precipitation and temperature are chosen to measure the vulnerability of farm households to climatic shocks. Rainfall time series data is obtained from Ethiopian National Meteorology Agency. However, there is lack of household level variation in rainfall data. To partially solve this problem, qualitative information on farmers’ climate experience is collected. For this purpose, five questions regarding rainfall situation are included in the questionnaire following Abera et al. (2011). These questions include: Did the rainfall come on time? Was there enough rain on your fields at the beginning of the rainy seasons? Was there enough rain on your fields during the growing seasons? Did the rains stop on time on your fields? Did it rain during the harvest periods? A household was asked each of these questions. Then, value 1 is assigned if a household experience timely, regular and sufficient rainfall during ploughing, planting, crop growing and harvesting periods and 0 otherwise.
Finally, all responses were added up and divided by 5 to form subjective rainfall satisfaction index. The index value is specific to observed rainfall variability at each household’s farm where lower values indicate higher vulnerability to rainfall shock and higher values indicate good farm-level rainfall conditions. Though subjective, this seems to be an appealing measure of observed climatic condition because farmers have been doing farming for a generally long period and experienced real conditions of climate on their specific farms.
Besides, respondents were asked whether they have used different adaptation strategies to climate change and variability. For this reason, various strategies were identified and included in the questionnaire. These include crop diversification, varying planting and harvesting dates, diversifying from farm to non–farm activities, water and soil conservation, use of irrigation scheme, reforestation, and the use of modern varieties. The identification of these adaptation strategies is based on previous literature particularly Deressa et al. (2008), Hassan and Nhemachena (2008), Mary and Majule (2009), Seo (2010) and Di Falco et al. (2011 b and c).
Moreover, data on socioeconomic background of households, production inputs including the amount of labor and fertilizer used per hectare of land is collected. Total daily labor hour each household spent during ploughing, planting, weeding, harvesting and postharvest activities is also obtained.
3.2. Empirical Models Specification
Climate Adaptations Model: In this study, climate change adaptation strategies are modeled under the standard farm technology adoption framework. Representative risk-averse farm household face problem of choosing one
or more climate change adaptation strategies that maximize the expected utility from final yield given production function, climatic condition, land, labor and other constraints. Optimization solution would result in an optimal adaptation measures undertaken by the representative farm household. Hence, the household’s choice of climate change adaptation strategy is affected by a set of climatic as well as various socio-economic factors. That is:
ℎ
=
ℎ,
ℎ,
ℎ,
ℎ,
……… 1
Where, ℎ
=
ℎ adaptation strategy to climate change adopted by household h, ℎ = is a vector of h household’s characteristics including household size, household head’s gender, age and educational level, ℎ= vector of access to both formal and informal institutions such as access to formal government and informal farmer-to-farmer extension services, access to credit and local market for input and output, ℎ = vector of climatic variables and access to climate related information and ℎ = amount of fertilizer input used per hectare of cultivated landBesides, representative utility maximizing household is supposed to choose one climate change adaptation strategy over another if and only if the expected utility or gain in farm yield derived from one adaptation strategy is greater than the expected utility or gain in farm yield from the other. For instance, a rational farm household chooses soil and water conservation over changing planting and harvesting dates if and only if he/she expects more yield gain from adopting the former strategy than the latter.
Furthermore, in this study, it is assumed that household’s decision to adopt or not to adopt a given adaptation measure is made at household level but not at specific plot level. Moreover, different adaptation measures adopted by farm households are considered independent from one another. That means, household’s decision to use one strategy cannot be affected by a decision to use another strategy though she/he could use different strategies even on one plot. A dummy variable is designed to measure whether farm households had adopted each adaptation in any of their plots so as to cope with observed climate change and variability. Hence, each adaptation strategy is measured at household level and modeled independently. Finally, logistic regression model is used to investigate the factors affecting households’ decision regarding choice of adaptation strategies to climate change and variability as identified in equation 1 above.
Household Food Security Model: The second empirical model that is estimated is to analyze effects of socioeconomic variables, climate and adaptation strategies on household food security. Household’s multidimensional food security is modeled as a function of multiple socioeconomic and climatic factors. For this purpose, multidimensional food security index is used as a dependent variable.
In order to examine the effectiveness of climate adaptations in helping households ensure food security, four dominant strategies are selected. Dummy variables assuming value one if a household employs a given method and zero otherwise are created. These adaptation dummies are included in the food security model separately per se and not as a package. This is because household’s decisions regarding different adaptation strategies are assumed to be independent, as discussed in the preceding section. Separate inclusion of each adaptation in food security model is important to identify most effective strategy.
However, household’s decision to use climate adaptation strategies can be affected by unobserved individual heterogeneity such as farmers’ skills or ability to learn and adopt new technologies. In turn, unobserved heterogeneity would result in the endogeneity problem where some of the explanatory variables may be correlated with the error term of regression model. Therefore, the endogeneity of adaptation variables is checked before empirical analysis of food security model using Durbin-Wu-Hausman test. Test results show that adaptation decisions are endogenous.
Endogeneity of adaptation variables would result in biased and inconsistent estimation of food security model parameters. This can lead to the failure of measuring true effects of adaptation strategies. Therefore, controlling for endogeneity problem is an appropriate task to obtain consistent estimates. In this regard, using Two-Stage Least Squares (2SLS) estimation framework would help obtain robust estimates because it controls for endogeneity bias.
Consequently, 2SLS estimation framework is employed to estimate food security model. Following Kelejian (1971), Angrist (2001), and Angrist and Krueger (2001), predicted values of endogenous adaptation dummy variables are used as an instrument. In this case, it would be wrong to use predictions from nonlinear first-stage regression directly to second-stage estimation procedure. Rather, consistent estimate can be obtained by using linear first-stage regression regardless of the nature of outcome variable. This is because the consistency of second-stage estimates does not depend on the condition that the functional form for first-stage or reduced form equation is right (Kelejian, 1971). Angrist (2001) also argue that consistent estimator can be obtained by using nonlinear prediction of endogenous dummy variable given instruments and other exogenous variables, as an instrument. In this study, therefore, fitted values from a nonlinear logit model are used as an
instrument for an endogenous dummy variable. This approach of using predicted values as an instrument was employed in previous studies by Pender et al. (2004), Abera et al. (2011) and Di Falco et al. (2011c).
In this regard, some of the explanatory variables in the logit model such as access to formal government and informal farmer-to-farmer agricultural extension services, access to rural credit services, access to input and output market, fertilizer and access to climate information are used as instruments. Predictions were undertaken from the logit model including the excluded variables from the food security model.
The standard requirement for the instrumental variables’ appropriateness is that instruments should not be correlated with the error term in structural equation but instead be correlated with the endogenous variables. In this case, excluded instrument should not be correlated with farmers’ unobservable individual skills. Instead, they should be correlated with farmers’ decision concerning climate change adaptations. To test instrument relevance, F-test of overall significance of excluded instruments is used. Finally, a multivariate econometric model is specified as follows:
= , , , , , , , , ……… 5
Where; MFSI = Household’s multidimensional food security index calculated using four indicators representing four dimensions of household food security. H = Vector of household characteristics such as age, sex and education of household head, household size and dependency ratio, L = Total amount of labor hours spent per hectare of cultivated land. S = Size of the cultivated land held by household measured in hectares, LO = Dummy variable for household’s livestock ownership, I = Total amount of income earned by the household, SRI = Subjective observed rainfall satisfaction index used as a measure of rainfall variability. LARF = Long term average amount of village level annual rainfall. T = Household specific temperature variable proxied by altitude. Di = Dummy variables for each common adaptation strategies used by each farm household.
Before executing regression analyses, multicollinearity problem among the explanatory variables is checked using Variance Inflation Factor (VIF) for continuous variables and Contingency Coefficient (CC) for discrete variables. Results of VIF less than 10 and CC less than 0.75 imply no serious multicollinearity problem among the variables. Besides, the problem of heteroskedasticity is tested using standard Breusch-Pagan/Cook-Weisberg test for heteroskedasticity. Resulting P-value of 0.98 indicates that the null hypothesis of homoscedasticity among the explanatory variables included in both models cannot be rejected.
4. Climate Change and Farmers Adaptation in the Study Area
Rainfall trend analysis for the long period of 30 years indicates high variability with gentle decline in amount of annual rainfall in both stations available in Boricha District. In Darara clinic station, it starts declining since 1992 when a maximum amount of 2500.4 Millimeter was recorded. The trend of rainfall in Yirba Duwancho station shows relatively slight decline over the whole period and maximum amount of 1456.4 Millimeter was recorded in the year 1986.
Figure 1: Total annual rainfall trend in study area (1984 – 2013)
Source: Computed based on data obtained from National Meteorology Agency
Similarly, rainfall variability is also proven using farmer subjective observation regarding timeliness and amount of rainfall in the area. Responses indicate high rainfall variability and unpredictability during the
planting, crop growing, harvesting and post harvesting periods. As evidenced by Von Braun (1991) and African Development Bank (2010) for Ethiopia, and Muamba and Kraybill (2010) for Tanzania, the variability and unpredictability of rainfall have devastating effect on food production.
Though majority of the respondents report that rainfall is coming on time, about half of the respondents experience insufficient rainfall during the crop planting period (see Table 1). This is unfavorable condition for agricultural production that can reduce crop yield by affecting early stage of growth including seed germination. It also harms livestock production through affecting forages and grasses recovery, and growth immediately after the end of the dry season.
Table 1: Observed rainfall amount and regularity in study villages
On your farms Favorable Conditions
(Percentage)
Unfavorable Conditions (Percentage)
Rainfall coming on time Yes (on time) No ( too early + too late)
70.9 29.1 Enough rain at the beginning
of rainy seasons
Yes (enough) 50.3
No (too little + too much) 49.7 Enough rain during growing seasons Yes (enough)
45.3
No (too little + too much) 54.7
Rains stopping On time
39.8
Too early + too late 60.2
Rain during harvest periods No
47.3
Yes
52.7 Source: Computation based on survey data
Moreover, majority of the respondents have not been observing enough amount of rainfall during crop growing periods. 54.7 percent of sample households in Boricha district respond that rainfall during growing season is sometimes too little and/or too much. Neither of the two conditions is favorable. Besides, large majority of households respond that rains are not stopping on time at the end of rainy season. Too early or too late stopping of rainfall is not good for agriculture. Early stop leads to fewer crop yields and late stop damages the harvest. This unfavorable rainfall conditions have aggravated food insecurity problem leaving significant proportion of sampled farm households vulnerable to risks pertaining to weather variability and climatic change.
Sample farm households are also asked whether they adopted or not adaptation strategies in response to climate change and variability. Analysis of the responses reveals that about 91 percent of the respondents employed at least one adaptation strategy. The remaining 9 percent of sample households did not use any mechanisms at all in response to climate change and variability. Households who did not undertake any of adaptations options cited shortage of sufficient financial resources, lack of climate related information and shortage of land as main reasons for not adopting.
Table 2:Household’s Climate Adaptation Strategies in Study Area
Climate Change Adaptation Strategies Percentage of Farmers Adopted* Using modern varieties of farm inputs
Crop diversification
67
51
Varying planting and harvesting dates 44
Soil and water conservation mechanisms 22
Income diversification to non-farm income 12
Harvesting rain water Use of Irrigation
7 6 Note: * Significant number of households employ more than one adaptation strategies Source: Computation based on survey data
Main adaptation strategies used so as to reduce risks pertaining to climate are use of modern varieties, crop diversification, varying planting and harvesting dates, and soil and water conservation. Only few households adopt income diversification into non-farm sources, harvesting rain water and irrigation options (see Table 2).
5. Household Food Securityin the Study Area
To identify multidimensional food security status of the households, an index is constructed using four indicators conforming availability, access, utilization and stability dimensions of food security. The indicators used include availability of food stock in household, affordability of prevailing food price, access to pure drinking water and periodic shortfall of food items. Different weights are obtained using principal component analysis and attached to corresponding indicators owing to the facts that various factors can influence food security differently. Then, multidimensional food security index is calculated as sum of weighted deviations of each variable from its mean
values divided by that variable’s whole sample’s standard deviation.
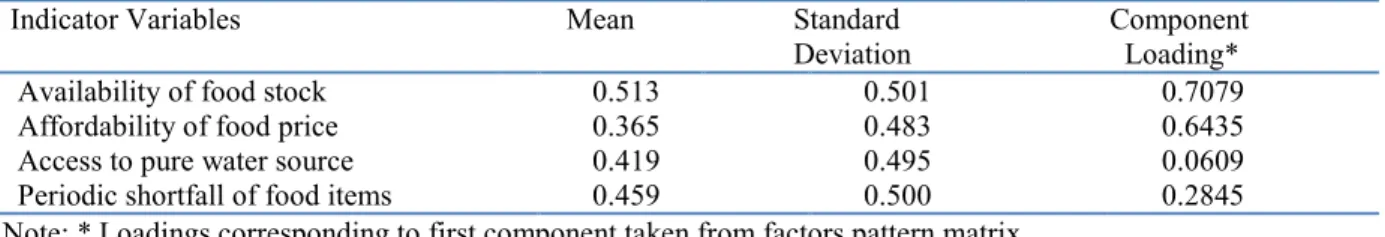
Principal component analysis results indicate that the first component explains relatively the largest variance in the data among the other components and hence it is taken as principal component. Moreover, all of the variables load well on the first component. That means all loadings in the first principal component exhibit positive signs (see Table 3). These results are fairly consistent with the prior expectations.
Table 3: Summary statistics of food security indicators and component loadings Indicator Variables Mean Standard
Deviation
Component Loading*
Availability of food stock 0.513 0.501 0.7079
Affordability of food price 0.365 0.483 0.6435
Access to pure water source 0.419 0.495 0.0609
Periodic shortfall of food items 0.459 0.500 0.2845
Note: * Loadings corresponding to first component taken from factors pattern matrix Source: Computation based on survey data
The implication of the result is that availability of food stock in household guarantees the households’ possibility of being food secure. This is confirmed by positive correlation of this variable with the index as anticipated. Food stock availability can be associated with the households’ capability to pay for the prevailing price of food items from the market. Households can purchase food from the market during a period of shortage and hence nonexistence of periodic shortage of food items from the household. It also implies higher probability of access to infrastructural services like water. Therefore, the first component is considered to be the main index of food security for the purpose of this study.
In order to test the validity of index in measuring relative food security position, correlation analysis is undertaken between the index and household income. This is because income is commonly used as one of the measures of household’s capability to acquire food and hence it can imply food security status. The result shows that the index is significantly and positively associated with the household income. Pearson correlation value of 0.5878 with between income and index value indicates the validity of constructed index, to some extent, in measuring multidimensional food security status of sample farm households.
Finally, food security status of the sample household is judged based on the multidimensional index value taking zero as decision point6. Households with positive index value are categorized as food secure
whereas those with negative value are considered as food insecure. Results show that there is considerable prevalence of food insecurity in the study villages. About 52.7 percent of the total sample households are found as food insecure while the remaining 47.3 percent are food secure. A study conducted on the coping strategies to food insecurity and hunger among households in the same selected district in Sidama zone of Southern Ethiopia found (54%) slightly larger percentage of food insecure households (Nigatu, 2011).
6. Results and Discussion
6.1. Determinants of Adaptations to Climate Change and Variability
Household’s decision to use climate change adaptations was hypothesized to be affected by household head characteristics, land size and fertilizer use, access to agricultural extension, market and credit service, information about climatic conditions, and climate factors. Marginal effects from logit model regression results are reported in Tables 4.
Explanatory variables included in the model are jointly significant at P < 0.0000, P < 0.0007, P < 0.0000 and P < 0.0002 with the Pseudo R2 of 0.322, 0.312, 0.392 and 0.394, respectively, indicating the
specification fits the data well (see Table 4). This implies that the hypotheses stating all coefficients except the intercept are equal to zero are rejected in all models. Therefore, it is possible to interpret the regression results meaningfully. Moreover, out of the total twelve explanatory variables, eleven have statistically significant influence on the probability of using one or other adaptation strategies. However, age of the household head is found to be insignificant in any of adaptation models.
6 The mean value of multidimensional food security index is 0.008 which is slightly different from zero. This can be
Table 4: Marginal Effects of Determinants of Adaptations: Logit Estimates Variables
Crop diversification
Varying planting and harvesting dates
Modern variety
Soil and water conservation Age -0.00248 (0.00373) -0.00196 (0.00343) -0.00346 (0.00281) -0.00192 (0.003) Gender -0.0553 (0.121) 0.0613 (0.114) 0.0643*** (0.0840) 0.110*** (0.0117) Head’s education 0.0626*** (0.0206) 0.0221* (0.0171) 0.0258* (0.0155) 0.00613** (0.0160) Household size -0.0322 (0.0307) 0.0175 (0.0282) -0.0133 (0.0245) 0.0283*** (0.00243) Land size 0.472*** (0.174) 0.285** (0.148) 0.0325 (0.128) 0.192* (0.116) Fertilizer 0.00122 (0.00172) 0.000146 (0.00165) 0.00799*** (0.00189) 0.000694 (0.00139) Access to agricultural extension
service 0.0273* (0.121) 0.0582* (0.109) 0.247*** (0.0922) 0.459*** (0.0922)
Access to credit service -0.115
(0.131) -0.231 (0.104) 0.0259*** (0.104) 0.0797 (0.121) Access to market 0.450*** (0.106) 0.269** (0.118) 0.00714*** (0.119) 0.00124 (0.034) Climate information 0.0685 (0.122) 0.0159*** (0.113) 0.0962 (0.0878) 0.0918 (0.0931) Subjective rainfall satisfaction index -0.372* *
(0.189) -0.255** (0.172) -0.117 (0.148) -0.203*** (0.142)
Average long-term rainfall 0.00119
(0.00088) -0.000761 (0.0018) -0.000220 (0.00068) 0.000654** (0.00071) Note: *, ** and *** indicate statistical significance at the probability levels of 10, 5 and 1 percent, respectively. Figures in the parentheses are standard errors
Source: Analysis based on survey data
Among household head characteristics, education has significant positive effect on all adaptation strategies. Positive significant effect of household head education on climate adaptation strategies is consistent with the findings of Deressa et al. (2008). Gender also has highly significant impact on the probability of using modern varieties and soil and water conservation strategies. Analysis of marginal effects indicated that male headed households are 6.4 percent more likely to use modern varieties and 11 percent more likely to implement soil and water conservation mechanisms than their female headed counterparts. This may be because male-headed households have more information than female-male-headed households. In addition, most female-male-headed households are formed after the death of husbands and divorce which may lead to the situation of fewer resources like labor.
Size of the household is also found to be significantly and positively correlated with the household’s probability to employ soil and water conservation mechanisms. This result is consistent with the finding of Di Falco et al. (2011c) who found positive and statistically significant coefficient for household size using probit model to analyze adaptation options in Nile basin of Ethiopia. Likewise, the size of cultivated land owned by sampled households has a positive and significant impact on crop diversification, changing planting and harvesting dates and conserving soil and water.
As expected, household’s access to both formal government and informal farmer-to-farmer extension services are found to have positive and statistically significant impact on the probability of employing all adaptation strategies. A study by Di Falco et al. (2011c) in the case of Nile Basin also found similar result of positive and significant impact of agricultural extension on farmers’ climate adaptation decisions. Access to credit services has positive and significant impact on using modern varieties. Marginal analysis of logistic regression model results presented in Table 4 indicate that farmers with access to credit services have 2.6 percent more probability to use modern varieties on their farms than those who do not have access to credit. This result is consistent with the predictions of economic theory and prior expectation. Having access to credit reduces financial constraints for farmers and enables them purchase modern varieties to be used as inputs for their farm production.
Household’s access to both input as well as output market have significant positive impact on crop diversification, changing planting and harvesting dates, and using modern variety. Farm households with access to market have 45 percent, 27 percent and 0.7 percent more likelihood of using crop diversification, changing planting and harvesting dates and modern variety than those who do not. These results are statistically significant
at 1 percent, 5 percent and 1 percent probability levels (see Table 4). Access to climate related information has positive and statistically significant effect on varying planting and harvesting dates. Farmers who have access to climatic information were found to have 1.6 percent more probability to vary planting and harvesting dates. These results are in line with the prior expectations and with the findings of previous studies by Deressa et al. (2008) and Di Falco et al. (2011c) for Ethiopia, and Hassan and Nhemachena (2008) for 11 African countries.
Moreover,the parameter estimates of climatic variables indicate that farmers use adaptation strategies in response to climate change and variability. Rainfall variability measured by farmers’ subjective rainfall satisfaction index was found to have negative and statistically significant impact on all adaptation strategies except for using modern varieties. Marginal analysis shows that farmers who observe favorable rainfall conditions have less probability of using adaptation strategies (see Table 4). This implies that farmers use adaptation strategies if they observe unfavorable rainfall conditions. If there is favorable rainfall condition, farmers production would be good and hence no motivation to adopt the options.
On the other hand, average long-term rainfall is found to be positively and significantly correlated with the use of soil and water conservation mechanisms only. The coefficients of crop diversification, varying planting and harvesting dates, and using modern varieties are statistically insignificant. This implies that sample farm households use adaptation strategies more in response to observed rainfall variability than changes in long-term average amount of rainfall.
6.2. Factors Affecting Household Food Security
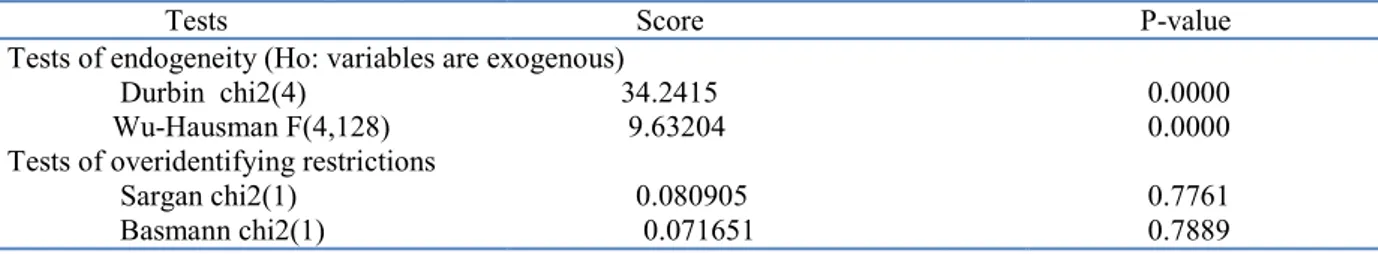
In this study, households’ food security is recognized as a multidimensional concept and modeled as a function of multiple socioeconomic and climatic factors. About twelve explanatory variables are included in the regression model as possible determinants of household’s food security. Before the estimation of model parameters, endogeneity of climate adaptation variables is tested using Durbin-Wu-Hausman test. The results show that we can reject the null hypothesis of exogenous adaptation decisions implying endogenous nature of adaptation variables.
Table 5: Results of Endogeneity and Over-identification Tests
Tests Score P-value Tests of endogeneity (Ho: variables are exogenous)
Durbin chi2(4) 34.2415 0.0000 Wu-Hausman F(4,128) 9.63204 0.0000 Tests of overidentifying restrictions
Sargan chi2(1) 0.080905 0.7761 Basmann chi2(1) 0.071651 0.7889 Source: Analysis based on survey data
In order to test the relevance of the chosen instruments, F-test of joint significance of variables included in first-stage regression is used. The value of F-test of excluded instruments is equal to 9.60 with P = 0.0000, 2.60 with P = 0.0019, 4.39 with P = 0.0000 and 4.52 P = 0.0000 under crop diversification, varying planting and harvesting dates, using modern varieties and soil and water conservation adoption scenarios. Hence, we can reject the null hypothesis of jointly zero coefficients of excluded instruments and confirm that the instruments are relevant.
Moreover, over-identification restriction is tested using Sargan - Hansen test of over-identifying restrictions. The result reveals that there is an over-identified equation in which the number of instruments exceeded the number of endogenous covariates (see Table 5). This implies that we cannot reject the null hypothesis that the excluded instruments are valid. Hence, the instrumental variables are uncorrelated with the error term indicating the validity of the instruments.
Table 6: 2SLS Estimation Results of Multidimensional Food Security Model Crop Varying planting Modern Soil and water
Diversification and harvesting dates variety conservation Dependent variable: Multidimensional household food security index
Explanatory variables Adaptation 0.238*** (0.257) -0.139 (0.324) 0.161*** (0.218) 0.130** (0.593) Altitude 0.00143 (0.00193) 0.00102* (0.00140) 0.00623 (0.00169) 0.00237* (0.00189) Rainfall variability 0.0166** (0.144) 0.0811* (0.152) 0.163 * (0.185) 0.185* (0.218) Long-term average rainfall -0.000525 (0.00101) -0.00872 (0.00102) -0.000105 (0.00112) -0.00163 (0.00137) Age -0.00266 (0.00266) -0.00595** (0.00248) -0.00749*** (0.00286) -0.00668** (0.00296) Gender 0.0282 (0.100) 0.0108 (0.0782) -0.0548 (0.0860) 0.111 (0.121) Head’s education 0.00351* (0.0173) 0.0307** (0.0148) 0.0442*** (0.0159) 0.0335* (0.0194) Household size -0.0447 * (0.0245) -0.0734*** (0.0184) -0.0740*** (0.0221) -0.104*** (0.0313) Dependence ratio -0.092 * (0.0696) -0.00502 (0.0604) -0.00610 (0.0636) 0.0619 (0.0734) Land size 0.748*** (0.146) 0.687*** (0.128) 0.670*** (0.153) 0.555*** (0.186)
Daily labor hour 0.146
(0.0149) 0.0380*** (0.0149) 0.0421*** (0.0147) 0.0344** (0.0164) Income 0.00484 (0.00551) 0.0926 * (0.00453) 0.0104* (0.00597) -0.0111 (0.0104) Livestock ownership 0.267*** (0.0905) 0.275*** (0.104) 0.274*** (0.0937) 0.238** (0.116) Constant 2.711 -2.265 0.282 -6.416 Number of Obs. 208 Wald chi2(13) 201.17 234.96 210.65 106.37 Prob. > chi2 0.0000 0.0000 0.0000 0.0000 R-squared 0.677 0.669 0.693 0.708
Note: *, ** and *** indicate statistical significance at the probability levels of 10, 5 and 1 percent, respectively. Figures in the parentheses are standard errors Source:Analysis based on survey data
Regression results indicated that all included explanatory variables are jointly significant in explaining food security condition of households at P < 0.000 with R2 fairly above 66 percent in all specifications (see
Table 6). Therefore, the coefficients obtained from Two-Stage Least Square regression analysis can be interpreted meaningfully. Results show that age and education of household head, household size, land size, labor, livestock ownership, climatic variables such as rainfall variability and temperature, and adaptation strategies are found to be significant determinants of multidimensional food security of households.
The parameter estimate for altitude which is a temperature proxy variable is positive and statistically significant under changing planting and harvesting dates, and soil and water conservation adaptation scenarios. From the negative relationship between altitude and temperature, and positive effect of altitude on food security, we can deduce that temperature has a negative impact on household food security. More specifically, one unit change in temperature can lead to 0.1 and 0.2 percent deterioration of household’s food security position under stated adaptation scenarios, respectively. This result is statistically significant at 10 percent probability level. Higher temperature can harm crop production. It also affects livestock production negatively because extreme temperatures lead to drying of grasses and water sources. This negative impact of temperature on food security is consistent with the findings of previous studies such as Muamba and Kraybill (2010) for Mt. Kilimanjaro areas in Tanzania, Deressa and Hassan (2009), and Di Falco et al. (2011c) for Blue Nile Basin in Ethiopia, which reported negative marginal impact of temperature on net farm revenue and crop production.
Rainfall variability in terms of time and amount during the beginning of rain season, crop growing and harvesting periods affect household food security significantly. Favorable rainfall condition has positive and statistically significant impact on food security. This implies that if rainfall is favorable in terms of coming time,
amount and distribution, households’ food security condition improves. Favorable rainfall condition in a production year significantly improves household’s food security position by 1.6 percent under crop diversification, 8 percent under varying planting and harvesting dates, 16.3 percent under modern varieties and 18.5 percent under soil and water conservation scenarios (see Table 6). Significant impact of rainfall variability on household food security is reasonable in Ethiopian agricultural setup where production is highly dependent of natural rainfall. Good rainfall condition implies good agricultural production and better food security.
Hence, there is significant evidence for the notion that climate variability is one of the critical causes of food insecurity of households in study area. This result is consistent with the finding of previous studies like Abera et al. (2011) in Ethiopia, and Molua (2002) in Southern Cameroon. Unlike the case of rainfall variability, the parameter estimates for long-term average rainfall is statistically insignificant under all adaptation scenarios. This indicates that rainfall variability is a more binding constraint for household food security than long-term average amount of rainfall.
Furthermore, results show that climate adaptations have positive impact on household food security. Households who adopt crop diversification, modern varieties, soil and water conservation strategies are found to be more food security position as compared with those who do not adopt the strategies (see Table 6). Diversifying crop and using modern varieties reduce climate vulnerability and increase farm production and productivity thereby helping households improve their food security status. Besides, soil and water conservation measures help mitigate soil erosion and conserve the little rain which both increases crop production that directly contribute to a better food security status of a household. Therefore, adaptation strategies such as crop diversification, modern varieties, and soil and water conservation strategies are effective in reducing risks pertaining to climate change and variability thereby helping households ensure food security.
Unexpectedly, however, the coefficient of varying planting and harvesting dates is found negative and statistically insignificant. This result contrasts with the study by Molua (2002) which found significant positive association between changing dates and farm income in Southern Cameroon. The implication of this result can be explained in the manner that sample households might not be changing dates exactly in line with actual climatic variations. This can be partly attributed to the lack of relevant and timely information on current as well as future forecasts of weather and climate.
Among the other variables, age of household age, household size and dependency ratio are found to have significant negative impact on household food security. As the age of household head increases, the food security position of a household deteriorates. This is perhaps because as the household head grows old, he/she might be less efficient to carry out demanding farming activities resulting in lower farm production and productivity. Households with large size and more dependent family members are also more food insecure. These households need more resources, beyond what they produce, to fulfill their food needs. Negative impact of household size on food security is consistent with the finding of Shiferaw et al. (2005) in Southern Ethiopia. However, it contrasts with the study by Abera et al. (2011) which found significant positive coefficient for household size in food security model. The differences in these results may be attributed partly to the differences in household composition. If the proportion of economically inactive members of the household increases, household food security position will deteriorate. This is because the marginal contribution of economically inactive household members in food production is less than their marginal consumption.
Level of education attained by household head was found to be positively related with household’s food security position. This is due to the fact that education can imply better farming skill and easier learning of new techniques. Besides, education can also reflect better farm management, decision making and adaptive capacity. A study by Deressa and Hassan (2009) also found similar positive and significant relationship between household head education and net farm revenue in the case of Nile basin in Ethiopia.
As expected, production inputs such as daily labor and size of cultivated land held by the household are found to have a positive and highly significant impact on household’s food security. The implication of this result is that the more the size of land held and the more the amount of labor working, the more the food production and the better the food security status of household.
Furthermore, in line with prior expectation, household wealth indicators such as non-livestock total income and livestock ownership have positive impact on household food security. There is strong evidence for the substantial effect of amount of livestock owned on household’s food security position. Put in other words, as the number of livestock owned increases, the likelihood of household’s food insecurity and vulnerability problem declines. Livestock are important capital assets in rural areas of Ethiopia serving multiple purposes. They are sources of food and income. They can also ensure food stability through serving as safeguard against shocks such as hardship periods like production shortfalls. Livestock can be easily sold and changed into cash thereby reduce problems of food availability through generating income. This result is consistent with the findings of Abera et al. (2011) which used panel data framework utilizing Ethiopian Rural Household Survey data set.
7. Conclusion and Policy Implications
This study examines implication of climate change, variability and adaptation strategies for household multidimensional food security in Southern Ethiopia. Farm households in study area observe climate change and variability, and adapt using different strategies. Empirical analysis indicates that household head’s gender and education, household size, land size, agricultural extension services, access to market, credit and climatic information are key factors affecting household’s decision regarding climate adaptations.
The study also found that there is substantial prevalence of food insecurity problem among the sample farm households. Results from Two-Stage Least Square estimation show that increases in temperature and rainfall variability have significant negative impact on household food security. Moreover, results reveal that adaptation measures like crop diversification, using modern varieties, and soil and water conservation have significant positive impact on household food security. This suggests that adaptation strategies are effective in ensuring household food security through reducing risks pertaining to climate change and variability. Besides, household head’s education, labor input, size of cultivated land, total non-livestock income and livestock ownership affect household food security positively. But, household characteristics such as age of head, household size and dependency ratio have significant negative impact on household food security.
Several policy implications can be suggested from this study. Though tone needs to be careful in making generalizations, the implications could be helpful in reducing climatic risks and ensuring food security in similar areas to the study sites. As rainfall variability is a critical constraint to household food security, risk reducing measures and programs would be helpful. In this regard, strengthening current government’s rural development strategies such as agricultural extension, adult education and introducing modern high yield and climate resilient crop and livestock varieties have paramount importance. Provision of relevant timely information on current as well as future climate forecasts, access to credit and market will enhance farmers’ climate adaptation decisions and help reduce food insecurity problem.
Furthermore, promoting soil and water conservation measures and crop diversification would also help reduce households’ vulnerability and enhance food security. Further micro-level research on food security addressing multiple dimensions, climate and adaptations within various agro-ecological settings would generate more insights into household welfare impacts. In view of that, efforts should also be devoted to address the problem of micro data on key climate variables.
References
Abera B., Alwin K., Manfred Z. 2011. Using Panel Data to Estimate the Effect of Rainfall Shocks on Smallholders’ Food Security and Vulnerability in RuralEthiopia. Climate Change, 108:185–206 AfDB (African Development Bank). 2010. Ethiopia’s Economic Growth Performance: Current Situation and
Challenges. The African Development Bank Group Chief Economist Complex, Economic Brief Vol. 1, Issue 5. 17 September
Angrist J. D. 2001. Estimation of Limited Dependent Variable Models with Dummy Endogenous Regressors: Simple Strategies for Empirical Practice. Journal of Business and Economic Statistics, 19(1): 2-16 Angrist J. D. and Krueger A. B. 2001. Instrumental Variables and the Search for Identification: From Supply and
Demand to Natural Experiments. Journal of Economic Perspectives, 15(4): 69-85
Deressa T. 2007. Measuring the Economic Impact of Climate Change on Ethiopian Agriculture: Ricardian Approach. World Bank Policy Research Paper No. 4342. Washington D.C
Deressa T. and Hassan R. 2009. Economic Impact of Climate Change on Crop Production in Ethiopia: Evidence from Cross-section Measures. Journal of African Economies18 4:529–554
Deressa T., Hassen R., Alemu T., Yesuf M., and Ringler C. 2008. Analyzing the Determinants of Farmers’ Choice of Adaptation Measures and Perceptions of Climate Change in the Nile Basin of Ethiopia. International Food Policy Research Institute (IFPRI) Discussion Paper No. 00798, Washington DC Deressa T., Hassan R. and Poonyth D. 2005. Measuring the Impact of Climate Change on South African
Agriculture: The Case of Sugarcane Growing Regions.Agrekon Vol. 44, No 4
Di Falco S., Veronesi M., and Yesuf M. 2011a. Does Adaptation to Climate Change Provide Food Security? A Micro-perspective from Ethiopia. American Journal of Agricultural Economics, Advance Access published March 7
Di Falco S., Yesuf M., Kohlin G. and Ringler C. 2011 b. Estimating the Impact of Climate Change on Agriculture in Low-Income Countries: Household Level Evidence from the Nile Basin, Ethiopia. Environ Resource Econ 52:457–478
Di Falco S., Yesuf M, and Kohlin G. 2011c. What Adaptation to Climate Change? Evidence Climate Change in Low-Income Countries. Ethiopian Development Research Institute and International Food Policy Research Institute, Washington, DC
FAO (Food and Agriculture Organization). 2008. Climate Change and Food Security: A Framework Document. Food and Agriculture Organization of the United Nations. Rome, Italy
FAO (Food and Agriculture Organization). 2013. Food Security Indicators. Food and Agriculture Organization of the United Nations. Rome, Italy
FAO (Food and Agriculture Organization). 1996. Rome Declaration on World Food Security. World Food Summit. 13–17 Nov. 1996, Rome, Italy
Hassan R. and Nhemachena C. 2008. Determinants of African Farmers’ Strategies forAdapting to Climate Change: Multinomial Choice Analysis. Centre for Environmental Economics and Policy in Africa (CEEPA), University of Pretoria. African Journal of Agricultural and Resource Economics Vol. 2 No 1 Kelejian H. H. 1971. Two-Stage Least Squares and Econometric Systems Linear in Parameters but Nonlinear in the Endogenous Variables. Journal of the American Statistical Association Vol. 66, No. 334: pp. 373-374
Krishna P. P. 2011. Economics of Climate Change for Smallholder Farmers in Nepal: A review. The Journal of Agriculture and Environment Vol. 12
Mary A. L. and Majule A. E. 2009. Impacts of Climate Change, Variability and Adaptation Strategies on Agriculture in Semi-arid Areas of Tanzania: The Case of Manyoni District in Singida Region, Tanzania. African Journal of Environmental Science and Technology Vol. 3 (8), pp. 206-218, August Mendelsohn R., Dinar A., Basist A., Kurukulasuriya P., Ajwad M., Kogan F., Williams C. 2004. Cross-sectional
Analyses of Climate Change Impacts. World Bank Policy Research Working Paper 3350. Public Disclosure Authorized
Muamba F. and Kraybill D. 2010. Weather Vulnerability, Climate Change, and Food Security in Mt. Kilimanjaro. Poster prepared for presentation at the Agricultural & Applied Economics Association 2010 AAEA, CAES, & WAEA Joint Annual Meeting. Denver, Colorado, July 25-27, 2010.
Molua E. 2002. Climate Variability, Vulnerability and Effectiveness of Farm-Level Adaptation Options: The Challenges and Implications for Food Security in Southwestern Cameroon. Environment and Development Economics, 7: 529–545
Nigatu R. 2011. Smallholder Farmers’ Coping Strategies to Household FoodInsecurity and Hunger in Southern Ethiopia. Ethiopian Journal of Environmental Studies and Management, Vol. 4 No.1 2011
Orindi V., Ochieng A., Otiende B., Bhadwal S., Anantram K., Nair S., Kumar V. and Kelkar U. 2006. Mapping Climate Vulnerability and Poverty in Africa. In: Thornton PK, Jones PG, Owiyo T, Kruska RL, Herrero M, Kristjanson P, Notenbaert A, Bekele N, Omolo A (eds) Climate change and poverty in Africa. Report to the Department for International Development, ILRI, Nairobi
Pender J., Nkonya E., Jagger P., Sserunkuumab D., Ssali H. 2004. Strategies to Increase Agricultural Productivity and Reduce Land Degradation: Evidence from Uganda. Agric Econ 31: 181-195.
Shiferaw T., Richard L., Christina H. 2005. Determinants of Food Security in Southern Ethiopia at the Household Level. Agricultural Economics 33: 351–363.
Seo S. N. 2010. A Micro-econometric Analysis of Adapting Portfolios to Climate Change: Adoption of Agricultural Systems in Latin America. Applied Economic Perspectives and Policy, (2010) volume 32, number 3, pp. 489–514.
Stige L, Stave J and Chan K .2006. The Effect of Climate Variation on Agro-pastoral Production in Africa. Proc Natl Acad Sci 103:3049–3053
Von Braun J. 1991. A Policy Agenda for Famine Prevention in Africa. International Food Policy Research Institute (IFPRI) - Food Policy Statement #13.
Yesuf M., Di Falco S., Deressa T., Ringler C. and Kohlin G. 2008. The Impact of Climate Change and Adaptation on Food Production in Low-Income Countries: Evidence from the Nile Basin, Ethiopia. IFPRI Discussion Paper 00828.