COMPUTER MODELLING & NEW TECHNOLOGIES 2014 18(11) 945-950 Tian Jiale
Collaborative mechanism of project management
based on complex system theory
Jiale Tian
*School of Civil Engineering and Architecture, Wuhan University of Technology, Hubei, 430070, China Received 1 March 2014, www.cmnt.lv
Abstract
Although it is arguable that humans have been studying complex systems for thousands of years, the modern scientific study of complex systems is relatively young in comparison to conventional fields of science with simple system assumptions, such as physics and chemistry. The history of the scientific study of these systems follows several different research trends. The project management community is actively demonstrating substantial interest in the development of viable methods to assess and improve project management maturity. There is little empirical evidence on the benefits of deploying a project management office (PMO) and/or conducting project reviews. The increasing complexity of exploratory activities in pharmaceutical innovation makes less likely that a project can stand alone. Project managers not only resort to in-house innovation but also external sources to propel a central project. This paper introduces the notion of a quality function for individual tasks and uses the functional form of the bivariate normal, to model quality at the task level. Using real data from two case studies, a translation agency and a software development company, the quality function is specified and incorporated into a mathematical programming model that allows quality to be explicitly considered in project planning and scheduling. An alternative model formulation leads to the creation of quality level curves that enable managers to evaluate the nonlinear tradeoffs between quality, time, and cost for each of the example projects. The results of these analyses lead to specific decisions about the planned values for these three fundamental dimensions at the task level and provide insights for project planning and scheduling that can be gained through improved understanding of the choices and tradeoffs. Keywords: project management, project planning, project scheduling, quality management
*Corresponding author’s e-mail: [email protected]
1 Introduction
A complex system is a damped, driven system (for example, a harmonic oscillator) whose total energy exceeds the threshold for it to perform according to classical mechanics but does not reach the threshold for the system to exhibit properties according to chaos theory. We have witnessed a dramatic and steady increase in the extent to which the modern enterprise adopts and relies upon project manage-ment to secure a competitive advantage. As project mana-gement becomes the dominant way that work is accom-plished, organizations strive to become good at delivering projects successfully. The predictable consequence is widespread commitment to improvement initiatives that may include the establishment of an enterprise project manage-ment process, the developmanage-ment of a career path for project managers, the implementation of project management education and training programs, and investment in project management tools and information systems. But the modern enterprise cannot afford to improve recklessly or randomly. The modern enterprise must approach improvement pur-posefully. Committing an organization to a significant improvement effort requires a thorough understanding of where the organization is and, perhaps more importantly, where the organization needs to grow. This is the need that is addressed by the recent interest and attention devoted to the development of project management maturity models.
It is widely agreed that the choice of management structures used to implement innovative, temporary, cross-functional and complex project endeavours has important implications for project success. The discu-ssion of alternative project management structures dates back to Galbraith’s conceptual introduction of the matrix organization and its differentiation from functional and product organizations. He systematically compared the advantages and dis-advantages of alternative matrix orga-nization structures. Based on Galbraith’s typology some authors favoured matrix project organization structures for their flexibility, their economical use of resources, and the clear differentiation between project authority and functional authority. Others criticized matrix project organization structures due to their complexity and lack of unity of command. On balance, these conceptual dis-cussions lack agreement, thus providing little conclusive theoretical direction concerning the relationship of spe-cific project structures to project success. These concep-tual disagreements are also reflected in the empirical research. With the exception of and empirical studies have not generally revealed significant associations bet-ween project organization types and project success. However, an alternative stream of empirical research suggests the importance of project management structures for project success. Several studies concordantly identi-fied significant and strong associations between project
COMPUTER MODELLING & NEW TECHNOLOGIES 2014 18(11) 945-950 Tian Jiale
managers’ (PM’s) decision authority and project success. The differences between these two empirical research streams accentuate the inconclusive discussion of project management structures and their association with project success.
Project management addresses cost, schedule, and performance targets while providing an outcome that satisfies the client. A measure of the value of the project to the client is the level of quality associated with the completed project. It follows then that important mana-gerial decisions relate to the level of quality achieved for each of the project’s tasks, since the quality of the tasks defines the quality of the project. The emphasis in project planning and scheduling has been on managing the rela-tionship between time and cost, with an implicit assump-tion of a fixed level of quality that is seldom explicitly examined. However, in many situations there are alter-native approaches for completing each task, each having its own time, cost, and quality considerations. Differences in quality can arise due to bids offered by competing subcontractors to complete specific tasks. Even different bids by the same subcontractor could imply different qua-lity levels. For example, subcontractors might have some flexibility with time and cost that would result in diffe-rent quality levels for the same task. This can also be true for alternative work plans offered in-house. For example, in completing a foundation for a building there are choi-ces related to the depth of the excavation and the compre-ssive strength of the concrete used. Each of the possible alternatives will achieve different levels of time, cost, and quality associated with this task.
A complex system is a damped, driven system (for example, a harmonic oscillator) whose total energy exceeds the threshold for it to perform according to classical mechanics but does not reach the threshold for the system to exhibit properties according to chaos theory. Although it is arguable that humans have been studying complex sys-tems for thousands of years, the modern scientific study of complex systems is relatively young in comparison to conventional fields of science with simple system assump-tions, such as physics and chemistry. The history of the scientific study of these systems follows several different research trends.
This paper introduces the notion of a quality function for individual tasks and uses the functional form of the bivariate normal, to model quality at the task level. Using real data from two case studies, a translation agency and a software development company, the quality function is specified and incorporated into a mathematical program-ming model that allows quality to be explicitly conside-red in project planning and scheduling. An alternative model formulation leads to the creation of quality level curves that enable managers to evaluate the nonlinear tradeoffs between quality, time, and cost for each of the example projects. The results of these analyses lead to specific decisions about the planned values for these three fundamental dimensions at the task level and provide insights for project planning and scheduling that can be gained through improved understanding of the choices and tradeoffs.
2 Related works
In the field of project management, “Quality management has equal priority with cost and schedule management” [1]. This statement makes inherent sense, since project management is concerned with not only managing cost and schedule, but also the actual work completed in order to achieve the project goal. The quality of the work completed then is an important project outcome, since it directly relates to the value of the project deliverables. The Project Management Body of Knowledge (PM-BOK) [2] has adopted the ISO 9000, clause 3.11 defi-nition of quality as “the degree to which a set of inherent characteristics fulfils requirements” [3]. Quality issues must be addressed in both the management of the project and the product of the project [2]. Specifically, the PMBOK suggests that quality must be addressed throughout the project life cycle, beginning in the project planning phase and continuing through quality assurance and quality control [2]. Unfortunately, no guidance is provided in terms of how quality can be measured in a project con-text. The construction industry has been concerned about quality for a long period of time and has conducted research to address this issue. A study by the Quality Performance Measurements Task Force of the Construc-tion Industry Institute resulted in the quality measurement matrix [4] and led to the development of an approach to measure quality performance of engineer-procure-con-struct (EPC) projects [5]. The measures were tied to four total quality management components: customer focus, leadership, delivery, and employee empowerment. Under delivery, for example, the subcategories include cost, time, safety/health/environment, and product deliverab-les. The focus of this approach is on identifying and then tracking critical quality measures for each project phase. A project quality performance model based on empirical study of project control variables was developed for Hong Kong construction projects [6]. These variables are grouped under the headings of client, project, project environment, project team leader, project management action, and project procedure. The literature on quality issues and problems in the construction industry is sum-marized in [7].
Several authors have attempted to develop methods to measure project quality. Paquin et al.[8] assess project quality by decomposing client satisfaction into a hierar-chical structure of quality dimensions that are measured and aggregated using a multi-criterion approach such as the analytical hierarchy process (AHP) [9] or multi-attri-bute utility theory [10]. A limitation of the multi-criterion approach for quality measurement is the necessity of identifying and evaluating a possibly unique set of quality dimensions for each task. Pollack-Johnson and Liberatore [11] illustrate how the quality of a task option can be determined using the AHP. They extend the discrete time–cost problem by developing a mathematical progra-mming model that determines optimal discrete options defined in terms of time, cost, and quality combinations for specific tasks to maximize overall project quality, whether determined by AHP or by some other method, subject to time, and cost constraints. Icmeli-Tukel and
COMPUTER MODELLING & NEW TECHNOLOGIES 2014 18(11) 945-950 Tian Jiale
Rom [12] present two models that integrate quality considerations into resource constrained project sche-duling. In their study, quality is measured by the amount of time and money spent on reworking activities that do not satisfy specifications. Several methods of integrating rework times and costs into the models are proposed. An alternative approach for measuring quality at the task level is to make a direct subjective assessment of quality [13,14].
3 Method
3.1 THE MODEL
This research was conducted using the PM Solutions Project Management Maturity Model. The PM Solutions model was developed by a team of highly experienced project managers and has been used successfully to conduct maturity assessments in several organizations. This model adopts a two-dimensional (2-D) framework.
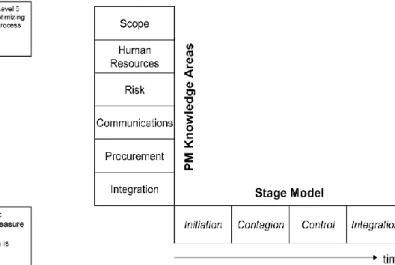
Both of the dimensions are based on accepted industry standards. The first dimension reflects the level of maturity. It is based on the structure of the SEI Capability Maturity Model. The SEI model has received widespread acceptance as a standard for process modeling and asses-sment of organizational maturity in several process areas. Additionally, research evidence from several studies including case studies and survey research have demon-strated important organizational performance impro-vements are associated with improved process maturity. The second dimension depicts the key areas of project management addressed. This dimension adopts the struc-ture of the PMI’s nine knowledge areas. Each of the nine knowledge areas were further decomposed into key components that pro-vide for a more rigorous and spe-cific determination of project management maturity based on specific capabilities. There were a total of 42 com-ponents included in this study, which is shown in Figures 1 and 2.
FIGURE 1 PM solutions project management maturity model FIGURE 2 Project management knowledge areas and stage model
3.2 THE FORMULATION
In this study, we establish a triple-stage stochastic deci-sion process, which illustrates a typical pharmaceutical R&D project in which the committee periodically reviews a project and decides whether to continue with in-house research or buy existing technology from outside.
a) Once the R&D project is initiated, it has two process lines: the monitoring process and the stochastic innovation process. The monitoring process is periodically scheduled (e.g., twice a year), whereas the innovation process is a random time duration.
b) The focal R&D project has a fixed total time span stipulated by the monitoring process, meaning, practically, that the project is not allowed to last forever.
c) The R&D project’s innovation process can be divided into three phases as mentioned
previously: the toxicity phase; the efficacy phase; and the clinical test phase. The duration of each phase is random.
d) Scientists develop a lead compound by exploring molecules (e.g., via HTS) and optimize the compound by adding more molecules to its basic structure or replacing old molecules with new ones. Scientists face uncertainties in the sense that their in-house developed compound may fail or their in-house research lasts too long and thus they run out of time without having a positive result.
e) The R&D project can buy existing molecular entities or novel entry technology developed by external sources as substitutes and combines them with its own in-house compound.
f) The committee decides at scheduled monitoring times whether to buy substitute molecular entities or continue a drug’s in-house development. However, by using externally
COMPUTER MODELLING & NEW TECHNOLOGIES 2014 18(11) 945-950 Tian Jiale
procured molecules, we assume that the probability of producing a successful lead compound ultimately decreases. This condition reflects Pisano’s argument that bought-in molecular entities may increase development uncertainty and thus reduce the probability of success. It also reflects the make-or-buy dilemma the committee has to face in science-based pharmaceutical R&D.
g) By “project success,” we mean that the compound turns out to have positive effect within the project’s allotted total time. By “failure,” we mean that the compound either turns out to have negative effect or the research runs out of time. The following details our model’s formulation.
3.3 THE DEVELOPMENT
Our overall goal is to find a rich method for modeling the relationship between quality, time, and cost at the indi-vidual task level within a project, as well as at the overall project level. Our approach begins by formulating a model of the quality of each task as a function of the time and cost allocated to it. We assume that there is an entity (an individual or group within an organization, a subcon-tractor, etc.) that could complete a given task with diffe-rent allocations of time and cost. We further assume that there is a quality function that assigns to each combi-nation of time and cost a corresponding quality value. We limit time and cost c to reasonable values for the task at hand and assume that, within that domain, the quality function for a task has two basic properties.
1) Holding time constant, quality q is an increasing func-tion of cost. Thus, if time is fixed, we assume that allo-cating more money to the task will increase quality. 2) Holding cost constant, quality is an increasing
func-tion of time. Thus, if cost is fixed, we assume that allocating more time to the task will increase quality.
If we normalize quality to be on a 0–100 scale, based on the two non-decreasing assumptions earlier, we would expect the graph to show quality being lowest at the corner of the domain with the smallest values of time and cost and highest in the opposite corner (the highest values of time and cost). For a fixed quality, we would expect a standard time/cost trade off curve that is decreasing and convex. Thus, to maintain the same level of quality, to reduce the time, one has to pay increasingly more money per unit, such as in standard project activity crashing. This suggests a basic hill shape rising out of a plain, although we would only be interested in a one-quarter wedge of the hill.
3.4 THE MEASUREMENT
The questionnaires used in this study include 199 single items and some quantitative measures of project-specific characteristics. Out of these, 67 items were directly taken from questionnaire, with permission of the author. The
remaining items were developed for the purposes of this study. Each item was assessed on seven-point rating scales with a range from strongly agree” to “strongly disagree.” The original questionnaire was developed in the German language and the adopted Pinto’s items were translated from German to English. Inorder to collect data on the U.S. projects the German questionnaire was trans-lated into English. To demonstrate consistency and accu-racy in translations the documents were back-translated using two experts who discussed the translations and together corrected any inconsistencies. Prior to final data collection in the U.S. the instrument was tested in a pilot of 20 projects.
Following our conceptual discussion we use a set of five variables measuring project management structure attributes and four variables measuring project success. All constructs consisting of multiple items were tested for composite validity using Cronbach’s alpha and factor analysis. Some of the initial scales had to be modified to achieve satisfactory composite validity.
1) Project Management Structure Variables: The scales used to measure the project management structure attributes could be portrayed as follows. The PM project authority scale describes the level of authority delegated to the PM and covers different important decisions typically made or influenced by PMs. The PM functional responsibilities scale measures the position of the PM within the functional organization. The PM personnel authority scale measures whether the PM had the authority to reward project team members. The PM project responsibility scale is used to differentiate the project responsibility of the PM from the project responsibility of other constituents within the organization. The project influence of steering committees was measured by the level of top management involvement in project decisions. 2) Unidimensional Project Management Structure Scale:
We used the scale developed by Larson and Gobeli. This scale is a blend of the scales suggested by Might and Fischer and Murphyet al. It differentiates between five project management structure types and describes the spectrum from a functional organization to a pure project organization.
3) Project Success Variables: Pinto and Mantel identi-fied three distinct aspects of project performance: 1) the implementation process; 2) the perceived value of the project; and client satisfaction with the delivered project outcome. Shenhar et al. have suggested four different criteria to assess project success: 1) meeting design goals; 2) benefits to customers; 3) commercial success; and 4) future potential. In this study, we use four different project success measures: efficiency, effectiveness, customer satisfaction, and business results.
4 Analysis
The results of this study complement previously publi-shed results concerning overall project management maturity in which a clear majority of respondents
indi-COMPUTER MODELLING & NEW TECHNOLOGIES 2014 18(11) 945-950 Tian Jiale
cated that their organizations are relatively immature in terms of the project management maturity model. In the referenced study, nearly 67% of respondents indicated their organizations were operating at level 1 – initial processes (13.7%) or at level 2 – structured process and standards (53.2%). While a notable portion of respon-dents rated their organizations had reached level 3 – organizational standards and institutionalized process (19.4%), a mere 7.3% indicated their organizations were operating at level 4 – managed process and only 6.5% assessed their organizations to have achieved level 5 – optimizing process.
This instant research reveals very comparable results at the more detailed component level. Reviewing the results across all component areas, the median project management maturity level was level 2 out of 5 in 36 of the 42 areas. In fact, there was only one component area in which the median level of project management matu-rity was above level 2. In the change control component of the project integration management knowledge area, the median project management maturity was level 3. It is also instructive to note that reported practices in the pro-ject risk management knowledge area are the least mature of all knowledge areas. In fact, this area accounts for four of the five cases where the median level of project mana-gement maturity is level 1. In particular, the respondents indicated level 1 practice with respect to risk quantifi-cation, risk response development, risk control, and risk documentation. Risk management practices appear to deserve the attention of those charged with leading their organizations toward improved project management maturity.
The most significant difference between industries identified in this study occurs with respect to the schedule development component area. The median maturity reported by respondents in the professional services industry was level 3. This value is above the median results reported for the information and finance industries (level 2) and well above the median maturity level repor-ted by those respondents engaged in the manufacturing industry (level 1). These results indicate that in the profe-ssional services industry, a majority of the organizations that participated in this study have adopted the practices that characterize level 3 maturity in schedule develop-ment. These practices include the definition of the project schedule at the appropriate level of detail, in line with the project scope and work breakdown structure. Additio-nally, the project schedules are established as baselines that are managed. Finally, the use of project management scheduling tools is standard across all projects. In the remaining three industries, a preponderance of respondent organizations are currently operating at level 2 or below. At level 2, schedule development is based on a repeatable process that relies on expert knowledge, access to industry methods, and access to commercial databases. Project teams develop staffing plans to support the project schedule and work with management to secure the resources required.
Finally, at level 2, project management software tools are standard for large, visible projects. We should also
note that over 70% of respondents in the manufacturing industry indicated their organizations were operating at level 1 maturity. At level 1, scheduling occurs in an ad hoc fashion. The organizations lack a formal process for developing project schedules. The results for cost resource planning reveal that once again the respondents in the professional services industry report the highest level of project management maturity with over 38% reporting at level 3 or higher, and the respondents from the manufacturing industry report the lowest level of project management maturity with over 70% reporting practices at level 1. Among industries, project mana-gement maturity levels reported for cost resource plan-ning are less than those reported for schedule deve-lopment. In the case of professional services and finance and insurance companies, the majority of respondents report practices consistent with level 2 or above. These organizations are identifying resource requirements for all labour categories, equipment, and material. They are also employing planning processes that develop and document the resources required, as well as the methods for determining resource requirements. The planning pro-cess in level 2 organizations is supported by management and is gaining acceptance through the organization. In the manufacturing and information industries, level 1 practice is considerably more prevalent. The respondents indi-cated that project managers in their organizations employ methods to identify resources that vary from one project to the next. At times, the functional support areas are overlooked. Most indicated the cost resource planning process was undocumented.
5 Conclusions
The value of the project to the client can be measured in part by the level of quality associated with the completed project. Quality is acknowledged to be an important com-ponent of project management, but previously has recei-ved limited consideration in planning and scheduling. The implicit assumption behind standard time/cost tradeoffs is that some unspecified level of quality is main-tained for each task. However, in many situations project managers must evaluate alternative options for accom-plishing project activities, and these involve differing levels of time, cost, and quality. In such situations, it makes sense to analyze the relationship between cost, time, and quality, and decide on their levels for each project task that best achieves the project’s objectives. We have introduced the concept of a quality function that represents the relationships between quality, time, and cost for each task. Using two case studies with real data, a translation agency and a software development company, the quality function is specified for each task and incor-porated into a nonlinear programming model that allows quality to be explicitly considered in project planning and scheduling. An alternative formulation minimizes cost with bounds on project quality and completion time and leads to the creation of quality level curves. Both for-mulations can be very useful tools in making final project planning and scheduling decisions that explicitly model and incorporate quality.
COMPUTER MODELLING & NEW TECHNOLOGIES 2014 18(11) 945-950 Tian Jiale
References
[1] Kerzner H 2003 Project Management: A Systems Approach to Planning, Scheduling and Controlling 8th ed New York Wiley [2] Project Management Institute A Guide to the Project Management
Body of Knowledge 3rd ed Newtown Square PA Project Management Institute 2004
[3] International Organization for Standards ISO 9000:2000 2000. [4] Stevens J, Glagota C, Ledbetter W 1994 Quality-measurement
matrix Manage Eng10(6) 30-35
[5] Stevens J 1996 Blueprint for measuring project quality Manage Eng12(2) 34-9
[6] Chan A 2001 A quest for better construction quality in Hong Kong CIOBConstruction Informat Quarterly3(2) 1200-13
[7] Heravitorbati A, Coffey V, Trigunarsyah B 2011 Assessment of requirements for establishment of a framework to enhance implementation of quality practices in building projects Int J Innov Manage Technol2(6) 465-70
[8] Paquin J P, Couillard J, Ferrand D J 2000 IEEE Trans Eng Manage
47(10) 88-97
[9] Saaty T L 1996 The Analytic Hierarchy Process Pittsburgh RWS Publications
[10]Keeney R, Raiffa H 1976 Decision with Multiple Objectives: Preferences and Value Tradeoffs New York Wiley
[11]Pollack-Johnson B, Liberatore M 2006 IEEE Trans Eng Manage
53(4) 534-42
[12]Icmeli-Tukel O, Rom W O 1997 Ensuring quality in resource constrained project scheduling Eur J Operational Res103(3) 483-96 [13]Babu A J G, Suresh N 1996 Project management with time cost and
quality considerations Eur J Operational Res88(2) 320-7
[14]Khang D B, Myint Y M 1999 Time cost and quality trade-off in project management A case study Int J Project Manage17(4) 249-56
[15]Morgan LO, Morgan R M, Moore W 2001 Quality and time-to-market tradeoffs when there are multiple product generations Manuf. Serv. Oper.Manage3(2) 89-104
[16]Brucker P, Drexl A, Mohring R, Neumann K, Pesch E 1999 Resource-constrained project scheduling Notation, classification, models, and methods Eur J Operational Res112(1) 3-41
[17]Interagency Language Roundtable (16 Sep 2011) ILR skill level descriptions for translation performances [Online] Available http://www.govtilr.org/Skills/AdoptedILRTranslationGuidelines.htm [18]American Translators Association, ATA Certification Program
Rubric for Grading, Version 2009 Available from the American Translators Association Alexandria VA
[19]Lindo Systems Inc Extended Lingo/Win 32 Version 13.0 Chicago 2011
Author
Jiale Tian, born in May 1981, Yiyang, Hunan Province, China.
Current position, grades: senior engineer, PhD candidate in School of Civil Engineering and Architecture, Wuhan University of Technology, China.
University studies: project management.
Scientific interest: project management and information management.