Required Minimum Shareholders' Fund and Bank
Performance: A Substantiation from the Nigerian
Banking Sector
Echekoba, Felix Nwaolisa; Adigwe, Patrick Kanayo; Ananwude,
Amalachukwu Chijindu; Osigwe, Promise Arinze
Veröffentlichungsversion / Published Version Zeitschriftenartikel / journal article
Empfohlene Zitierung / Suggested Citation:
Echekoba, F. N., Adigwe, P. K., Ananwude, A. C., & Osigwe, P. A. (2017). Required Minimum Shareholders' Fund and Bank Performance: A Substantiation from the Nigerian Banking Sector. European Academic Research, 5(3), 1642-1679. https://nbn-resolving.org/urn:nbn:de:0168-ssoar-54868-7
Nutzungsbedingungen:
Dieser Text wird unter einer CC BY Lizenz (Namensnennung) zur Verfügung gestellt. Nähere Auskünfte zu den CC-Lizenzen finden Sie hier:
https://creativecommons.org/licenses/by/4.0/deed.de
Terms of use:
This document is made available under a CC BY Licence (Attribution). For more Information see:
Required Minimum Shareholders’ Fund and Bank
Performance: A Substantiation from the Nigerian
Banking Sector
FELIX NWAOLISA ECHEKOBA
Department of Banking and Finance, Nnamdi Azikiwe University Awka, Anambra State, Nigeria
Dr. PATRICK KANAYO ADIGWE
Department of Banking and Finance, Nnamdi Azikiwe University Awka, Anambra State, Nigeria
AMALACHUKWU CHIJINDU ANANWUDE1
Department of Banking and Finance, Nnamdi Azikiwe University Awka, Anambra State, Nigeria
PROMISE ARINZE OSIGWE
Department of Banking and Finance, Nnamdi Azikiwe University Awka, Anambra State, Nigeria
Abstract:
The performance of the banking sector is very critical for the survival of the financial system, especially in a developing country like Nigeria where productive economic activities rely more on the banking system compared to the stock market for finance. In this regard, the effect of required minimum shareholders’ fund on banks’ performance in Nigeria was ascertained over a period of seventeen years, that is, from 1999 to 2015 by distinctively assessing the effect of minimum capital requirement on profit before tax and net interest income of the banking sector. Controlling banks’ specific factors: total assets plus off balance sheet engagements and ratio of non-performing loans to total credit proficient to debilitating performance, the Johansen co-integration depicts that minimum capital requirement and banking sector performance are co-integrated. The short run relationship between minimum capital requirement and profit before tax was
negative and statistically insignificant while net interest income and minimum capital requirement was positive and significantly correlated. The result also reveals that minimum capital requirement has no significant effect on profit before tax but significantly affects the net interest income of the Nigerian banking sector. The findings of this study show that, for the period reviewed, banking reform has significant effect on financial performance reflected by net interest income but such is not the case for profit before tax of the banking sector. This portrays that increases in indexes of banking reforms has the potential on improving banking sector performance which ultimately results in economic growth and development. There is need for banks’ to improve their assets quality and off balance sheet engagements by advancing loans to productive sectors of the economy rather than seeing oil and gas sector as the only fertile and profitable sector for large loans and advances. Banks’ management should try as much as possible to reducing the ratio of non-performing loan to total credit as this negatively affects performance and increases credit risk associated bad debts.
Key words: Minimum capital; profit before tax; net interest income.
1. INTRODUCTION
The banking system of various countries have undergone reforms aimed at enhancing economic growth and development. Developing countries are more aligned to banking reforms unarguably to globalization, technological advancement and integration into international financial market. Most countries in Central and Eastern Europe have adopted structural reforms in view of increasing the size, stability and efficiency of financial systems (Andries, Apetri & Cocris, 2012). Nwakoby & Ananwude (2016) observe that the contributions of the banking system towards the growth of an economy is primarily credited to the role it plays especially in savings mobilization and allocation of resources to deficit sectors of the economy.
Accordingly, the growth of an economy would depends on sturdiness, unassailability and stability of the financial system. Sanusi (2012) noted that the banking system not only facilitates effective and efficient payment and credit service delivery, but it is the central nervous system of a market economy and contains a number of separate, yet co-dependent, components all of which are essential to its effective and efficient functioning. The subjection of the banking system to regulation is based on the premise that it is one important sector in which the bank shareholders’ fund is an insignificant fraction relative to total liabilities. Macroeconomic goals of price stability, low rate of unemployment, favourable internal and external balances can be assiduously achieve through the proper functioning and stability of a country’s financial system. Banks play a crucial role in propelling the entire economy of any nation, of which there is need to reposition it for efficient financial performance through a reform process geared towards forestalling bank distress (Uduak & Ubong, 2015). The high rate of economic growth obtainable in developed countries were attributed to the reforms in the financial system done overtime. Following Uduak and Ubong (2015), banking sector reforms have been a regular feature in the Nigerian financial system, conducted mainly to improve the performance of commercial banks on the one hand and to improve the effectiveness and efficiency of the banking system and the economy in general. Okpanachi (2011) precisely stated that reform process of the banking sector in Nigeria is part and parcel of the government strategic agenda aimed at repositioning and integrating the Nigerian banking sector into the African regional and global financial system. We group the banking reforms in Nigeria from 1952 to date to seven distinct stages. The first banking reform in Nigeria banking system was witnessed in 1952 through the Banking Ordinance of 1952 following the banking failures that characterized the free
banking period of 1892 to 1952. Okaro (2009) noted that the 1952 banking ordinance defined a bank and banking business and prescribed minimum capital requirements for both expatriate and indigenous banks. The era of banking legislation: 1959 to 1970 initiated the operation of Central Bank of Nigeria on 1st July, 1959. In this era, the Banking Decree of 1969 adjusted the capital requirements again for indigenous banks (N500, 000 to N600, 000) and expatriate banks (N500, 000 to N1, 500,000), provided for capital deposit ratios for the first time, increased the capital loan ratio and extended the Central Bank of Nigeria power to include vetting banks advertisements and authorizing opening and closure bank branches, and bank amalgamations (Okaro, 2009). The indigenization era: 1970 to 1976 reflects the acquisition of interests by the Federal and State government in existing expatriate banks. In 1970-1986, rural banking services were extended in rural areas while 1986 to 2001 era reflects the implementation of the Structural Adjustment Programme (SAP) of President Ibrahim Babangida.
The year 2004 witnessed a landmark reform in the Nigeria banking system in contemporary time which saw the number of deposit money banks reduced to twenty five (25) from eighty nine (89) in existence before the implementation of the thirteen point agenda of the Central Bank of Nigeria led by Professor Charles Soludo. When Professor Charles Chukwumah Soludo became Governor of the Central Bank of Nigeria, CBN, the general perception was that another Mohammed Ali of Egypt and Emperor Menelik of Ethiopia or Henrique Cardoso of Brazil had come to reform the ailing economy (Saharareporters, 2009). The consolidation exercise of 2004 was to correct the structural and operational weaknesses, corporate governance and insolvency evidenced in the Nigeria banking system (Soludo, 2004). With the banking reform of 2004, depositors’ confidence in the financial system was boosted. The latest of the
reforms in the Nigeria banking sector was the rescue of eight (8) banks via injection of capital, liquidity and removal of affected banks top executive directors by the Central Bank of Nigeria following global financial crisis of 2007 - 2009 which saw the collapse of many legendary financial institutions. In the lecture delivered by Sanusi Lamido, then Governor of Central Bank of Nigeria at University of Warwick Economic Summit in 2012, he explicitly stated that Nigeria was hit by the global meltdown of 2007-2009 as a result of macroeconomic instability caused by large and sudden capital inflows, major failures in corporate governance at banks, lack of investor and consumer sophistication, inadequate disclosure and transparency about the financial position of banks, critical gaps in the regulatory framework and regulations, uneven supervision and enforcement, unstructured governance and management processes at the Central Bank of Nigeria/ and weaknesses in the business environment. To this effect, the banking system of Nigeria needs reform to restore the depositors’ confidence and sanity in the banking system.
Within the theoretical realm, performance of deposit money banks are expected to improve with banking system reforms, especially for developing countries to speed up the rate of economic growth and development. Nwakoby and Ananwude (2016) stated that immediately after the banking reform of 2004/2005, deposit money banks rolled out various technology service delivery channels to attract more customers to stay in the business, improve performance and compete favourable in the industry. There are a lot of controversy on existing empirical literature on banking sector reform and performance, particularly for emerging economies. The proponents of banking reform believe that increased size could potentially increase bank returns, through revenue and cost efficiency gains, however, the opponents argue that banking reform could increase banks’ propensity toward risk taking through
increases in leverage and off balance sheet operations. (Alalade, Adekunle & Oguntodu, 2016). The studies of Brissimis, Delis and Papanikolaou (2008) and Andries, Apetri and Cocris (2012) revealed that banking reform in newly acceded European countries and Romania improved banking sector performance. In the context of Nigeria, Ifionu and Keremah (2016), Okpara (2011), Uduak and Ubong (2015), Okpanachi (2011), Okorie and Agu (2015), Andow (2015), Alalade, Adekunle and Oguntoda (2016), Agbo (2013), Oluitan, Ashamu and Ogunkenu (2013) and Olayinka and Farouk (2014) have empirical shown that the various banking reforms in Nigeria have positively affected banking sector performance.
This is contradicting as Obadeyi (2014), Ogunsakin (2015), Alajekwu and Obialor (2014), Olokoyo (2013), Owolabi and Ogunlalu (2013) and Ilori and Ajiboye (2016) established that improved performance of the banking sector was not as a result of reforms in Nigeria banking system. Ilori and Ajiboye (2016) observe that a review of the banking system in 2004 revealed that marginal and unsound banks accounted for 19.2% of the total assets, 17.2% of total deposit liabilities, while industry non-performing asset was 19.5% of the total loans and advances in the same year which constitute a systematic distress threat. In addition, corrupt practices of top executive management in enriching themselves at detriment of shareholders and weak corporate governance structure also call for greater reforms in the banking system. Following the universal banking reform initiated in 1999, banks became awash with capital, which was deployed to multiple financial services resulting in abuse of the universal banking model by operators, with banks operating as a financial supermarket to the detriment of core banking practices (Martin Library, 2013). Sanusi (2012) stated that the universal banking helped corrupt managing directors of banks to channel funds from one subsidiary to another, thus creating the impression that there
was liquidity whereas there was a big hole. Banks provided diverse financial services under one roof, irrespective of whether such services were within the scope of the banks' core banking activities or not, the "one-size-fits-all" slogan became some kind of mantra, chanted by the banks (Reuben, 2010). It is against this backdrops that this study evaluates the effect of banking reforms on financial performance of the Nigeria’s banking sector in this time the country is witnessing obvious economic recession which the government itself has acknowledged.
Objectives of the Study
The focal point of this study is to evaluate the effect of banking reforms on financial performance of the Nigeria’s banking sector. However, the specific objectives are:
1. To evaluate the effect of minimum capital requirement on profit before tax of the Nigeria’s banking sub sector.
2. To assess the effect of minimum capital requirement on net interest income of the Nigeria’s banking sub sector.
Research Hypotheses
The hypotheses, stated in null, tested in the course of this study were:
1. Minimum capital requirement has no significant effect on profit before tax of the Nigeria’s banking sub sector.
2. Minimum capital requirement has no significant effect on net interest income of the Nigeria’s banking sub sector.
For comprehension, this paper is separated into sections with the introduction, objectives of the study and hypotheses as
section one. Section two dealt with literature review: conceptual issues and related empirical studies. Methodology was covered in section three, section four for data analysis and results while section five concluded the study and policy implication.
2. LITERATURE REVIEW
2.1.1 Conceptual Issues
The word “reform” is simply viewed as alteration of defects/lapses to achieve better performance/improve an existing institution/system. Reform is a mechanism used to drive a desired change; a shift from one normative course of action to another in a social or economic system so as to control the operations and operators of the system and enhance system performance (Alajekwu & Obialor, 2014). Bank restructuring or reform is an inevitable process when the existing structure of bank cannot fulfil the desired level of economies of scale in operation. However, lack of any one or all the prerequisites would not only bring disaster for banking and financial system, it sometimes might cost the real sector severely (Islam, 2013). These sorts of banking sector problems have been epitomized by the analysts and donors as banking fragility, crisis, distress, failure, collapse, insolvency and so on, which call for “banking reforms” on the part of the concerned banking system (Rahman, 2012). The reforms of the banking industry will have an influence on the functions, as it ultimately shapes the way they handle their operations (Ilori & Ajiboye, 2016). According to Alajekwu and Obialor (2014), banking reform can be categorized into systemic and big-bang banking reforms, the systemic banking reforms refer to a reform designed to resolve a combination of banking sector or economy wide problem while the big-bang reform is targeted to achieve a particular course (for example: increase capital base of banks). Thus, the reforms were to ensure the safety of depositors’ money, position banks
to play active developmental roles in the Nigerian economy, and become major players in the sub-regional, regional and global financial markets (Owolabi & Ogunlalu, 2013).
The availability of information about the return (or profit) a firm earns on its past investments to the point of the calculation enables shareholders to assess the performance of the company’s management; users will want to know how well companies are doing and also to know if it can be improved in the foreseeable future (Ifionu & Keremah, 2016). Financial performance appraises a firm’s ability to generate revenue through the utilization of assets. Financial performance also encompasses the general financial health of a firm over a given period of time. The financial performance of banks are vital for various stakeholders, depositors, government, etc. Banks financial performance would be evaluated in return on assets, return on equity, net interest margin, gross income, net profit margin and yield on earning assets among others. Policy makers, economists and monetary authorities recognize that the ability of banks to achieve the desired results and to continue to play the role earmarked for them depends not only on the existence of an enabling (regulatory) environment and the number of operating banks (and perhaps the spread of bank branches) but more importantly on their performance from one financial year to the other (Alalade, Adekunle & Oguntodu, 2016). The financial performance is necessary for banks to effectively perform its’ function of financial intermediation, resources mobilization and distribution which ultimately results in economic growth and development. Andries, Apetri and Cocris (2012) noted that efficiency and profitableness of banks constitutes a very important element in the analysis of financial systems, especially of the developing countries, at the level of which the banking system represents the main component of the financial system and which has known in the past years, major mutations at the level of the structure of
shareholding as a result of privatization, of the entry of foreign banks and of the increase of competition determined by the liberalization of the market and legislative changes.
2.1.2 Banking Reforms in Nigeria
The Nigeria Banking system has undergone a lot of banking reforms which have resulted in the current state of Nigeria banking system. The reforms in the Nigeria banking system, for the purpose of this study are grouped into seven (7) distinct stages. The first stage of banking reform in Nigeria banking system was the promulgation of the 1952 banking ordinance to tackle the banking failure witnessed within the free banking era: 1892 to 1952. Okaro (2009) reported that the ordinance prohibited banks from paying dividends before writing off capitalised expenditure and from banking loans against security of its shares, it imposed a ceiling on unsecured loans to directors and to companies in which directors had interest. Furthermore, the ordinance was generally reported as a giant effort at developing a sound banking system in Nigeria, since banks are the dominance sector of the financial service industry. The second stage is the era of banking legislation which opened with the operation of Central Bank of Nigeria on 1st July, 1959. The enabling act of Nigeria money and capital market was also put in motion by the 1959 banking ordinance. The third stage: indigenization era of 1970 to 1976 resulted in the government of Nigeria (both state and federal) acquiring stakes existing foreign banks under the indigenous enterprises promotion decree of 1972. In addition, Nigeria Agricultural and Corporative Bank and Nigeria Bank for Commerce and Industry was established to pick up the pace of economic growth and development. The fourth stage, which is the post Okigbo era, general reassessed the focal point of the Nigeria banking system by introducing banking services in the rural areas of the country.
The sixth stage termed the era of deregulation or universal banking saw the introduction of the Structural Adjustment Programme (SAP) where banks were permitted to engage in other activities aside core banking practices. However, this was grossly abused by banks operating in the country leading to the Professor Charles Soludo banking reform of 2004 known as “era of banking consolidation/recapitalization” in Nigeria. This resulted in the closure of some banks as operating license was revoked, and existing banks were forced to merge while some acquired by other banks to meet up with minimum capital requirement and stay in the business of banking. The seven/final phase is the banking reform of Sanusi Lamido termed “Sanusi Era”. The reform came as a result of the global financial meltdown that bevelled Nigeria and exposed the weak corporate governance and risk management structure of banks top executives. This resulted in the sack of some banks’ executive directors and mergers and acquisition of some banks. For instance, during this era, Eco Bank transnational corporation and Access Bank acquired Oceanic Bank and Intercontinental Bank respectively.
2.1.3 Measuring Banking System Performance
The CAMEL rating system is the widely accepted measure of bank performance. The Uniform Financial Institution rating system community referred to the acronym CAMEL rating was adopted by the Federal Institution Examination Council in Nov 13, 1979. CAMEL has now become a concise and indispensable tool for examiners and regulators to measure bank performance (Ilori & Ajiboye, 2016). CAMEL is an acronym for Capital Adequacy, Asset Quality, Management Quality, Earning Ability and Liquidity. The essence of the CAMEL rating system is ensure soundness and stability of the banking sector. However, for the purpose of this study, earning ability/financial performance aspect of the CAMEL is precisely discussed. The
CAMEL earning ability of the banking sector entails that ability of the banks to earn income from their licenced business operations. This rating reflects not only the quality and trend in earning but also the factors that may affect the sustainability of earnings (Ilori & Ajiboye, 2016). The appropriate choice of measures of earnings largely determines the degree of proper representative ness of multidimensional behaviour of the specific performance area (Islam, 2013). The widely used gauge for assessing the earnings of banks are return on assets, return on equity, profit before tax net interest margin. Others are dividend per share, earnings per share, net assets per share, yield on earning assets and net interest income among others.
2.2 Empirical Literature
In an attempt in examining the relationship reforms in the banking system and the performance of the banking sector, Brissimis, Delis and Papanikolaou (2008) found that performance of the banking sector was propelled by the reformed embarked by EU countries. In Eastern and Central Europe: Bulgaria, Romania, Poland, Hungary and Slovakia from 2001 ending in 2008, Andries, Apetri and Cocris (2012) found that the banking reforms in these countries impacted positively on the performance of banks licensed to operate in the said countries. In Nigeria, Ilori and Ajiboye (2016) empirically revealed that there is a long run positive relationship between reforms in Nigerian banking system and banks performance. Applying Pair-wise Granger Causality, error correction and Johansen co-integration approach to testing the long run relationship between variables concerned, Credit to Private sector, Bank Asset, Non-Performing Loan To Total Loans and Liquidity Ratio were negatively related and impacts on Credit to Private sector. In the same vain, Alalade, Adekunle and Oguntodu (2016) empirically showed that Nigerian banking sector improve in profitability were as a
result of the reforms of the Central Bank of Nigeria. Alajekwu and Obialor (2014) showed that profitability of Nigeria Banking sector were not significantly affected by banking system reform via bank capitalization of 2004 with full implementation in 2005. Be it as it may, Agbo (2013) emphatically proved that the universal banking reform of Nigeria was able to propel growth in the real sector of the economy. Ifionu and Keremah (2016) envisaged that improved level of Deposit Money Banks profitability was associated to the various bank reforms in Nigeria. Olokoyo (2013) showed that the manufacturing sector has been greatly enhanced by the recapitalization exercise of 2004.
Okpara (2011) established that return on equity of the Nigerian banking sector appreciated to a high esteem through the various banking reforms in the country that all banking sector. However, the recapitalization exercise of 2004 was found to have drastically reduced shareholders wealth. On the contrary, Owolabi and Ogunlalu (2013) proved that bank performance does depend primarily on reforms in the banking system. Uduak and Ubong (2015) observed that reforms in Nigerian banking system brought about some important changes in Commercial Banks Performance in Nigeria as the net interest margin appreciated to 20.96 in 2011 from 9.17 in 1996. Okpanachi (2011) unequivocally exhibited proved that performance pf banks in Nigeria has drastically improved via mergers and acquisition of banks following the reform agenda of Central Bank of Nigeria in 2004. Okorie and Agu (2015) study of the Nigeria banking sector revealed that the enhancement in profitability of banks should not be entirely be attributed to reforms in the sector as performance of banks before and after the consolidation programme of 2004 were still poor and not that encouraging but Olokoyo (2012) attributed the growth in profit of the banking sector as a result of deregulation of the banking sector.
The study of Obadeyi (2014) showed that the effect of financial reform on banking performance is mixed as effective banking performance in Nigeria is not dependent on reforms in the system. Ikpefan and Kazeem (2013) were able to show the Nigeria banking industry performed better after the reform programme of 2004 and this is affirmed by Oluitan, Ashamu and Ogunkenu (2015) whom proved empirically that the consolidation exercise of 2004 impacted positively on banking sector performance in Nigeria. Capturing banking system performance indices in Nigeria using a time series of bank data obtained from 1970 to 2010, Kanu and Isu (2013) showed that the increment in minimum capital requirement of banks in Nigeria and profitability are related in the long run. Olayinka and Farouk (2014) studying from 2000 to 2011 envisaged that Prof. Charles Soludo’s consolidation of 2004/2005 impacted positively and significantly Nigeria banks performance. Olajide, Asaolu and Ayodele (2011) using yearly data from 1995 to 2004 showed that government interventions in the banking sector and the banking sector itself have mixed result on net interest margin and level of profitability. Government intervention was not found to have significantly impacted on bank’s performance but banks specific factors had significant influence on bank performance within the period studied.
2.3 Gap in Literature Identified
The empirical literature reviewed showed that return on assets, return on equity, profit after tax and net interest margin were the indicators of financial performance adopted by researchers such Alalade, Adekunle and Oguntodu (2016), Ilori and Ajiboye (2016), Alajekwu and Obialor (2014), Agbo (2013) and Ifionu and Keremah (2016) among others. This study bridged the lacuna noticed by employing net interest income in addition to profit after tax as measures of financial performance of banks. Furthermore, as banks’ total assets plus off balance sheet
engagement and ratio of non-performing loans to total loans were included as control variables in the model capable of affecting performance.
3. METHODOLOGY
This study adopted a test of causation in order to examine the effect of minimum required shareholders’ fund on financial performance of banking sector in Nigeria for a period of seventeen (17) years from 1999 to 2015. This period covered the era of universal banking, landmark consolidation of 2004/2005 and Sanusi reforms reform which actualized by virtue of the global financial meltdown of 2007 to 2009. Secondary data were sourced from Central Bank of Nigeria (CBN) banking supervision reports and Nigerian Deposit Insurance Corporation (NDIC) report. Profit before Tax (PBT) and Net Interest Income (NII) are the dependent variables. The independent variable is minimum capital requirement (MCR). Total Assets plus Off Balance Sheet Engagement (TAOBSE) and Non-Performing Loans to Total Credit Ratio (NPLTCR) were included in the models as control variables capable of influencing banks’ financial performance. DUM is a dummy variable to capture the ear of universal banking, consolidation era and Sanusi reform era.
3.1 Model Specification
A modified model of Kanu and Isu (2013) for a study in Nigeria was mimicked. In their model, the researchers expressed banking sector performance-banking reform model as:
( ) In evaluating the effect of banking reforms on banking sector performance, the following multivariate models were estimated:
( ) ( ) To obtain the coefficients of the elasticity of the variables, while reducing the possible impact that any outlier may have, the models were represented in a log-linear econometric format. Thus: Model 1 Model 2 Where:
PBT is profit after tax; NII is net interest income; MCR is minimum capital requirement; TAOBSE is total assets plus off balance sheet engagement and NPLTCR is non-performing loan to total credit ratio and DUM is a dummy variable: is a constant term, u is a random error/disturbance term and t is the time trend; these are normally included in standard time-series specifications to account for the omitted variables as well as unexplained random effects within the model.
4. DATA ANALYSIS AND RESULTS
4.1 Trend in Research Variables Minimum Capital Requirement
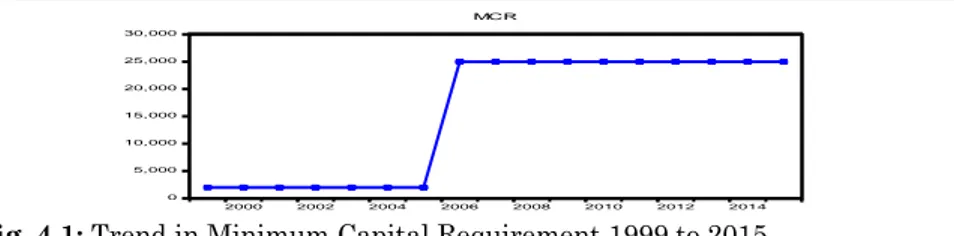
The minimum capital requirement in the era of the universal banking was perked N2.0 billion. However, with the banking reform of 2004, it was increased to 25 billion for international banking operation, reflecting a 1,150% upsurge in required minimum shareholders’ fund. This changes in minimum capital requirement from 1999 to 2015 is shown in Fig. 4.1.
0 5,000 10,000 15,000 20,000 25,000 30,000 2000 2002 2004 2006 2008 2010 2012 2014
Fig. 4.1: Trend in Minimum Capital Requirement 1999 to 2015
Source: Central Bank of Nigeria (CBN) Banking Supervision Reports.
Profit before Tax
The banking sector recorded a huge loss in 2009 as the profit before tax was ₦-1,377,330 million compared to ₦607,000 million of 2008. This may be due to the global financial crisis of that year. In 2012, profit before tax increased by 1,000% to ₦458,780 million. As can be seen from Fig. 4.2, the banking sector continued to record success in profit before tax from 2012 to 2015. -1,600,000 -1,200,000 -800,000 -400,000 0 400,000 800,000 2000 2002 2004 2006 2008 2010 2012 2014 PBT
Fig. 4.2: Trend in Profit before Tax 1999 to 2015
Source: Central Bank of Nigeria (CBN) Banking Supervision Reports.
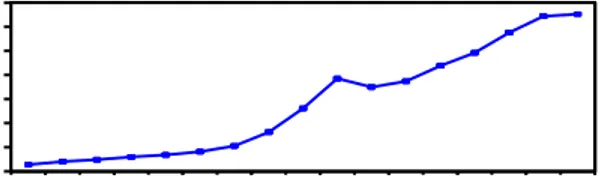
Net Interest Income
The net interest income has been continuously on the rise from 1999 to 2015. The net interest income was ₦22,054 million in 1999, which had risen by 1,500% at the end of 2015 to settle at ₦1,248,693 million. From 1999 to 2015, as shown in Fig. 4.3, it is clear that the Nigeria banking sector has been performing well in terms of net interest income over the period covered.
Total Assets plus off Balance Sheet Engagement
The banking sector total assets plus off balance sheet engagements has increased tremendously over the years. From
₦1,372,606 million in 1999, it rose to reach ₦18,684,930 million at the end of 2010 then continue to appreciate closing at ₦21,891,560 million in 2011. Between 2013 and 2015 total assets plus off balance sheet engagements rose from ₦28,789,120 million to ₦32,640,272 million. Fig. 4.4 shows the variations in banking sector total assets plus balance sheet engagements. 0 200,000 400,000 600,000 800,000 1,000,000 1,200,000 1,400,000 2000 2002 2004 2006 2008 2010 2012 2014 NII
Fig. 4.3: Trend in Net Interest Income 1999 to 2015.
Source: Central Bank of Nigeria (CBN) Banking Supervision Reports.
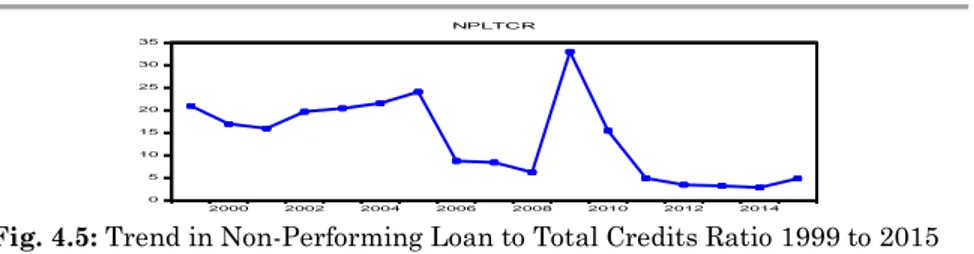
Non-Performing Loan to Total Credits Ratio
Fig. 4.5 show that the trend in non-performing loan to total credits ratio from 1999 and 2015 fluctuated considerably, changing from 21% in 1999 to 4.87% in 2015. The non-performing loan to total credits ratio at the end of the year 2009 reached a peak of 33.03% as against 2008 when it was just 6.26%. Fig. 4.5 depicts this fluctuation.
0 5,000,000 10,000,000 15,000,000 20,000,000 25,000,000 30,000,000 35,000,000 2000 2002 2004 2006 2008 2010 2012 2014 TAOBSE
Fig. 4.4: Trend in Total Assets Plus off Balance Sheet Engagements 1999 to 2015
0 5 10 15 20 25 30 35 2000 2002 2004 2006 2008 2010 2012 2014
Fig. 4.5: Trend in Non-Performing Loan to Total Credits Ratio 1999 to 2015
Source: Central Bank of Nigeria (CBN) Banking Supervision Reports.
4.2 Descriptive Properties
Table 1 presents the descriptive properties of the variables applied in this study. The mean values of the PBT, NII, MCR, TAOBSE, NPLTCR and DUM are 177281.2, 635503.9, 15529.41, 14011761, 13.60353 and 2.058824 as the median shown to be 96000.00, 616000.0, 25000.00, 13050000, 15.49000 and 2.000 respectively. The maximum values of the variables are 607340.0, 1298590, 25000.00, 32640272, 33.03, and 3.00 for PBT, NII, MCR, TAOBSE, NPLTCR and DUM respectively. The minimum values are -1377330 for PBT, 22054 for NII, 2000 for MCR, 1372606 for TAOBSE, 2.88 for NPLTCR and 1.000 for DUM. The variables’ standard deviation are 469342.9 for PBT, 497163.9 for NII, 11667.89 for MCR, 11225518 for TAOBSE, 8.98 for NPLTCR and 0.899 for DUM. NII. TAOBSE and NPLTCR were found to be positively skewed towards normality as evidenced by the positive values of the skewness statistic. The Kurtosis value shows that all the variables are leptokurtic in nature except for PBT as evidenced by the less than 3 values of the Kurtosis statistic. The Jarque-Bera suggests that all the variables are not normally distributed as the p-values are insignificant at 5% level of significance except for PBT.
Table 1: Descriptive Properties
PBT NII MCR TAOBSE NPLTCR DUM
Mean 177281.2 635503.9 15529.41 14011761 13.60353 2.058824 Median 96000.00 616000.0 25000.00 13050000 15.49000 2.000000 Maximum 607340.0 1298590. 25000.00 32640272 33.03000 3.000000 Minimum -1377330. 22054.00 2000.000 1372606. 2.880000 1.000000 Std. Dev. 469342.9 497163.9 11667.89 11225518 8.985201 0.899346 Skewness -2.110745 0.128890 -0.358569 0.362710 0.414062 -0.114001 Kurtosis 8.209810 1.313524 1.128571 1.690365 2.204282 1.323058 Jarque-Bera 31.84886 2.061712 2.845043 1.587644 0.934261 2.028752 Probability 0.000000 0.356701 0.241105 0.452114 0.626798 0.362629 Sum 3013780. 10803567 264000.0 2.38E+08 231.2600 35.00000 Sum Sq. Dev. 3.52E+12 3.95E+12 2.18E+09 2.02E+15 1291.741 12.94118 Observations 17 17 17 17 17 17
Source: Computer analysis using E-views9.0
4.3 Diagnostic Test Result Serial Correlation LM Test
The serial Correlation LM test may be used to test for higher order ARMA errors and is applicable whether there are lagged dependent variables or not. The null hypothesis of LM test is that there is no serial correlation up lag order 2. The p-values of the Breusch-Godfrey serial correlation test in Table 2 are insignificant at 5%, suggesting that the null hypothesis could not be rejected. Therefore, the models are free from autocorrelation.
Table 2: Breusch-Godfrey Serial Correlation LM Test
Models F-statistic Prob. F(2,9)
Model 1 2.851534 0.1047
Model 2 2.639441 0.1325
Source: Computer analysis using E-views9.0
Heteroskedasticity Test
The probability of the Chq. statistic for the models are insignificant at 5% level of significance, suggesting that there is no existence of heteroskedasticity in the models. This fulfils the econometric assumption that a model should be free from problem of heteroskedasticity. Test of heteroscedascticity for the models is presented in Table 3.
Table 3: Heteroskedasticity Test
Models F-statistic Prob. F(4,11)
Model 1 1.991555 0.1600
Model 2 1.778315 0.1980
Source: Computer analysis using E-views9.0
Ramsey RESET Test
The correct specification of the models was evaluated using the Ramsey RESET test. The essence was to ascertain if non-linear combinations of the independent variables have any power in explaining the dependent variable or not. If the dependent variable is explained by the non-linear combinations of the independent variables, the model is not well specified. The significant at 5% level of significance of p-values as in Table 4 shows that the models were well specified.
Table 4: Ramsey RESET Test
Models Value df Probability
Model 1 2.064727 (2, 9) 0.0756
Model 2 1.855234 (8, 5) 0.0616
Source: Computer analysis using E-views9.0
Multicollinearity Test
The correlation between the independent variables was observed highest (0.84) for minimum capital requirement and total assets plus off balance sheet engagements. However, the minimum capital requirement is a regulatory variable while total assets plus off balance sheet engagements is banks’ specific factor that might impact on performance. Thus, both were allowed to be in the same model (despite high correlation) because there from different facet of the environment. Table 5 summarises the correlation between the variables.
Table 5: Correlation Matrix
PBT NII MCR TAOBSE NPLTCR DUM
PBT 1.000000 0.262007 0.199004 0.352666 -0.762435 0.120498 NII 0.262007 1.000000 0.842217 0.976599 -0.617769 0.903323 MCR 0.199004 0.842217 1.000000 0.840743 -0.612158 0.878347 TAOBSE 0.352666 0.976599 0.840743 1.000000 -0.674885 0.904178 NPLTCR -0.762435 -0.617769 -0.612158 -0.674885 1.000000 -0.475305 DUM 0.120498 0.903323 0.878347 0.904178 -0.475305 1.000000
Source: Computer analysis using E-views9.0
4.4 Unit Root Result
Augmented Dickey-Fuller (ADF) Test
The ADF test was performed in level and first difference at intercept and trend and intercept. It was revealed in Table 6 and 7 that all the variables were not stationary in level form at intercept and trend and intercept except PBT.
Table 6: ADF Test Result at Level: Intercept
Variables ADF Test Statistic Test Critical Value
at 1%
Test Critical Value at 5%
Remark PBT -4.776874 (0.02)** -3.920350 -3.065585 Stationary
NII -0.595371 (0.84) -3.920350 -3.065585 Not Stationary
MCR -1.145644 (0.67) -3.920350 -3.065585 Not Stationary
TAOBSE 0.787942 (0.99) -3.920350 -3.065585 Not Stationary
NPLTCR -2.336704 (0.17) -3.920350 -3.065585 Not Stationary
DUM -0.836660 (0.78) -3.920350 -3.065585 Not Stationary
Source: Computer analysis using E-views9.0
Table 7: ADF Test Result at Level: Trend and Intercept
Variables ADF Test Statistic Test Critical
Value at 1%
Test Critical
Value at 5%
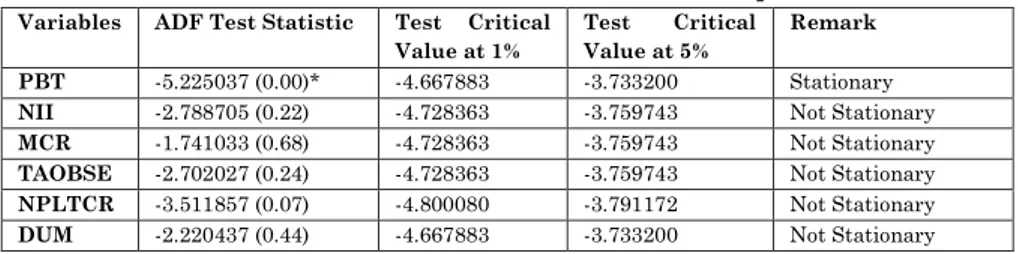
Remark PBT -5.225037 (0.00)* -4.667883 -3.733200 Stationary
NII -2.788705 (0.22) -4.728363 -3.759743 Not Stationary
MCR -1.741033 (0.68) -4.728363 -3.759743 Not Stationary
TAOBSE -2.702027 (0.24) -4.728363 -3.759743 Not Stationary
NPLTCR -3.511857 (0.07) -4.800080 -3.791172 Not Stationary
DUM -2.220437 (0.44) -4.667883 -3.733200 Not Stationary
Source: Computer analysis using E-views9.0
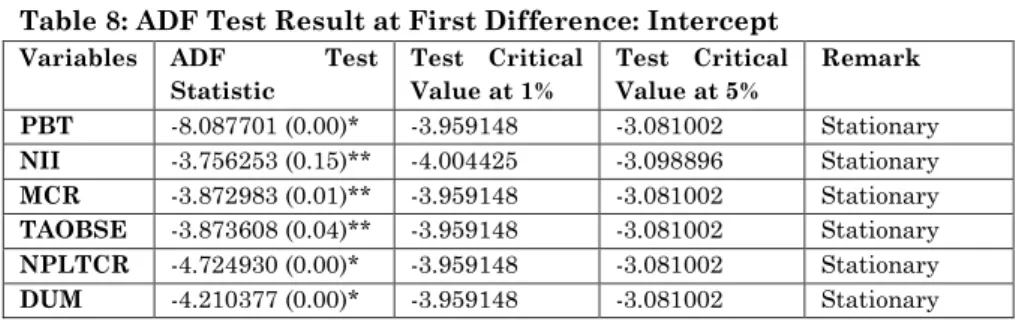
The stationarity test in Tables 8 and 9 at intercept and trend and intercept of first difference shows that all the variables became stationary at first difference at the 5% level of significance and integrated of order one i.e. 1(1).
Table 8: ADF Test Result at First Difference: Intercept
Variables ADF Test
Statistic Test Critical Value at 1% Test Critical Value at 5% Remark PBT -8.087701 (0.00)* -3.959148 -3.081002 Stationary NII -3.756253 (0.15)** -4.004425 -3.098896 Stationary MCR -3.872983 (0.01)** -3.959148 -3.081002 Stationary TAOBSE -3.873608 (0.04)** -3.959148 -3.081002 Stationary NPLTCR -4.724930 (0.00)* -3.959148 -3.081002 Stationary DUM -4.210377 (0.00)* -3.959148 -3.081002 Stationary
Source: Computer analysis using E-views9.0
Table 9: ADF Test Result at First Difference: Trend and Intercept
Variables ADF Test
Statistic Test Critical Value at 1% Test Critical Value at 5% Remark PBT -4.573102 (0.01)* -4.800080 -3.791172 Stationary NII -4.592195 (0.04)** -4.800080 -3.791172 Stationary MCR -3.772879 (0.04)** -4.728363 -3.759743 Stationary TAOBSE -3.894756 (0.04)** -4.728363 -3.759743 Stationary NPLTCR -4.559387 (0.01)* -4.728363 -3.759743 Stationary DUM -4.062382 (0.03)** -4.728363 -3.759743 Stationary
Source: Computer analysis using E-views9.0
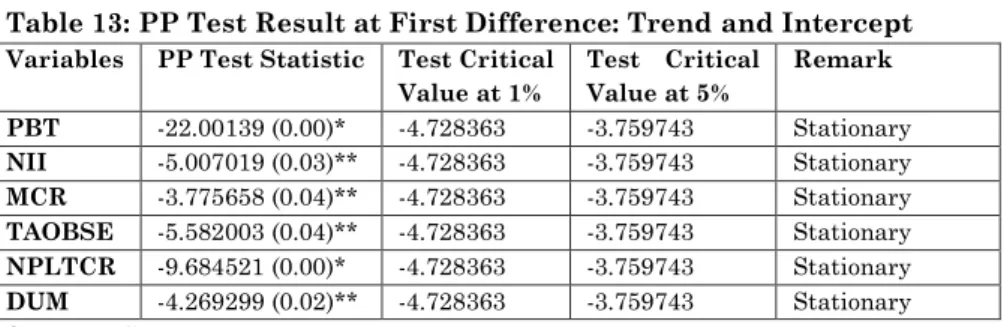
Phillips Perron (PP) Test
The Phillips Perron (PP) test in level and first difference at intercept and trend and intercept. Tables 10 and 11 show the result of the level form test at intercept and trend and intercept while Tables 12 and 13 that of first difference at intercept and trend and intercept. The result in Tables 10 and 11 show that all the variables are not stationary at level form.
Table 10: PP Test Result at Level: Intercept
Variables PP Test Statistic Test Critical Value at 1% Test Critical Value at 5% Remark PBT -4.776874 (0.00)* -3.920350 -3.065585 Stationary
NII -0.485059 (0.87) -3.920350 -3.065585 Not Stationary
MCR -1.137044 (0.67) -3.920350 -3.065585 Not Stationary
TAOBSE 0.933754 (0.99) -3.920350 -3.065585 Not Stationary
NPLTCR -2.336704 (0.17) -3.920350 -3.065585 Not Stationary
DUM -0.699600 (0.81) -3.920350 -3.065585 Not Stationary
Table 11: PP Test Result at Level: Trend and Intercept Variables PP Test Statistic Test Critical Value at 1% Test Critical Value at 5% Remark PBT -5.241476 (0.00)* -4.667883 -3.733200 Stationary
NII -1.856172 (0.63) -4.667883 -3.733200 Not Stationary
MCR -1.741033 (0.68) -4.667883 -3.733200 Not Stationary
TAOBSE -2.558303 (0.30) -4.667883 -3.733200 Not Stationary
NPLTCR 3.345907 (0.09) -4.667883 -3.733200 Not Stationary
DUM 2.276386 (0.42) -4.667883 -3.733200 Not Stationary
Source: Computer analysis using E-views9.0
The Phillip Perron (PP) test in Table 12 and 13 illustrate that all the variable are stationary at first difference. The result of the unit root test through ADF and PP shows that all the variables are stationary at first difference which allows for the testing of the long run relationship between the variables.
Table 12: PP Test Result at First Difference: Intercept
Variables PP Test Statistic Test Critical Value at 1% Test Critical Value at 5% Remark PBT -20.22207 (0.00)* -3.959148 -3.081002 Stationary NII -3.351273 (0.03)** -3.959148 -3.081002 Stationary MCR -3.873097 (0.01)* -3.959148 -3.081002 Stationary TAOBSE -4.724994 (0.04)** -3.959148 -3.081002 Stationary NPLTCR -8.764561 (0.00)* -3.959148 -3.081002 Stationary DUM -4.387140 (0.00)* -3.959148 -3.081002 Stationary
Source: Computer analysis using E-views9.0
Table 13: PP Test Result at First Difference: Trend and Intercept
Variables PP Test Statistic Test Critical Value at 1% Test Critical Value at 5% Remark PBT -22.00139 (0.00)* -4.728363 -3.759743 Stationary NII -5.007019 (0.03)** -4.728363 -3.759743 Stationary MCR -3.775658 (0.04)** -4.728363 -3.759743 Stationary TAOBSE -5.582003 (0.04)** -4.728363 -3.759743 Stationary NPLTCR -9.684521 (0.00)* -4.728363 -3.759743 Stationary DUM -4.269299 (0.02)** -4.728363 -3.759743 Stationary
4.5 OLS Regression
The OLS regression was utilized to test relationship between banking reform via minimum capital requirement and bank performance. The coefficient of Adjusted R-squared as well as individual independent variables, F-statistic and Durbin Watson statistic were the statistic criteria used in evaluating the regression result.
Banking Reform and Profit before Tax
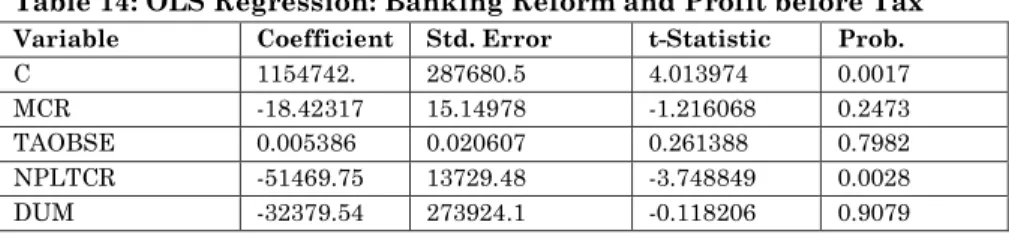
Table 14 depicts that banking reform as evidenced by increase in minimum capital requirement has negative and statistically significant relationship with profit before tax of the banking sector. Non-performing loan to total credit ratio was found to be significantly and negatively relates with profit before tax. On the other hand, total assets of banking sector inclusive of off balance sheet engagement has positive insignificant relationship with profit before tax. The co-efficient of the constant 1147542 is an indication that if banking reform in incorporation of total assets plus off balance sheet engagement and non-performing loan to total credit ratio are held constant, banking sector profit before tax would stand at N1, 147, 542 million. A unit increase in minimum capital base would results to a corresponding reduction 18.42 million reduction in banking sector profit before tax. A percentage increase in the ratio of non-performing loan to total credit leads to N51, 469.75 million depreciation in profit before tax. Similarly, a unit increase in banks’ total assets inclusive of off balance sheet engagements catapults to N0.005 million rise in profit before tax.
Table 14: OLS Regression: Banking Reform and Profit before Tax
Variable Coefficient Std. Error t-Statistic Prob.
C 1154742. 287680.5 4.013974 0.0017
MCR -18.42317 15.14978 -1.216068 0.2473
TAOBSE 0.005386 0.020607 0.261388 0.7982
NPLTCR -51469.75 13729.48 -3.748849 0.0028
R-squared 0.698078 Mean dependent var 177281.2
Adjusted
R-squared 0.597437 S.D. dependent var 469342.9
S.E. of regression 297788.0 Akaike info criterion 28.28608
Sum squared resid 1.06E+12 Schwarz criterion 28.53114
Log likelihood -235.4317 Hannan-Quinn criter. 28.31044
F-statistic 6.936331 Durbin-Watson stat 3.079188
Prob (F-statistic) 0.003930
Source: Computer analysis using E-views9.0
The Adjusted R-squared reveals that 59.74% variation in the profit before tax was as a result of the joint fluctuation in the explanatory variables: minimum capital requirement, total assets plus off balance sheet engagements and ratio of non-performing loan to total credit ratio. The significant value (5% significance level) of the F-statistic entails that banking reform inclusive of banks’ specific variables significantly explained that changes in banking sector profit before tax. The Durbin Watson statistic, in addition to the serial correlation LM test in Table 4.3a signifies that the variables in the model are not serially correlated.
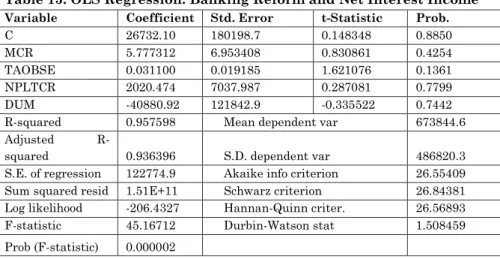
Banking Reform and Net Interest Income
As can be seen in Table 15, banking reform has positive but insignificant relationship with net interest income of banking sector in Nigeria. Non-performing loan to total credit ratio and total assets plus off balance sheet engagements have positive relationship with net interest income, however, the relationship between net interest income and total assets inclusive of off balance engagements is statistically significant at 5% level of significance. The coefficient of the constant discloses that holding minimum capital requirement, non-performing loan to total credit ratio and total assets inclusive of off balance engagements constant, net interest would be N26, 732.10 million. A unit increase in minimum capital requirement leads to N5.77 upsurge in net interest income. A percentage increase
in total assets inclusive of off balance sheet engagement rises net interest income by N0.031 million. On the other hand, net interest income would appreciate by N2, 020.47 billion by a unit rise in non-performing loan to total credit ratio.
Table 15: OLS Regression: Banking Reform and Net Interest Income
Variable Coefficient Std. Error t-Statistic Prob.
C 26732.10 180198.7 0.148348 0.8850
MCR 5.777312 6.953408 0.830861 0.4254
TAOBSE 0.031100 0.019185 1.621076 0.1361
NPLTCR 2020.474 7037.987 0.287081 0.7799
DUM -40880.92 121842.9 -0.335522 0.7442
R-squared 0.957598 Mean dependent var 673844.6
Adjusted
R-squared 0.936396 S.D. dependent var 486820.3
S.E. of regression 122774.9 Akaike info criterion 26.55409
Sum squared resid 1.51E+11 Schwarz criterion 26.84381
Log likelihood -206.4327 Hannan-Quinn criter. 26.56893
F-statistic 45.16712 Durbin-Watson stat 1.508459
Prob (F-statistic) 0.000002
Source: Computer analysis using E-views9.0
From the Adjusted R-square, banking reform controlled with non-performing loan to total credit ratio and total assets inclusive of off balance engagements propelled 93.64% changes in net interest income. This statistically significant as evidenced by the F-statistic and P-value of 45.17 and 0.00 respectively. Although the Durbin Watson value of 1.5 is not quite close to 2.0, the deficiency associated with this was corrected with the aid of the serial correlation test in Table 4.3a where the model was diagnosed of autocorrelation.
4.6 Long Run Relationship
The stationarity test for the variables as presented in Table 6 – 13, there was considerable evidence that all the variable have unit root and a devoid of stationarity defect that affects most time series data, hence giving room to testing the long run relationship between the variables concerned. The results of the
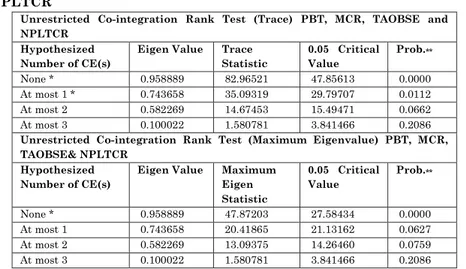
long run relationship conducted using the Johansen co-integration methodology are summarised in Tables 16 and 17. The long run test in Table 16 reveals that banking reform and banking sector profit before tax are co-integrated in the long run. The trace and max-eigenvalue each indicate two (2) and one (1) co-integrating equations at 5% level of significance.
Table 16: Johansen Co-integration for PBT, MCR, TAOBSE and NPLTCR
Unrestricted Co-integration Rank Test (Trace) PBT, MCR, TAOBSE and NPLTCR
Hypothesized Number of CE(s)
Eigen Value Trace
Statistic 0.05 Critical Value Prob.** None * 0.958889 82.96521 47.85613 0.0000 At most 1 * 0.743658 35.09319 29.79707 0.0112 At most 2 0.582269 14.67453 15.49471 0.0662 At most 3 0.100022 1.580781 3.841466 0.2086
Unrestricted Co-integration Rank Test (Maximum Eigenvalue) PBT, MCR, TAOBSE& NPLTCR
Hypothesized Number of CE(s)
Eigen Value Maximum
Eigen Statistic 0.05 Critical Value Prob.** None * 0.958889 47.87203 27.58434 0.0000 At most 1 0.743658 20.41865 21.13162 0.0627 At most 2 0.582269 13.09375 14.26460 0.0759 At most 3 0.100022 1.580781 3.841466 0.2086
Trace test and Max-eigenvalue test indicate 2 and 1 co-integrating eqn(s) at the 0.05 level;
* denotes rejection of the hypothesis at the 0.05 level; **MacKinnon-Haug-Michelis (1999) p-values.
From Table 17, the trace test and Max-eigenvalue test each show the presence of two (2) co-integrating equations at the 5% level of significance in line with MacKinnon-Haug-Michelis (1999) p-values. The result implies that there is exists of a long run relationship between banking reform and net interest income of the banking sector.
Table 17: Johansen Co-integration for NII, MCR, TAOBSE and NPLTCR
Unrestricted Co-integration Rank Test (Trace) NII, MCR, TAOBSE and NPLTCR Hypothesized Number of CE(s) Eigen Value Trace Statistic 0.05 Critical Value Prob.** None * 0.991177 107.2323 47.85613 0.0000 At most 1 * 0.780748 36.27580 29.79707 0.0078 At most 2 0.593667 13.51282 15.49471 0.0973 At most 3 0.000273 0.004095 3.841466 0.9477
Unrestricted Co-integration Rank Test (Maximum Eigenvalue) NII, MCR, TAOBSE& NPLTCR Hypothesized Number of CE(s) Eigen Value Maximum Eigen Statistic 0.05 Critical Value Prob.** None * 0.991177 70.95648 27.58434 0.0000 At most 1* 0.780748 22.76298 21.13162 0.0292 At most 2 0.593667 13.50872 14.26460 0.0656 At most 3 0.000273 0.004095 3.841466 0.9477
Trace test and Max-eigenvalue test each indicate 2 co-integrating eqn(s) at the 0.05 level;
* denotes rejection of the hypothesis at the 0.05 level; **MacKinnon-Haug-Michelis (1999) p-values.
4.7 Vector Error Correction Model
To determine the speed of adjustment in short run, the vector correction model was executed and result condensed in Tables 18 and 19. From Table 18, the error correction model did not show the expected negative sign, an indication that the model does not shift towards the equilibrium path following disequilibrium witnessed in each period. However, for net interest income, the error correction model depicts the expected negative sign as shown in Table 19. This suggests that the model moves towards equilibrium path and significant error is taking place. 61.97% of the error generated in the previous year is corrected in the current year.
Table 18: Vector Error Correction Model for PBT
Variables Coefficient Standard
Error T-Statistic C 736191.7 793801 0.92743 D(PBT(-1)) -0.946324 0.95482 -0.9911] D(MCR(-1)) 11.99744 36.3820 0.32976 D(TAOBSE(-1)) -0.329415 0.34840 -0.94551 D(NPLTCR(-1)) 4026.555 31949.5 0.12603 ECM (-1) 1.141530 2.35504 0.48472
Source: Computer analysis using E-views9.0
R-squared: 0.641954, Adjusted R-squared: 0.443040, S.E. equation: 584871.0, F-statistic: 3.227288.
Table 19: Vector Error Correction Model for NII
Variables Coefficient Standard
Error T-Statistic C 138932.5 25275.0 5.49685 D(NII(-1)) -0.288524 0.18676 -1.54491 D(MCR(-1)) -14.65175 5.28002 -2.77494 D(TAOBSE(-1)) -0.006616 0.01175 -0.56285 D(NPLTCR(-1)) -2247.339 2320.68 -0.96840 ECM (-1) -0.619709 0.11115 -5.57553
Source: Computer analysis using E-views9.0
R-squared: 0.925419, Adjusted R-squared: 0.883986, S.E. equation: 53534.93, F-statistic: 22.33495.
4.8 Granger Causality Effect Assessment Test
To assess the effect of banking reform on banking sector performance in Nigeria, the granger causality test was utilized and the results condensed in Table 20 and 21. The result in Table 20 indicates that minimum capital requirement a proxy for banking reform does not granger cause profit before tax of the banking sector, that is, there is no bidirectional or unidirectional relationship between that banking reform and profit before tax at 5% level of significance. This result shows that banking reform has significant effect on Nigerian banking sector profit before tax.
Table 20: Granger Causality Result for PBT, MCR, TAOBSE and NPLTCR
Null Hypothesis: Obs F-Statistic Prob. Remarks
MCR does not Granger Cause PBT PBT does not Granger Cause MCR
15 0.30139 0.00135 0.7463 0.9987 No Causality No Causality TAOBSE does not Granger Cause PBT
PBT does not Granger Cause TAOBSE
15 1.29274 1.14397 0.3167 0.3569 No Causality No Causality NPLTCR does not Granger Cause PBT
PBT does not Granger Cause NPLTCR
15 1.23766 1.76739 0.3309 0.2202 No Causality No Causality
Source: Computer analysis using E-views9.0
From Table 21, there is a unidirectional relationship between banking reform as expressed with minimum capital requirement and net interest income as causality flows from banking reform to net interest income at 5% level of significance. This portrays that banking reform has significant effect on net interest income of the Nigerian banking sector over the period reviewed. It was observed also that non-performing loan to total credit ratio has significant effect on net interest income, an insinuation that the higher the ratio of non-performing loan to total credit, the lower the net interest income of the banking sector.
Table 21: Granger Causality Result for NII, MCR, TAOBSE and NPLTCR
Null Hypothesis: Obs F-Statistic Prob. Remarks
MCR does not Granger Cause NII NII does not Granger Cause MCR
15 8.86604 0.07486 0.0061 0.9284 Causality No Causality TAOBSE does not Granger Cause NII
NII does not Granger Cause TAOBSE
15 1.96308 0.34115 0.1909 0.7189 No Causality No Causality NPLTCR does not Granger Cause NII
NII does not Granger Cause NPLTCR
15 5.32739 1.79785 0.0266 0.2153 Causality No Causality
Source: Computer analysis using E-views9.0
4.8 Test of Hypotheses
Decision Criteria: If the p-value of F-statistic in granger causality test is less than 0.05, the null hypothesis is rejected. On the other hand, if the p-value of F-statistic granger causality test is greater than 0.05, the null hypothesis is accepted.
Hypothesis One
Restatement of Research Hypothesis
H0: Minimum capital requirement has no significant effect on profit before tax of the Nigeria’s banking sub sector.
Looking at the F-statistics of 0.30139 with p-value of 0.7463 (more than 0.05) in Table 20, the null hypothesis that minimum capital requirement has no significant effect on profit before tax of the Nigeria’s banking sub sector would not be rejected that is, the null hypothesis that Minimum capital requirement has no significant effect on profit before tax of the Nigeria’s banking sub sector is accepted.
Hypothesis Two
Restatement of Research Hypothesis
H0: Minimum capital requirement has no significant effect on net interest income of the Nigeria’s banking sub sector.
From Table 21, the p-value of 0.0061 is less than 0.05, hypothesis decision criteria. To this effect, the null hypothesis that minimum capital requirement has no significant effect on net interest income of the Nigeria’s banking sub sector is rejected and the alternative hypothesis that minimum capital requirement has significant effect on net interest income of the Nigeria’s banking sub sector accepted.
4.9 Discussion of Findings
The regression result in Table 4.5a depicts that banking reform reflected by minimum capital requirement has significant negative relationship with profit before tax of the Nigerian banking sector. This is against the a priori expectation of a positive relationship. This is a clear evidence that the previous minimum capital requirement of N2 billion was enough for deposit banks to operate soundly and maintain needed liquidity taking into consideration the dynamic nature and uncertainty in Nigeria macroeconomic indexes. No wonder why banks
merged and sourced fund from the stock exchange to stay in business. Although the banking reform in Nigeria has been empirically found to have improved performance via the studies of Ilori and Ajiboye (2016), Alalade, Adekunle and Oguntodu (2016), Alajekwu and Obialor (2014), Agbo (2013), Ifionu and Keremah (2016), Olokoyo (2013), Okpara (2011), Owolabi and Ogunlalu (2013), Okpanachi (2011), Kanu and Isu (2013) and Okorie and Agu (2013), this research however, support these previous studies by establishing that banking reform significantly affect net interest income of the Nigerian banking sector. Nevertheless, profit before tax was found not be significantly affected by banking reform within the period covered by this study. Non-performing loan to total credit ratio negatively and exerting significant effect on banking sector net interest income is an indication that bad debts grossly erode earnings of banks and as such, granting of loan and advances should be done in line with the Central Bank of Nigeria prudential guideline so that the liquidity of the banking sector would be sustained and enhance, hence boosting confidence in the financial system.
5. CONCLUSION AND POLICY IMPLICATIONS
The financial performance of the banking sector is very critical for the survival of the financial system, especially in a developing country like Nigeria where productive economic activities rely more on the banking system compared to the stock market for finance. The findings of this study show that, for the period reviewed, banking reform has significant effect on financial performance reflected by net interest income but such is not the case for profit before tax of the banking sector. This portrays that increases in indexes of banking reforms has the potential on improving banking sector performance which ultimately results in economic growth and development. This
study concludes that banking reform exerts significance influence on banking sector performance in Nigeria.
In view of the findings of this study, the following recommendations are suggested to bank management and policymakers for execution to improve the banking sector operation and financial system stability in general:
Banking reform significantly affecting net interest margin when controlled by total assets plus off balance sheet engagement is an implication that there is need for banks’ to improve their assets quality and off balance sheet engagements by advancing loans to productive sectors of the economy rather than seeing oil and gas sector as the only fertile and profitable sector for large loans and advances.
The banking sector should try as much as possible to reducing the ratio of non-performing loan to total credit as this negatively affects performance and increases credit risk associated bad debts.
REFERENCES
1. Agbo, JCO. Assessment of the Impact of Universal Banking on Bank Performance in Nigeria. European Journal of Business and Management, 2013; 5(19): 42-48.
2. Alajekwu, UB, Obialor, MC. Nigerian Bank Recapitalisation Reforms: Effect on the Banks and the Economy (2000 – 2012). International Journal of Managerial Studies and Research, 2014; 2(2): 48-56. 3. Alalade, YSA, Adekunle, OA, Oguntodu, JA. Empirical
predicate of bank performance: a case of Nigeria. International Journal of Advanced Academic Research, 2016; 2(2): 1-19.
4. Andries, AM, Apetri, AN, Cocris, V. The impact of the banking system reform on banks performance. African Journal of Business Management, 2012; 6(6): 2278-2284. 5. Andow, HA. Impact of banking reforms on service delivery in the Nigerian banking sector. Second 21st Century Academic Forum Conference Boston, USA at Harvard, 2015; 5(1): 45-58.
6. Babalola, E, Odoko, FO. The performance and future of mandatory allocation of credit to selected sectors in the Nigerian Economy. CBN Economic and Financial Review, 1996; 34(3): 56-68.
7. Brissimis, SN, Delis, MD, Papanikolaou, NI. Exploring the nexus between banking sector reform and performance: evidence from newly acceded EU countries, 2008. Bank of Greece working paper No. 73.
8. Copeland, TE. Financial theory and corporate policy, 1980. Addison Wesley publication.
9. Fry, M. Savings, investment and growth, and the cost of financial repression world development. World Development, 1980; 8, 317–327.
10.Gujarati, DN. Basic Econometric. 4th Ed., 2004. New York, McGraw-Hill Inc.
11.Ifionu, EP, Keremah, SC. Bank Reforms and Deposit Money Banks Performance: Evidence from Nigeria. European Journal of Business and Management, 2016; 8(7): 132-156.
12.Ikpefan, OA, Kazeem, BO. The effect of merger on deposit money banks performance in the Nigerian banking industry. Journal of Applied Finance & Banking, 2013; 3(4): 105-123.
13.Ilori, IA, Ajiboye, MO. Bank reforms and banking sector performance: Evidence from Nigeria. International Journal of Economic Research, 2016; 7(1): 52 – 71.
14.Islam, S. Banking sector reform and its effect on the performance of commercial banks in Bangladesh, 2013. A Dissertation Submitted to Institute of Governance Studies BRAC University, Dhaka.
15.Kanu, C, Isu, H. The impact of capitalization on bank performance in Nigeria 1970 – 2010: an assessment. International Review of Business and Management Research, 2013; 2(3): 643-652.
16.Martin Library. On-going banking sector reform in Nigerian economy, 2013. Retrieved on 9th February,
2017. Available at:
http://martinslibrary.blogspot.com.ng/2013/04/on-going-banking-sector-reform-in_10.html.
17.Nwakoby, CIN, Ananwude, AC. The role of non-bank financial institutions on financial intermediation process in Nigeria (1992-2014). British Journal of Economics, Management and Trade, 2016; 14(4): 1-15.
18.Obadeyi, JA. The effect of financial reforms on banking performance in an emerging market: Nigerian experience. Research Journal of Finance and Accounting, 2014; (23): 57-66.
19.Ogunsakin, S. Impact of banking sector reforms on the performance of Nigerian economy. Civil and
Environmental Research, 2015; 7(5): 70-77. 20.Okaro, CS. Banking laws and regulation, 2009. ABIMAC
publications.
21.Okpara, GC. Bank reforms and the performance of the Nigerian banking sector: an empirical analysis. International Journal of Current Research, 2011; 2(1): 142-153.