Static Analysis Driven Cache Performance Testing
Abhijeet Banerjee
Sudipta Chattopadhyay
Abhik Roychoudhury
National University of Singapore
{
abhijeet,sudiptac,abhik
}
@comp.nus.edu.sg
Abstract—Real-time, embedded software are constrained by
several non-functional requirements, such as timing. With the ever increasing performance gap between the processor and the main memory, the performance of memory subsystems often pose a significant bottleneck in achieving the desired performance for a real-time, embedded software. Cache memory plays a key role in reducing the performance gap between a processor and main memory. Therefore, analyzing the cache behaviour of a program is critical for validating the performance of an embedded soft-ware. In this paper, we propose a novel approach to automatically generate test inputs that expose the cache performance issues to the developer. Each such test scenario points to the specific parts of a program that exhibit anomalous cache behaviour along with a set of test inputs that lead to such undesirable cache behaviour. We build a framework that leverages the concepts of both static cache analysis and dynamic test generation to system-atically compute the cache-performance stressing test inputs. Our framework computes a test-suite which does not contain anyfalse
positives. This means that each element in the test-suite points to
a real cache performance issue. Moreover, our test generation
framework provides an assurance of the test coverage via a well-formed coverage metric. We have implemented our entire framework using Chronos worst case execution time (WCET) analyzer and LLVM compiler infrastructure. Several experiments suggest that our test generation framework quickly converges towards generating cache-performance stressing test cases. We also show the application of our generated test-suite in design space exploration and cache performance optimization.
I. INTRODUCTION
Real-time, embedded software are required to satisfy several extra-functional properties, such as timing. Therefore, per-formance validation marks a crucial stage before certifying such time-critical software. In the absence of appropriate performance-validation techniques, the deployed software may suffer from severe performance problems, such as missing deadlines. For example, in the context of an anti lock brak-ing systems (ABS), missing a deadline may lead to serious accidents, causing human lives.
Due to the inherent gap between processor and memory performances, memory subsystems may significantly affect the performance of an embedded software. To reduce such effect, a fast cache memory is often employed between a processor and main memory. In a modern embedded processor, cache memories are several magnitudes faster than the main memory. Therefore, at any point in execution, the content of the cache memory significantly impacts the performance of the underlying embedded software. The content of a cache is managed at runtime and such content depends on the accessed memory block sequence. Since different inputs to the same application may follow different execution paths, the sequence
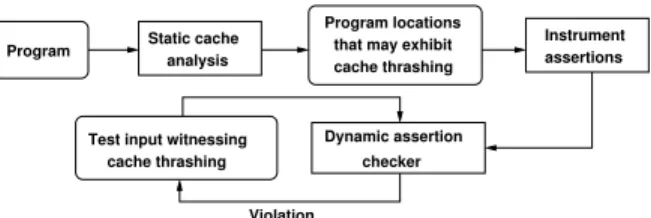
Program Static cache
analysis
Instrument assertions
Dynamic assertion checker Test input witnessing
cache thrashing
Violation
Program locations that may exhibit cache thrashing
Fig. 1: Test generation framework
of accessed memory blocks in an execution critically depends on the input provided to the application. As a consequence, the performance of caches (and hence the performance of an application) critically depends on the input provided to the underlying embedded software.
In this paper, we propose a novel approach to automati-cally generate test inputs that expose performance problems due to memory subsystems. In particular, we generate test inputs to automatically detect performance stressing memory access sequences. Such poor memory access sequences are undesirable, as they may lead to critical cache performance issues, specificallycache thrashing at runtime. We propose a test generation framework that aims to report cache thrashing scenarios that exist in some program execution. Each element in our report contains a unique cache thrashing scenario and a symbolic formula capturing the set of inputs that expose the issue in a program execution.
However, the generation of cache-performance stressing test inputs requires solving several technical challenges. This is primarily due to the fact that cache performance issues cannot be detected solely by monitoring the program execution (unlike most of the problems in functionality testing). To over-come this problem, we employ novel strategies to instrument the original program with a set of assertions at appropriate locations. Such an instrumentation isentirely automatic. The violation of any assertion captures a unique cache thrashing scenario in the original program (and not in the program instrumented with assertions). Thus, such assertion violations can be reported to the developer for investigation. We first carry out static cache analysis on the program to decide the set of program points that may exhibit cache thrashing. Subsequently, we systematically generate assertions at such places to expose cache thrashing in the program itself. In a broader view, therefore, we reduce the problem of testing cache performance to an equivalent functionality testing problem. The required functionality of the software is augmented with the set of assertions introduced by us.
B0 B1 B2 B3 B4 B5 B6 B7 B8 B9 m1 (NC) m (PS) m1 (NC) m3 (NC) m4 (NC) m2 (NC) m2 (NC) m5 (PS) m7 (PS) m6 (PS) y ≤ 10 x ≤ 3 x ≥ 1 x > 3 y > 10 x < 1 m3 m1 m m5 m6 Instrumented code
Instrumented code Instrumented code
Instrumented code m2 m4 m7 m1 m2 Memory blocks outside loop are not considered
f (C_m1,C_m2)1 f (C_m1,C_m2)2 f (C_m3,C_m4)2 f (C_m3,C_m4) 1 x ≤ 3 x > 3 x < 1 x ≥ 1 y ≤ 10 y > 10 assert (C_m3 ≤ 0 V C_m4 ≤ 0) assert (C_m1 ≤ 0 V C_m2 ≤ 0) assert (C_m1 ≤ 0 V C_m2 ≤ 0) assert (C_m3 ≤ 0 V C_m4 ≤ 0) B0 B1 B2 B3 B4 B5 B6 B7 B8
B9 Violation (cache thrashing between m1 and m2)
Increments C_m2
Increments C_m1
No assertion violation Test input:
x = 3, y = 0 Symbolic input condition:
Test input: Symbolic input condition:
x = 4, y = 0 f1(C m1,C m2) assert (C m1≤0VC m2≤0) f2(C m1,C m2) assert (C m1≤0VC m2≤0) f1(C m1,C m2) assert (C m1≤0VC m2≤0) f2(C m1,C m2) assert (C m1≤0VC m2≤0) f2(C m1,C m2) assert (C m1≤0VC m2≤0) f2(C m1,C m2) assert (C m1≤0VC m2≤0) f1(C m3,C m4) assert (C m3≤0VC m4≤0) f1(C m3,C m4) assert (C m3≤0VC m4≤0) x ≤ 3^x ≥ 1^y ≤ 10 x>3^x≥1^y≤10 (a) (b) (c)
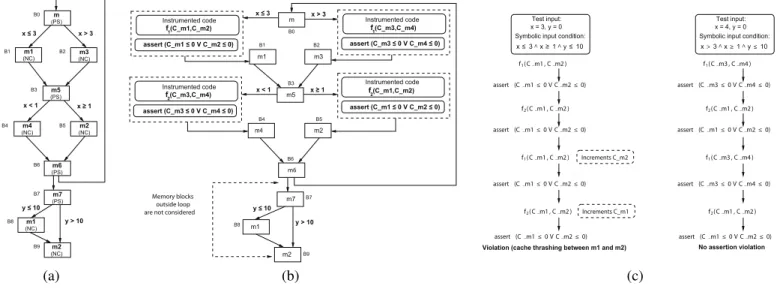
Fig. 2:Overview of test generation (a) program control flow graph with accessed memory blocks shown inside each basic block. Thecache hit-miss classifications (CHMC) are also shown along with each memory block. The branch conditions are shown beside the respective control flow edges, (b) instrumented program with assertions to exposecache thrashing behaviour, (c) violation of assertion in an execution trace captures thecache thrashing scenarioinvolving memory blocksm1andm2
To check the validity of different assertions, we build a dy-namic path explorationstrategy that directs the path searching process towards the set of instrumented assertions. Each time an assertion is encountered during execution, its validity is checked on-the-fly. If an assertion is not satisfied during pro-gram execution, a cache-performance issue is recorded along with the respective input state (i.e.the set of inputs that leads to the violation of the assertion, cf. Figure 1). Primary objective of the path exploration strategy is to check maximum number of unique assertions, in a given amount of time. Therefore, to improve the search efficiency of path exploration, we direct the search process towards a control flow that has maximum number of unchecked assertionscontrol dependenton it. Such a directed search is accomplished by consulting the control dependency graph of the instrumented program. Finally, since we dynamically explore the set of assertions, our computed test-suite does not contain any false positives. Precisely, any test case included in the computed test-suite captures a cache performance issue (specifically, a cache thrashing scenario) in somefeasible executionof the software.
Contributions: In summary, we propose a test-generation framework that exposes the cache performance issues of an embedded software to the developer. Such a framework leverages the results obtained from an abstract interpretation based cache analysis to determine the cache behaviour and directs a dynamic test generation process to explore only the relevant portions of a program (i.e. program subparts that may exhibit cache performance issues). Due to the usage of dynamic analysis in test generation process, one appealing nature of our generated test suite is that it does not include anyspurious test cases (i.e. a test-case that does not capture a cache performance issue in any feasible execution). We have implemented the entire framework using Chronos [11],
an open source, freely available worst case execution time (WCET) analyzer. and LLVM [2], an open source, freely available compiler infrastructure. Specifically, the dynamic test generation process is implemented on top of LLVM and the static cache analysis is built on top of Chronos. Our experience with several open source subject programs suggests that we can quickly find several cache-performance stressing test cases. Last but not the least, we show the application of our test suite in (i) design space exploration and (ii) cache performance optimization.
II. OVERVIEW
In this section, we shall give an outline of our test generation process that stresses the cache performance of a program. We shall walk through a simple example as shown in Figure 2. For the sake of illustration, let us assume a direct-mapped cache where memory blocks {m1, m2, m3, m4, m, m5, m6, m7} in
the control flow graph are mapped to different cache sets
{S1,S2,S3,S4,S5,S6} as follows: m1 7→ S1, m2 7→ S1,
m3 7→ S2,m4 7→ S2, m 7→ S3, m5 7→ S4, m6 7→ S5 and
m7 7→ S6. Therefore, m1 and m2, as well as m3 and m4
conflict in the cache.
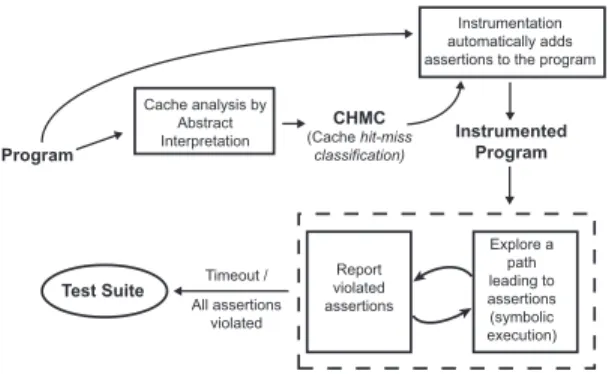
Figure 3 presents an overview of our test generation frame-work. Broadly, our approach contains two separate steps: (i) static cache analysis and (ii) dynamic test generation to expose different cache thrashing scenarios in the program. The static cache analysis directs the dynamic test generation process to explore only the relevant portions of a program. Such relevant portions capture designated program points that are more likely to expose cache thrashing behaviour.
Static cache analysis is performed via abstract interpretation [18]. Memory blocks are categorized as AH (always cache hit), AM (always cache miss) and PS (persistentor never evicted
Program Instrumented Program CHMC (Cachehit-miss classification) Test Suite All assertions violated Timeout / Cache analysis by Abstract Interpretation Instrumentation automatically adds assertions to the program
Report violated assertions Explore a path leading to assertions (symbolic execution)
Fig. 3:Overview of our test generation framework
from the cache). If a memory block cannot be categorized as AH, AM or PS, it is categorized as NC (not classified). As an AH/PS categorized memory block can face only cold cache misses, we conclude that AH/PS categorized memory blocks can never be involved in a cache thrashing scenario. Therefore, only AM or NC categorized memory blocks exhibit potential sources of cache thrashing. If we employ abstract interpretation based cache analysis in the example program of Figure 2(a), we observe that memory blocksm,m5,m6and
m7are categorized as PS (note thatm,m5andm6do not face
any cache conflict within the loop). On the contrary, memory blocks m1, m2, m3 and m4 are categorized as NC (as m1
conflicts with m2 andm3 conflicts withm4 in the cache). The key to our test generation approach is to create an interface between static cache analysis and dynamic test generation. Such an interface is developed via systematically generatingassertions. The set of assertions has anone-to-one correspondencewith the set ofcache thrashing scenarios. The violation of any assertion exposes a unique cache thrashing scenario. Therefore, in a broader perspective, our perfor-mance testing framework can be viewed as a reduction of the cache performance problem to an equivalent functionality testing problem. Figure 2(b) demonstrates the schematic of the interface. The interface mainly consists of two parts: (i) instrumented code to count cache conflicts, and (ii) set of assertions to be checked. It is worthwhile to note that the instrumented program (i.e. Figure 2(b)) may have a different cache behaviour compared to the original program. This is due to the presence of additional instrumented code in Figure 2(b). However, the instrumented code (i.e.functionsf1 andf2) as
well as the assertions (cf. Figure 2(b)) take input from memory blocks in the original program (i.e.memory blocksm1,m2,m3
andm4in Figure 2(a)). Therefore, violation of any assertion captures a cache thrashing scenario in the original program shown in Figure 2(a) (and not in the instrumented program shown in Figure 2(b)).
Let us first consider the set of memory blocks {m1, m2}
in Figure 2(b). C m1 (C m2) captures the amount of cache conflicts generated to memory block m1 (m2). Specifically, for least recently used (LRU) cache replacement policy,
C m1 (C m2) captures the number of unique cache con-flicts (i.e. number of unique memory blocks mapping to the same cache set) between two consecutive accesses of memory
block m1 (m2). Therefore, if C m1 > 0 (recall that we assumed a direct-mapped cache) before accessing memory block m1, accessing m1 will result in a cache miss. The instrumented code essentially manipulates the set of variables
{C m1, C m2, C m3, C m4}through some additional code
fragments. At this point, without going into the details of instrumentation, we represent the instrumentation asfunctions to show the specific variables they manipulate. As shown in Figure 2(b), a function f1(C m1, C m2) only manipulates
C m1andC m2(and neitherC m3norC m4). In general, a cache miss does not necessarily capture a cache thrashing scenario. For the set of memory blocks{m1, m2}, we infor-mally say that a cache thrashing happens whenbothm1 and
m2 are evicted from the cache at least once. Therefore, the cache thrashing scenario involving memory blocks m1 and
m2 is captured by the following formula:
Φ12≡C m1>0∧C m2>0
The placed assertion checks the formula ¬Φ12 ≡ C m1 ≤
0∨C m2≤0 during dynamic test generation process. As a result, any violation of the assertion (formula¬Φ12) captures
a cache thrashing scenario in a real execution. The cache thrashing scenario involving memory blocks {m3, m4} can be captured in a similar fashion using the formula Φ34 ≡
C m3 > 0∧C m4 > 0. Therefore, the violation of ¬Φ34
during the dynamic test generation process will capture areal cache thrashing scenarioinvolving memory blocksm3&m4. Let us now investigate our dynamic test generation process. The primary goal of the dynamic test generation module is to stress the execution towards the set of instrumented assertions. The idea of our dynamic test generation has been inspired by recent advances in satisfiability modulo theory (SMT) and constraint-based test generation [12]. Our test generation module first executes the instrumented program with a random input, records the set of violated assertions (i.e. the set of real cache thrashing scenarios) and collects the constraints along the executed path. We assume x and
y are inputs to the program. Figure 2(c) captures the ex-ecution trace for an input x = 3, y = 0. Due to the increment of both C m1 and C m2 (by the instrumented
codef1(C m1, C m2)andf2(C m1, C m2), respectively),
the assertionassert(C m1≤0∨C m2≤0) is violated (as shown in Figure 2(c). Such an assertion violation captures the cache thrashing scenario involving memory blocks m1 and
m2. To drive the execution towards other assertions, we first collect the constraints along the current execution trace. For an inputx= 3, y= 0, such constraints can be expressed by the formulax≤3∧x≥1∧y≤10. To execute a different path, one of the branch conditions (i.e. x≤ 3, x≥1 ory ≤ 10) must be negated [12]. Our test generation employs strategies to systematically negate the branches, so that the execution may lead tomaximum number of unchecked assertions.
To check maximum number of assertions, we consult the control dependency graph (CDG) of a program. CDG captures the set of control conditions that are necessary to execute a certain statement. Figure 4 shows the CDG of Figure 2(b). The
ENTRY B9 B8 B1(A1) B7 B7 B6 B0 B3 A1 : assert (C_m1 ≤ 0 V C_m2 ≤ 0) A2: assert (C_m3 ≤ 0 V C_m4 ≤ 0) UA : Unchecked Assertions
B2(A2) B4(A2) B5(A1)
UA = 2
B0 UA = 2B3
UA = 4B6 UA = 0B7
Fig. 4:Control Dependence Graph, for Figure 2(a)
two assertion from the 2(b) as shown as literalsA1andA2in the CDG. The value against each control dependency nodes denotes the maximum number of unchecked assertion (U A) reachable from that node. In the example shown in Figure 2(b) three control conditions x ≤ 3, x ≥ 1 and y ≤ 10
correspond to blocks B0, B3 and B7 respectively. As can be observed from Figure 4, negating the control condition at
B7 (i.e. y ≤ 10) will not lead to any unchecked assertions. Therefore, we must negate the control conditions at B0 (i.e.
x ≤3) orB3 (i.e. x≥1). In general, our method employs a greedy strategyto pick a control condition, which can lead to maximum number of unchecked assertions. Assume that branchx≤3is chosen for negation and we obtain a test input
x= 4, y= 0for the symbolic conditionx >3. Executing the program forx= 4, y= 0never violates any assertions. Note that the formula x >3∧x < 1 must be satisfied to execute
bothf1(C m3, C m4)andf2(C m3, C m4). However, the
formula x > 3∧x < 1 is clearly unsatisfiable. Therefore,
x > 3∧x < 1 captures an infeasible path in Figure 2(a)
and f1(C m3, C m4) andf2(C m3, C m4) cannot appear
in any execution trace together. As a result, the assertion
assert(C m3≤0∨C m4≤0) is always validated.
In the end, for the example shown in Figure 2, our frame-work findsexactly onecache thrashing scenario (that involves memory blocks m1 and m2) and a test input capturing the same thrashing scenario (i.e. x = 3 for a symbolic formula
x ≤ 3∧x ≥ 1). Our framework guarantees to cover all the assertions at the end of the test generation method. Note that such a process is in general undecidable[12] due to the inherent limitations imposed by constraint solvers. Therefore, the test generation process may go on forever. However, our test generation has the anytime property, meaning that the test generation process can be terminated anytime if the time budget is violated. After such a premature termination, the computed test-suite exposes a subset of thrashing scenarios that exist in the program. In fact, due to our directed search via CDG, our experimental results suggest that we can find most thrashing scenarios very early in the test generation process.
System and application model: In this work, we shall assume the traditional configuration of WCET analysis. There-fore, we consider only uninterrupted executions of a program and the computed thrashing scenarios appear solely due to the intra-task variant of cache conflicts. However, given a set of
preemption points, our technique can be extended to capture thrashing scenarios that may appear only in the presence of preemptions. Such an extension will need to instrument the preempting tasks to compute the inter-task cache conflicts and it will require to shift the execution across tasks during test generation. Moreover, for the sake of simplicity, our framework is shown for separated instruction and data caches. To consider unified caches, the computation of cache conflicts can be combined during instrumentation (i.e.the computation of variables{C m1, . . . , C m4} in Figure 2).
III. TEST GENERATION METHODOLOGIES
In this section, we shall describe our test generation method-ologies in detail. Broadly, our test generation methodology contains two substeps: (i) systematically generating assertions to expose cache thrashing behaviour and (ii) a dynamic test generation to check the validity of the generated assertions. We shall elaborate these two steps in the following sections. For the sake of simplicity, we shall describe the core method-ologies for instruction caches and we shall mention the minor changes required in the instrumentation to handle data caches. A. Generating assertions
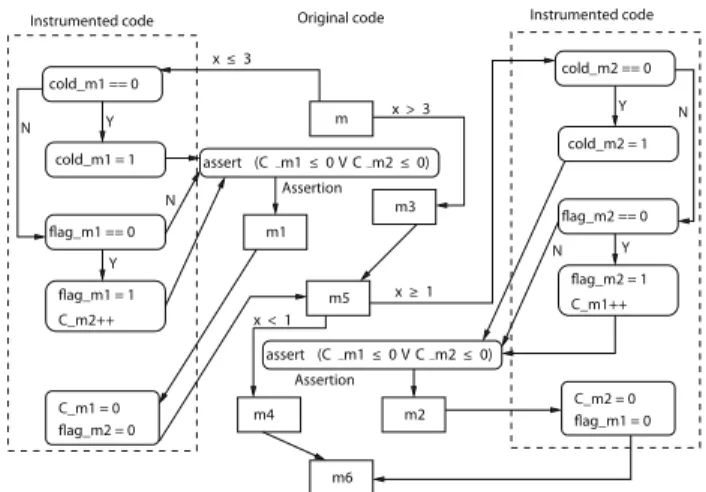
1) Code Instrumentation: Figure 5 shows the instrumented code for our example program in Figure 2. We assume that memory blocks m1 and m2 conflict in a direct-mapped cache. Therefore, after the static cache analysis, both m1
andm2 are categorized as unclassified(NC). Informally, the instrumented code manipulates the cache conflict faced by a particular memory block. Such an instrumentation depends on the underlying cache replacement policy. For the sake of illustration, we shall use least recently used (LRU) cache replacement policy. However, such an instrumentation can easily be changed for other cache replacement policies (e.g. FIFO) in a similar fashion as in our previous work [9].
C_m1 = 0 flag_m2 = 0 m3 m m5 m6 m1 Y Y Instrumented code Instrumented code
Assertion Assertion Original code cold_m1 == 0 cold_m1 = 1 C_m2++ Y N Y N N N flag_m1 == 0 flag_m1 = 1 cold_m2 == 0 cold_m2 = 1 flag_m2 == 0 flag_m2 = 1 C_m1++ C_m2 = 0 flag_m1 = 0 m4 m2 assert (C m1≤0VC m2≤0) x>3 x≤3 x≥1 x<1 assert (C m1≤0VC m2≤0)
Fig. 5: Instrumented code with assertions
The heart of the instrumentation shown in Figure 5 lies in manipulating the two variables C m1 and C m2. For LRU cache replacement policy and a particular memory block
m, C m captures the number of unique cache conflicts between two consecutive accesses of memory block m 1
. While counting such cache conflicts, we do not count the conflicts generated merely due tocold misses. Let us consider the instrumented code before memory block m1 (as shown in Figure 5). Since memory block m1 creates conflicts to only memory block m2, such cache conflicts are captured by the increment of variable C m2. Variable f lag m1 is used to count onlyunique cache conflicts (i.e.the number of unique memory blocks conflicting with memory block m1). Besides, variable cold m1 is used to discard the cold cache missfor accessing memory blockm1. The instrumented code introduced for memory blockm2is entirely symmetric to the one introduced for blockm1.
2) Formulation of assertions: The crucial step of the instru-mentation is to systematically inserting assertions to expose cache thrashing. Cache thrashing behaviour only happens inside program loops. Therefore, for rest of the discussion, we shall only consider memory blocks inside program loops. Moreover, without loss of generality, we shall consider mem-ory blocks mapped to a single cache set. For set-associative caches, the process is identically applied for each cache set.
The formulation of an assertion depends on the definition of cache thrashing. Therefore, we first formally define the notion ofcache thrashingused in this paper.
Definition 3.1: Consider a K-way set associative cache. A set of memory blocks M:={M1, M2, . . . , MK+1} is said to have cache thrashing if and only if, for all i ∈ [1,K+ 1], access to Mi suffers at least one non-cold miss and all the cache conflicts for this non-cold miss are generated by the set of memory blocks M \ {Mi}.
In the preceding definition of cache thrashing, the number of non-coldmisses (sayX) is a tunable parameter. In our work, we assume X = 1. However, in the following, we show that our technique can be generalized for different values of X.
The instrumented code in Figure 5 takes the accessed memory blocks in the original program (i.e.the set of memory blocks{m1, m2, m3, m4}in Figure 2(a)) as input. Therefore, it is worthwhile to note that the instrumented code manipulates cache conflicts in the original program (i.e. Figure 2(a)) and not the instrumented program shown in Figure 5. Since the validity of inserted assertions are based on this instrumented code, any violation of an assertion essentially captures a cache thrashing scenario in the original program (i.e. the program shown in Figure 2(a)).
To describe the generation of assertions, we shall begin with a few notations and definitions. Let us assume Ml =
{M1, M2, . . . , MN} is the set of memory blocks accessed
inside some program loop. We define a thrashing set as a subset of Ml that may be potentially involved in cache
thrashing. Formally, a thrashing setT Sl is defined as follows
T Sl={m| m∈ Ml∧CHMC(m)6=PS
∧CHMC(m)6=AH} (1)
1For FIFO cache replacement policy,C mcaptures the number of unique
cache conflicts faced bymsince it is last reloaded into the cache [9]
In Equation 1,CHMC captures thecache hit-miss
classifi-cationobtained via static cache analysis [18]. Note that AH
(all-hit) and PS (persistent) categorized memory blocks can
never be evicted from the cache (due to the inherent guarantee provided by static analysis). Therefore, we do not include such memory blocks as the potential cause of cache thrashing.
From a thrashing set, we define a number of thrashing scenarios. Informally, a cache thrashing scenario contains just enough memory blocks from a thrashing set to create a potential cache thrashing. If we assume that the associativity of the cache is K, the minimum number of memory blocks to create a cache thrashing is K+ 1. Therefore, a thrashing scenario for a thrashing set T Sl is defined as any K + 1
combination of the thrashing set T Sl. The set of all cache
thrashing scenariosΩl can be defined as follows.
Ωl={ S⊆ T Sl | |S|=K+ 1} (2)
Note that a thrashing set T Sl has a total of |T SK+1l|
different cache thrashing scenarios.
Finally, we generate exactly one assertion for each cache thrashing scenario. Let us assume one such cache thrashing scenarioΘ∈Ωl and its respective assertion AΘ. Informally,
the assertionAΘcaptures the property that thrashing scenario
Θnever happens in any program execution. As a result, any violation of the assertion AΘ during dynamic test generation
captures a realization of the thrashing scenario Θ. Formally, thrashing scenarioΘis captured by the following property.
ΦΘ≡
^
m∈Θ
(Cm>K) (3)
In Equation 3,Cm captures the amount of unique cache
con-flicts faced by two consecutive accesses of memory blockm. Since the assertion checks the negation of thrashing scenario, it can be formalized as follows.
AΘ ≡assert(¬ΦΘ) (4)
The assertion AΘ is placed before each memory block
in-volved in the thrashing set Θ. For example, in Fig. 5, the set{m1, m2} captures a thrashing scenario and the assertion
assert(C m1≤0∨C m2≤0)was placed before accessing
memory blocksm1 andm2.
The purpose of the preceding assertion (Eq. 4) is to validate thatat least one of the memory block from the thrashing set is never evicted from the cache. Therefore, if all of the memory blocks in a thrashing set are evictedat least once, an assertion violation will be triggered and a cache performance issue will be reported. The assertion AΘ is checked dynamically
before accessing each memory block involved in the thrashing scenarioΘ.
It is worthwhile to mention that our formalization to cap-ture cache thrashing (i.e. Definition 3.1 and Equation 3) is independent of cache replacement policy. Therefore, such a formalization can be applied to a wide variety of cache architectures. The effect of different cache architectures (e.g. caches with different replacement policies) will be reflected via the variableC m(cf. Section III-A1). Finally, we can also
generalize the notion of reporting a cache thrashing scenario at runtime. Specifically, a cache thrashing scenario can be reported for X number of violations of an assertion (and therebyX number of evictions for each memory block in the respective thrashing set) instead of only one violation. Such a generalization also corresponds to the reconfiguration of the number of non-cold misses, as described in Definition 3.1.
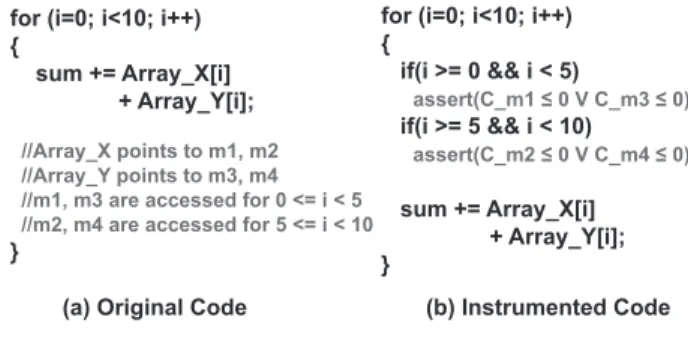
3) Handling data caches: For data caches, the memory block classification is obtained using the scope-aware per-sistent (SCP) analysis [13]. SCP analysis can be used to classify data memory blocks as persistent or non-persistent. Unlike the instruction cache analysis, determining the set of data memory blocks accessed at a program point, can be challenging. Existing address analysis techniques such as the one used in [13] can be used to obtain the set of memory blocks, which may be accessed at a given program point. Once the SCP analysis has been performed on the set of memory blocks generated by address analysis, the assertions can be generated as described in preceding paragraphs.
for (i=0; i<10; i++) {
sum += Array_X[i] + Array_Y[i];
//Array_X points to m1, m2 //Array_Y points to m3, m4 //m1, m3 are accessed for 0 <= i < 5 //m2, m4 are accessed for 5 <= i < 10
}
for (i=0; i<10; i++) { if(i >= 0 && i < 5) assert(C_m1 ≤ 0 V C_m3 ≤ 0) if(i >= 5 && i < 10) assert(C_m2 ≤ 0 V C_m4 ≤ 0) sum += Array_X[i] + Array_Y[i]; }
(a) Original Code (b) Instrumented Code
Fig. 6: Instrumentation scenarios for data caches
The basic structure for instrumentation is similar to what was described for instruction caches. However, unlike an instruction access, a data access may correspond to multiple memory blocks. For example, in Figure 6, access to Array X might result in fetching of memory blockm1orm2, depend-ing upon the loop iteration. Likewise, access to Array Y might result in fetching of memory blockm3 orm4.
Assume that the address analysis has reported that the memory blocks m1 and m3 are accessed for loop iterations i ∈ [0..4] and memory blocks m2 and m4 are accessed for loop iterations i ∈ [5..9]. Also assume that the only sets of memory blocks which conflict in the cache are {m1,m3}
and {m2,m4}. Under these assumptions, memory block m1
and m3 can participate in a thrashing scenario, only during loop iterations [0..4]. Therefore, the instrumented code for
m1 and m3 needs to be proceeded by conditional checks on the iteration number (i >= 0 && i < 5). Conditional checks for memory block m2 and m4 can be placed in a similar fashion. Figure 6(b) shows the instrumented code for the example program shown in Figure 6(a).
B. Dynamic test generation
Dynamic test generation tries to find violations of the instrumented assertions (cf. Section III-A). Our dynamic test generation process is inspired by recent advances inconstraint solvingandconcolictesting [12]. As an output of the dynamic test generation process, we obtain a pair hΘi,Ψii for each
cache thrashing scenarioΘi. In the output pair,Ψi captures a
symbolic formula on the input variables, such that any input satisfying the formula leads to the cache thrashing scenario
Θi. In our example (cf. Figure 2), one such output would be
h{m1, m2}, x≤3∧x≥1i. This implies that any input value of x ∈ [1,3], would lead to a thrashing scenario, involving memory blocksm1 andm2.
Algorithm 1: The primary goal of Algorithm 1 is to check the validity of instrumented assertions (cf. Section III-A). It takes the instrumented programPAand the set of instrumented assertionsAas inputs and generates a set of test casesT. Each element in T realizes a unique cache thrashing scenario. To begin with, Algorithm 1 executes the instrumented program
PAwith a random inputI and collects the execution traceX. The exploration of different assertions is performed by sys-tematically manipulating thepath conditionof this execution trace. Formally,path conditionis defined as follows.
Definition 3.2: For a particular execution trace X, path condition is a quantifier free first order logic formula that captures exactly the set of inputs which drives the program execution through the execution traceX.
For example, in Figure 2(c), the symbolic formulax≤3 ∧ x≥1 ∧y≤10captures thepath conditionfor the execution trace on input valuesx= 3 andy= 0.
The variable unchecked represents the set of unexplored partial path conditions in the instrumented programPA. Each partial path condition ϕi is associated with a metric Fϕi.
This metric measures the maximum number of non-violated assertions reachable from ϕi. We employ a greedy strategy
based on the value of Fϕi to continue exploration. More
precisely, we generate a test input τθ from an unexplored,
partial path conditionϕithat has the maximum value forFϕi.
Subsequently, we invoke the procedure ExecuteAndReport with inputτθ.
Procedure ExecuteAndReport executes the instrumented program PA for an input τ to obtain the execution trace
X. For a particular execution, assume that ϕ ≡ ψ1∧ψ2 ∧
. . .∧ψk−1∧ψk captures the path condition for the execution
trace X. Further assume that {Aθ1,Aθ2, . . . ,Aθr} is the set
of violated assertions and π is the shortest path-prefix in the X which captures at least one violation of each asser-tion in the set {Aθ1,Aθ2, . . . ,Aθr}. Therefore, an assertion,
if violated beyond path-prefix π, must belong to the set
{Aθ1,Aθ2, . . . ,Aθr}. If ϕ is the respective path condition,
say ϕˆ be the prefix of the path condition corresponding to path-prefixπ. Note thatϕϕˆ, however, ϕˆ is a compact yet losslessformula to manifest the set of thrashing scenarios (i.e. the set of thrashing scenarios exposed by violations of the set of assertions {Aθ1,Aθ2, . . . ,Aθr}). Therefore, for each
Algorithm 1 Dynamic exploration of instrumented assertions
1: Input:
2: PA: instrumented program with assertions 3: A: set of instrumented assertions
4: Output:
5: T: a set of test cases, each of which realizes a unique cache thrashing scenario
6: AllPathConditions=unchecked=T =empty
7: /*build the control dependency graph (CDG) ofPA*/
8: CDGP
A ←BuildCDG(PA)
9: select a random inputI
10: ExecuteAndReport(PA,A,I,CDGP
A)
11: whileunchecked6=empty∧ A 6=NULLdo
12: /*pick a partial path with maximum number
13: of reachable and non-violated assertions */
14: select hϕ,Fϕi ∈unchecked with maximumFϕ 15: unchecked :=unchecked\ {hϕ,Fϕi}
16: letϕ←ψ1∧ψ2∧. . .∧ψr−1∧ψr
17: /*execute an unexplored path */
18: if ϕis satisfiablethen
19: τϕ←some concrete inputs satisfyingϕ 20: ExecuteAndReport(PA,A,τϕ,CDGPA)
21: end if
22: end while
23: procedureEXECUTEANDREPORT(PA,A,τ,CDGP
A)
24: executePA on inputτ
25: letX be the execution trace on inputτ
26: letϕ≡ψ1∧ψ2∧. . .∧ψk be the path condition
27: let{Aθ1,Aθ2, . . . ,Aθr}be the set of violated
28: assertions, on inputτ
29: A= A \ {Aθ1,Aθ2, . . . ,Aθr}
30: letπ be theshortestpath-prefix along the execution 31: trace Xthat captures at least one violation of each 32: assertion in the set {Aθ1,Aθ2, . . . ,Aθr}
33: letϕˆcaptures the partial path condition corresponding 34: to the path-prefixπ
35: /*augment the test suite with witnesses for cache
36: thrashing scenarios */
37: T S
={hθ1,ϕˆi,hθ2,ϕˆi, . . . ,hθr,ϕˆi}
38: /*build all partial path conditions */
39: fori←1, k do
40: letϕi←ψ1∧ψ2∧. . .∧ψi−1∧ ¬ψi
41: ifϕi∈/AllPathConditions then
42: AllPathConditionsS=ϕ
i
43: letbend be the control dependency edge in
44: CDGP
A w.r.t. the branch condition¬ψi
45: /*compute the number of non-violated
46: assertions (∈ A) reachable frombend*/
47: Fϕi :=GuidanceFunction(bend) 48: if Fϕi 6= 0then 49: uncheckedS={hϕi,Fϕii} 50: end if 51: end if 52: end for 53: end procedure
thrashing scenario θi, we construct a test pair hϕ, θˆ ii and
add such test pairs to the existing test suite T. To avoid any redundant computation, we manipulateϕˆon-the-flyduring the execution.
To continue exploration, we must deviate from the present path. Such a deviation is performed by negating a branch conditions along the execution traceX. Assume that we pick a partial path conditionϕi ≡ψ1∧ψ2∧. . .∧ψi−1∧ ¬ψi. Let
us also assume thatbendis the control dependency edge in the
CDG (of the instrumented program) that captures the negated branch condition ¬ψi. We rank each partial path condition
ϕi with a metric Fϕi and add it to the set of unchecked
partial path conditions.Fϕi captures themaximumnumber of
assertions inAthat are reachable, if the program is executed with a test input satisfyingϕi.
GuidanceFunction captures the computation of Fϕi.
For-mally,Fϕi is defined as follows.
Fϕi =|{Aθ∈ A | bend Aθ}| (5)
Where bend Aθcaptures that the assertionAθis reachable
from the control dependency edge bend (i.e. the control
de-pendency edge corresponding to the negated branch condition
ψi). Therefore,Fϕiaccounts for all the assertions inAthat are
reachable frombend. It is worthwhile to note that the definition
ofFϕi (in Equation 5) can be changed very easily depending
on the criticality of different assertions. In Equation 5, we have only considered the reachability of assertions, giving each assertion equal priority. However, the definition Fϕi can be
easily changed to incorporate other priorities (e.g.assertions in an innermost loop can be given higher priorities than assertions in an outermost loop).
Termination: Algorithm 1 terminates as soon as we ob-tain a witness (i.e.test case) for each cache thrashing scenario (captured by the conditionA 6=NULLin the outermost loop of Algorithm 1). However, some thrashing scenarios might not be manifested due to the presence ofinfeasible pathsin a program (e.g.the assertionassert(C m3≤0∨C m4≤0)in Figure 2(c)). In such cases, the test generation process may go on forever in the presence of unbounded (e.g. input-dependent) loop iterations and due to the inherent incompleteness of any constraint solver. However, one appealing nature of our test generation process is that it can be terminated anytime. The resulting test-suite might be incomplete, but it can still be used for investigating cache performance issues in the program. Our experiments suggest that we can find most of the cache performance stressing test inputs in very early phase of Algorithm 1. This is primarily due to the directed search strategy along the control dependency chain (via the CDG) to reach the set of instrumented assertions.
C. Salient features of generated test suites
Our generated suite has several important properties. In the following description, we shall formally capture the properties of the generated test suite.
Property 3.1: At any point in time during the execution of Algorithm 1, for any cache thrashing scenarioΘi, if no path
witnessing Θi has been explored - no test case containing
Θi appears in the test-suiteTcomputed so far. Otherwise, the entryhΘi,Ψiiappears in the test-suiteT whereΨi captures the set of all inputs which witnessΘi, and whose paths have been explored already by Algorithm 1.
Property 3.2: If Algorithm 1 terminates, we can guarantee to find all feasible cache thrashing scenarios in any unin-terrupted execution, that is, all cache thrashing scenarios witnessed by at least one program input. Each such feasible cache thrashing scenario will appear as an entry hΘi,Ψiiin the generated test suite T reported at the end of Algorithm 1. Any solution for the formula Ψi is a test input witnessing cache thrashing scenarioΘi.
IV. EVALUATION A. Experimental Set-up
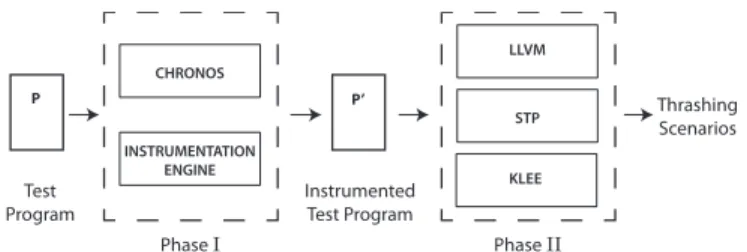
Figure 7 shows an outline of our implementation framework. To generate cache hit-miss classifications (CHMC), we use the abstract interpretation (AI) based cache analyses (using [18] for instruction caches and using [13] for data caches) implemented in Chronos [11]. Outcomes of AI-based cache analyses are used by the instrumentation engine to compute thrashing sets and to insert assertions at appropriate program points (as explained in Section III-A). This instrumented program is passed to the dynamic test generation process.
Dynamic test generation process is implemented on top of LLVM compiler infrastructure [2]. The instrumented program is compiled into LLVM bitcode format and its control flow graph (CFG) is extracted from the LLVM bitcode. We also implement a module inside LLVM to compute the control dependency graph (CDG) of a given program. This CDG is used to guide our test generation, as explained in Algorithm 1. To generate path conditions for different execution traces, we use KLEE symbolic execution engine [1]. To solve and manipulate path conditions along an execution trace, we use the STP constraint solver [3].
We have performed all the experiments on a machine having an Intel Core-i5 processor, with 4 GB RAM and running Ubuntu 9.04 OS. Test Program Instrumented Test Program Phase I Phase II Thrashing Scenarios CHRONOS INSTRUMENTATION ENGINE LLVM STP P’ KLEE P
Fig. 7: Key phases in the framework
Subject Programs: Table I shows the subject programs, used in our experiments. Nsichneu[4] is an automatically generated code, which simulates an extended Petri Net. It was taken from the M¨alardalen WCET benchmarks suite. It has a code size much larger than other programs used in our experiments. Also it contains a large amount of if-statements. Papabench[16] is an Unmanned Aerial Vehicle
(UAV) control application. In our experiments, we used the auto-navigation utility from papabench. The auto-navigation utility contains a lot of input dependent paths, therefore it can potentially show different thrashing scenarios for different symbolic input formulas. Jetbench[17] is a real-time, Jet engine performance calculator. It uses Jet engine parameters and thermodynamic equations from the NASA’s EngineSim program to perform real-time thermodynamic calculations. We use a single-threaded version ofJetbenchfor our experiments.
S. No Test Program Lines of Code
1 Nsichneu 4253
2 Papabench 1097
3 Jetbench 770
TABLE I: Subject Programs
B. Experimental Results
In following paragraphs, we shall describe some of the experiments which were performed to measure the efficacy of our framework. Also we shall discuss the applications of our framework for answering some of the issues related to design space exploration and performance optimization.
Efficacy of our framework, in exposing cache
per-formance issues: We performed experiments with the three
real-time programs listed in Table I. The results of which are discussed subsequently. But first we shall describe a few metrics which are used to present the experimental results.
Assertion Coverage: Our framework aims to find all thrash-ing scenarios due to intra-task cache conflicts. However, our test generation framework may not terminate (in general, this problem is undecidable [12]). Therefore, we define a metric namedAssertion coverage which measures the percentage of unique assertion checked, within a given amount of time.
Assertion Coverage = unique assertion checked
unique assertion instrumented×100 A 100% assertion coverage implies that all unique assertions have been checked at least once.
Thrashing Potential: It is not necessary that all the checked assertion will be violated. However, the number of unique assertions violated, tells us about the potential for cache thrashing, for a program, on a given cache-configuration. Therefore, we defineThrashing Potential as follows
Thrashing Potential = unique assertion violated
unique assertion instrumented×100 Through our experiments we investigated the assertion cov-erage and the thrashing potential for all the program listed in Table I, for various cache-configurations. Some of the results from our experiments are shown in Figure 8. The plots in Figure 8 show the assertion coverage ( and thrashing potential) on the y-axis and the exploration time on the x-axis. Since our framework looks for all possible thrashing scenarios due to intra-task cache conflicts, it is possible that the test generation will not terminate (refer to section III-B). Therefore, we tested
0 20 40 60 80 100 0 50 100 150 200 250 300
Assertion Coverage (Cache 8KB) Thrashing Potential (Cache 8KB) Assertion Coverage (Cache 16KB) Thrashing Potential (Cache 16KB)
Percentage
Time (seconds)
(a) nsichneu (Instruction Cache)
0 20 40 60 80 100 0 50 100 150 200 250 300
Assertion Coverage (Cache 2KB) Thrashing Potential (Cache 2KB) Assertion Coverage (Cache 4KB) Thrashing Potential (Cache 4KB)
Percentage
Time (seconds)
(b) papabench (Instruction Cache)
0 20 40 60 80 100 0 50 100 150 200 250 300
Assertion Coverage (Cache 2KB) Thrashing Potential (Cache 2KB) Assertion Coverage (Cache 4KB) Thrashing Potential (Cache 4KB)
Percentage
Time (seconds)
(c) jetbench (Instruction Cache)
0 20 40 60 80 100 0 5 10 15 20 25 30 35 40
Assertion Coverage (Cache 512B) Thrashing Potential (Cache 512B) Assertion Coverage (Cache 1KB) Thrashing Potential (Cache 1KB)
Percentage
Time (seconds)
(d) nsichneu (Data Cache)
0 20 40 60 80 100 0 5 10 15 20 25 30 35 40
Assertion Coverage (Cache 512B) Thrashing Potential (Cache 512B) Assertion Coverage (Cache 1KB) Thrashing Potential (Cache 1KB)
Percentage
Time (seconds)
(e) papabench (Data Cache)
0 20 40 60 80 100 0 20 40 60 80 100 120
Assertion Coverage (Cache 512B) Thrashing Potential (Cache 512B) Assertion Coverage (Cache 1KB) Thrashing Potential (Cache 1KB)
Percentage
Time (seconds)
(f) jetbench (Data Cache) Fig. 8: Assertion Coverage and Thrashing Potential for different cache configurations the subject programs, with an exploration budget of 5 minutes.
We performed the experiments for instruction caches as well as data caches. Overall, we observed an assertion coverage ranging from 53% to 100% for different experimental set-ups (within a exploration budget of 5 minutes). Essentially, programs which had lesser number of input dependent paths (such as nsichneu) were explored much faster than program which had more number of input dependent paths (such as papabench). We also observed that for most of the experiments with instruction caches, only a small fraction of instrumented assertion were actually violated.
The figures presented in the first row ( Fig. 8 (a), (b) and (c)) show the results, for instruction caches. On one hand, our chosen cache sizes are sufficient to avoidcapacity misses. On the other hand, cache sizes are also small enough to generate conflict misses. Sincensichneuhas a large code within a loop, we choose a relatively bigger cache for nsichneu, compared to the other two subject programs. Figure 8(a) shows the percentage coverage fornsichneu, on a 2-way, set-associative, LRU, instruction cache. The results reported here are for cache configuration of 8 KB and 16 KB. For both the configuration, the framework achieved a 100% assertion coverage, in less than 5 minutes. The thrashing potential for nsichneu, was observed to be less than 31% for both the experiments. Note that since the framework achieved a 100%assertion coverage for nsichneu, therefore the recorded thrashing potential is accurate. We performed experiments with papabench and Jetbench on a 2 KB and 4 KB for 2-way, set-associative, LRU cache. Neither of these experiments, resulted in a 100% assertion coverage, within the exploration budget of 5 min-utes. However, this doesn’t imply that the greedy exploration
strategy is inefficient. This observation is supported by the fact that most of the explored assertions in Figure 8 were discovered early in the exploration. Additionally, some of the instrumented assertions may be present along infeasible paths (such asx= 0∧x= 1), therefore they might not be checked throughout the exploration.
Figure 8 (d), (e) and (f) show the analysis results for data caches. For all the experimental results reported in this para-graph we used a direct-mapped, data caches of size of 1KB and 512B. We used small caches for this set of experiments, so as to create sufficient number of thrashing scenarios. Fornsichneu and Jetbench we observed an assertion coverage of almost 100%. In fact, fornsichneuonly one cache thrashing scenario was reported for both the cache configurations, which was covered (and violated) during exploration. Also, forJetbench (see Figure 8(f)) most of the checked assertions were violated during exploration. However, forpapabench(see Figure 8(e)), we observed an assertion coverage of 80% and a thrashing potential of less than40%, for both the cache-configurations.
Applications of our framework for design space
explo-ration: The process of embedded system design can be quite
challenging due to sheer size of the design space that needs to be explored. While choosing a design for an embedded application, the designer has to consider various constraints such as timing and energy consumption. For instance, while choosing a cache-configuration, a designer can choose from a large, highly-associative cache or smaller, less-associative cache. A large, highly-associative cache might have lesser number of cache-thrashing scenarios however it will consume more power and possibly slower than the smaller cache. There-fore, determining the ideal cache size for a given application
might be tricky. Our framework can provide a suitable way to choose the appropriate cache configuration for an application.
0 100 200 300 400 500 2KB
1-Way 2KB 2-Way 4KB 2-Way 8KB 2-Way 8KB 4-Way
# Thrasi ng S cenari o s U nco vered
Fig. 9: Number of cache thrashing scenarios discovered for papabench, for various cache configurations
Essentially, our framework can be used to compare the number of thrashing scenarios for different cache configura-tions, for a given application. For example Figure 9 shows the number of thrashing scenarios discovered for different cache configurations, forpapabench. It is worthwhile to note that our framework pinpoints the real thrashing scenarios, witnessed by a feasible execution. Existing techniques, which are purely based on static analysis (e.g. [18], [13]) may include false thrashing scenarios that never appear in any execution (cf. Figure 8). As a result, we can choose a more appropriate cache configuration using our framework, compared to the techniques based purely on static analysis.
In Figure 9, it might be interesting to know that a 2KB, 1-way (direct-mapped) cache has lesser number of cache thrash-ing scenarios then a 2KB, 2-way set-associative cache. Also, the experiments suggest that the number of cache thrashing scenarios for a 8KB, 2-way set-associative cache and a 8KB, 4-way set-associative cache are the same. So for this program, a 8KB, 2-way set-associative cache will be sufficient, to avoid cache-thrashing.
Applications of our framework for performance
opti-mization: In this section, we shall discuss the application of
our framework for input sensitive optimization, specifically for cache locking. The main intuition is explained via Figure 10(a). Assume a direct-mapped cache and memory blocksm1,
m2,m3 andm4 all map to the same cache set. Clearly, this would result in a cache-thrashing scenario (for thrashing sets
{m1, m2}and{m3, m4}) and our test generation framework computes the following test cases: h{m1, m2}, z ≤ 5i and
h{m3, m4}, z > 5i. In a way, therefore, our dynamic test
generation framework can also be viewed as partitioning the input domain, where all inputs constituting a partition realizes the same set of cache thrashing scenarios. In our example, there are two such partitions - ∆1 and∆2 (cf. Fig.10(b)).
Assume that we want to selectively lock memory blocks so that such memory blocks are never evicted from the cache. Traditional cache locking techniques, such as [15] can be used for such purposes. The work in [15] requires a memory trace (sequence of memory blocks) to determine the set of memory blocks that should be locked in the cache. However, a program might have different memory traces for different sets of inputs. If we use a memory trace generated for an input I1 ∈ ∆1,
// input z # _Lock(m1) while(iteration < 100){ if(z ≤ 5) { // access m1 // access m2 } else { // access m3 // access m4 } // input z # if (z ≤ 5) _Lock (m1) # else _Lock (m3) while(iteration < 100){ if(z ≤ 5) { // access m1 // access m2 } else { // access m3 // access m4 } z > 5 z ≤ 5 Partition ∆ Partition ∆ I 3 2 1 I1 I 2 (a) (b) (c) } }
Fig. 10: Illustration of conditional cache locking (a) Program with unconditional cache locking (lock instructions are pre-ceded by # ) (b) Input partitions (c) Conditional cache locking
eitherm1orm2will be locked in the cache (as shown in Fig 10(a)). However, it can be observed that when the program is executed for any inputI2∈∆2, lockingm1orm2(as shown
in 10(a)) will not improve the cache performance. This is due to the fact thatm3andm4 will encountercache thrashing.
Based on the discussion in the preceding paragraph, we argue the potential of performance optimization (e.g. cache locking) techniques that is sensitive to inputs. In particular, for cache locking optimization in Figure 10, we could lock
m1 (or m2) for all inputs satisfying z ≤ 5 and lock m3
(or m4) for all inputs satisfying z > 5. Such a conditional cache locking (as shown in Figure 10(c)), will improve the program performance for both the input partitions∆1and∆2
(cf. Figure 10(b)).
To validate our argument, we have studied the feasibility of conditional cache locking technique on the subject program nsichneu. For baseline cache locking optimization, we use [15], that locks a set of memory blocks from a given memory trace. We conduct several experiments for two arbitrary inputs
I1 andI2; whereI1is used to generate a memory trace based
on which we decide which memory blocks to lock in the cache, using the technique of [15], and I2 is used to run nsichneuafter the cache locking optimization is performed for the memory trace on inputI1. We have made the following
crucial observations.
• If I1 and I2 belong to the same input partition
pro-duced by our framework, the performance improvement from cache locking observed in nsichneu is significantly greater than the situation where I1 and I2 belong to
different input partitions. These results seem to motivate the use of conditional locking instructions.
• For the situation where I1 and I2 belong to the same
partition, we also observed the performance improvement from locking varies across input partitions. On average, we observed a variation from ∼10% to 20% in perfor-mance improvement across different input partitions in nsichneu. Note that inputs from different partitions have different memory traces and so, they lead to different set of locked memory blocks using [15].
The preceding observations motivate the need for condi-tional cache locking, which can be studied at length in the future. Specifically, our observations conclude that memory
blocks should be locked differently across different input partitions computed by our framework.
V. RELATED WORK
Over the past two decades, a significant research effort has been put forward for the performance validation of embedded software. Such efforts include abstract interpretation (AI) based method, such as [18], which was proposed to analyze the cache behaviour of a program. Our previous work [9] improves the precision of such AI-based cache analyses via a gradual and controlled use of model checking. These works [18], [9] analyze the cache behaviour of a program irrespective of its inputs. On the contrary, our primary goal is to build a connection between the set of inputs and anomalous cache behaviours (e.g.cache thrashing). Our test generation method-ology is inspired by the recent advances in constraint solving and concolic testing [12], [7]. These works aim to detect software functionality bugs. In contrast, we aim to detect software performance problems due to memory subsystems.
Different techniques used for program profiling [5], [14] also aim to find performance problems in a program. Such pro-filing techniques work on full or compressed execution traces to derive useful information about program performance. It is assumed that the relevant inputs for obtaining an execution trace are known a priori. Our approach is complementary to these profiling techniques, as our aim is to systematically find test inputs that lead to poor cache performance. Once such test inputs are found, they can be fed back to a traditional profiler for further analysis.
Recent advances in profiling [19], [10] have extended the traditional profiling technique to compute aperformance trend of a program. Such a performance trend is captured by an approximate cost function. The cost function relates program inputs with the overall cost of the program. However, such cost functions are approximations and they do not necessarily capture the actual cost. Besides, these works do not introduce any notion of test coverage. On the contrary, any cache thrashing scenario reported by our framework is indeed a cache thrashing scenario, witnessed by a concrete input. Besides, our framework also reports the coverage of cache thrashing scenarios via the set of dynamically checked assertions.
The work proposed in [6] automatically finds test inputs for the worst-case computational complexity. Our work differs from [6] on several aspects: first, our notion of performance is based on the execution time rather than computational complexity. Secondly, the primary goal of our work is to compute test inputs for all possible anomalous cache behaviour in a single program.
A recent work [8] uses constraint-based test generation [12], [7] to partition the input domain of a program with respect to cache performance. Once all the partitions are computed, some manual interventions are required to locate the set of program locations that may exhibit issues related to cache performance. Besides, the work proposed in [8] computes a cache perfor-mance range for each partition. The cache perforperfor-mance range in [8] is computed via static invariant generation methods.
As a result, the computed cache-performance range might be over-approximated, leading to false positives. Our approach, on the contrary, directly relates a cache thrashing scenario with the set of inputs (without any manual intervention). Moreover, since we generate test inputs based on dynamic analysis, our generated test-suite does not contain anyfalse positives.
VI. CONCLUSION
In this paper, we have proposed a test generation framework that stresses the cache performance of a program. The key novelty in our work is a systematic combination of static cache analysis and dynamic test generation via a set of instrumented assertions. Violation of any such assertion exposes a unique cache performance issue, specifically, a cache thrashing sce-nario in the program. As an output, our framework reports a test-suite where each test case in the test-suite points to a unique cache thrashing scenario along with a set of program inputs that leads to the same. Due to the use of dynamic test generation, our generated test-suite does not contain any spurious test cases. We have shown the application of our test generation framework in design space exploration and in cache performance optimization via cache locking.
ACKNOWLEDGEMENT
This work was partially supported by A*STAR Public Sec-tor Funding Project Number 1121202007 - “Scalable Timing Analysis Methods for Embedded Software”.
REFERENCES
[1] KLEE symbolic virtual machine. http://klee.llvm.org/. [2] LLVM compiler infrastructure. http://llvm.org/.
[3] STP constraint solver. https://sites.google.com/site/stpfastprover/. [4] WCET benchmarks. http://www.mrtc.mdh.se/projects/wcet/benchmarks.
html.
[5] T. Ball and J. R. Larus. Efficient path profiling. InMICRO, 1996. [6] J. Burnim, S. Juvekar, and K. Sen. WISE: Automated test generation
for worst-case complexity. InICSE, 2009.
[7] C. Cadar, D. Dunbar, and D. R. Engler. KLEE: Unassisted and automatic generation of high-coverage tests for complex systems programs. In
OSDI, 2008.
[8] S. Chattopadhyay, L. K. Chong, and A. Roychoudhury. Program performance spectrum. InLCTES, 2013.
[9] S. Chattopadhyay and A. Roychoudhury. Scalable and precise refine-ment of cache timing analysis via path-sensitive verification.Real-Time
Systems, 2013.
[10] E. Coppa, C. Demetrescu, and I. Finocchi. Input-sensitive profiling. In
PLDI, 2012.
[11] X. Li et al. Chronos: A timing analyzer for embedded software.
Science of Computer Programming, 2007. http://www.comp.nus.edu.
sg/∼rpembed/chronos.
[12] P. Godefroid, N. Klarlund, and K. Sen. DART: directed automated random testing. InPLDI, 2005.
[13] B. K. Huynh, L. Ju, and A. Roychoudhury. Scope-aware data cache analysis for WCET estimation. InRTAS, 2011.
[14] J. R. Larus. Whole program paths. InPLDI, 1999.
[15] Y. Liang and T. Mitra. Instruction cache locking using temporal reuse profile. DAC, 2010.
[16] F. Nemer, H. Cass´e, and P. Sainrat. Papabench: a free real-time benchmark. WCET Workshop, 2006.
[17] M. Qadri, D. Matichard, and K. M. Maier. JetBench: an open source real-time multiprocessor benchmark. ARCS, 2010.
[18] H. Theiling, C. Ferdinand, and R. Wilhelm. Fast and precise WCET prediction by separated cache and path analyses. Real-Time Systems, 18(2/3), 2000.