This item was submitted to Loughborough's Research Repository by the author.
Items in Figshare are protected by copyright, with all rights reserved, unless otherwise indicated.
Vehicle-to-grid feasibility: A techno-economic analysis of EV-based energy
Vehicle-to-grid feasibility: A techno-economic analysis of EV-based energy
storage
storage
PLEASE CITE THE PUBLISHED VERSION http://dx.doi.org/10.1016/j.apenergy.2017.01.102 PUBLISHER © Elsevier VERSION AM (Accepted Manuscript) PUBLISHER STATEMENT
This work is made available according to the conditions of the Creative Commons Attribution-NonCommercial-NoDerivatives 4.0 International (CC BY-NC-ND 4.0) licence. Full details of this licence are available at:
https://creativecommons.org/licenses/by-nc-nd/4.0/ LICENCE
CC BY-NC-ND 4.0 REPOSITORY RECORD
Gough, Rebecca, Charles E. Dickerson, Paul Rowley, and Chris Walsh. 2019. “Vehicle-to-grid Feasibility: A Techno-economic Analysis of Ev-based Energy Storage”. figshare. https://hdl.handle.net/2134/24630.
1
Vehicle-to-Grid Feasibility: A Techno-economic Analysis of EV-based Energy
Storage
Rebecca Gough*⁺1, Charles Dickerson†, Paul Rowley† and Chris Walsh⁺
⁺Cenex - The Centre of Excellence for Low Carbon and Fuel Cell Technologies, Loughborough, UK
*Corresponding Author: [email protected]
†The Wolfson School of Mechanical, Electrical and Manufacturing Engineering, Loughborough University,
Loughborough, UK
Abstract:
The potential for electric vehicles to obtain income from energy supplied to a commercial building together with revenue accruing from specific ancillary service markets in the UK is evaluated in this work. A hybrid time-series/probabilistic simulation environment using real-world data is described, which is applied in the analysis of electricity trading with vehicle-to-grid to vehicles, buildings and markets. Key parameters are found to be the electric vehicle electricity sale price, battery degradation cost and infrastructure costs. Three vehicle-to-grid scenarios are evaluated using pool vehicle trip data, market pricing index data and half-hourly electricity demand for a commercial building. Results show that provision of energy to the wholesale electricity market with additional income from the capacity market results in the greatest projected return on investment, producing an individual vehicle net present value of ~£8,400. This is over 10 years for a vehicle supplying energy three times per week to the half-hour day-ahead market and includes the cost of installing the vehicle-to-grid infrastructure. The analysis also shows that net income generation is strongly dependent upon battery degradation costs associated with vehicle-to-grid cycling.
Key Words:Vehicle-to-Grid, Electric Vehicles, Energy Scenarios, Economic Analysis Environment Abbreviations
CM Capacity Market
DSM Demand Side Management DUoS Distribution Use of System EV Electric vehicle
ICE Internal Combustion Engine MSP Manchester Science Park NG National Grid
PiM Plugged-in Midlands PS Pumped Hydro Storage PV Photovoltaic
SoC State of Charge TOUT Time of Use Tariff UK United Kingdom V2G Vehicle to Grid VPP Virtual Power Plant
1 Corresponding Author Present Address:
Cenex - The Centre of Excellence for Low Carbon and Fuel Cell Technologies, Loughborough, UK Email Address: [email protected]
2 1. Introduction
In common with many other nations, the transition to a future energy system largely based on low or zero-carbon electricity for services such as heating and transport, is predicted to result in significant risks in terms of energy security of supply and cost for the UK [1]. In this context, electric Vehicles (EVs) are projected to contribute up to 60% of total new car sales in the UK by 2030 [2], thus creating significant extra demand on electricity networks, including during peak demand hours. One potential opportunity to manage increasing electricity costs and demand spikes is the utilisation of EVs to act as an aggregated energy store, providing peak shaving or demand shifting to both local buildings and to the power system when demand is high. This is facilitated through vehicle-to-grid (V2G) technology, which allows energy to flow both to and from the vehicle, facilitated by a bi-directional power converter. In recent years, an increase in the number of V2G systems in Japan occurred as a result of grid insecurity after the Fukushima disaster in 2011 [3–5]. As such, V2G can help provide a means of powering buildings from a portable battery store, which can be re-charged at a different location on a regular basis [5]. Such concerns are of lesser relevance in the UK however, where research indicates V2G uptake will predominantly be related to system economics and CO2 emissions as opposed to grid security [6–
10].
Management of fixed (as opposed to mobile) storage assets is relatively straightforward. However, EVs inject additional complex considerations in comparison to static systems, such as vehicle usage, journey requirements and location. One solution to the management of these disparate assets is through aggregation services, a relatively well-established industry in the UK, with commercial service providers aggregating small generation assets to address a range of balancing services [11]. Current aggregation of assets includes generators and uninterruptible power supplies being used to reduce peaks in electrical demand [12]. The term “Virtual Power Plant (VPP)” is used to describe geographically dispersed generation and storage assets being exploited via web services, designed to provide connection and control for all distributed energy resources available to the VPP operator [13]. This allows greater opportunity for trading within the wholesale energy, capacity and ancillary markets with generators that would otherwise be too small and dispersed to have any significant impact [14]. Aggregators also dictate where the energy available within the vehicles should be used, for building self-consumption or exported for markets. It is this management system that facilitates the possibility of energy use for multiple activities.
Crucial to the implementation of EVs as battery storage assets is the evaluation of UK energy markets suitable for aggregated EV storage assets. There are several markets that are potentially appropriate, including reserve services such as Short Term Operating Reserve (STOR), wholesale day-ahead market and the capacity market, with STOR requirements specifying the minimum generation limit at 3MW [15]. Being a pre-contracted balancing service, the provider delivers to a contracted level of power when instructed to do so by the System Operator [15]. Another market potentially suitable for V2G buy-in is the Capacity Market. This enables National Grid to buy energy capacity buy-in advance, ahead of delivery to guarantee investment in developing generation [16]. A limit of 2MW de-Minimis has been set, under which any generation must be taken into an aggregation service [17]. The bidding and delivery requirements are set by National Grid for each individual participant in the Capacity Market depending upon their availability and National Grid requirements [17]. Thus, uptake through the Capacity Market means that battery storage for arbitrage is more feasible than has been the case in previous years.
In contrast, for the case of provision of electricity to buildings, the nature of the procurement and billing arrangements employed by the building owner or tenants is significant. Commercial buildings operate under several standard payment types including fixed rate tariffs, Time of Use Tariff (TOUT) and Triads. TOUT presents an opportunity for EVs to supply energy directly to the building during peak demand times when tariffs are highest, whilst triads avoidance (the three half hours in the year with the highest national demand [18,19]) offers another opportunity. This billing system enables large consumers to pay
3
a lower fixed price for their electricity via the wholesale market [20]. Through using EVs to supply energy to a building, the energy consumed during these triad periods can be reduced, therefore reducing the energy bill of the commercial consumer during these high cost periods. As billing occurs post triad occurrence, consumers often employ a triad forecasting service that allows them to estimate when the triad period may occur and therefore respond accordingly.
Research suggests there is potential for V2G trading in electricity markets. However the relationship between vehicle use, building demand and market requirements is relatively unknown [21][22]. There is little known about the potential of aggregation of EVs for supply into STOR, the capacity market or local demand self-consumption. Utilisation of EVs for storage of excess PV generation to re-distribute into buildings during periods of high demand or high cost, such as TOUT or triad periods, also presents possibilities. Again, relevant research is sparse and little is known as to the impact electricity pricing will have on V2G suitability for the UK market.
This research paper evaluates the potential income generation from V2G services for three different V2G scenarios; building self-consumption and provision to two different markets – STOR and the Wholesale market. The overall aim is to identify key scenarios where income can be generated through the sale of electricity from EV batteries, either to buildings or to external markets. This is made possible through development of a data-driven Monte Carlo based modelling methodology. The modelling approach taken allows for multiple scenarios to be reviewed using real-world data input.
2. Methodology
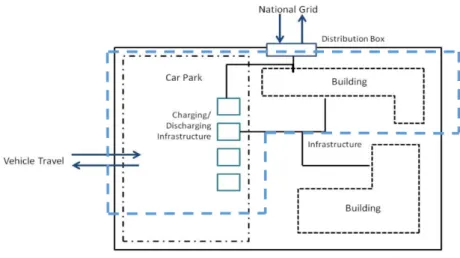
This research uses a data-driven Monte Carlo-based analysis to evaluate the economic potential of EVs with V2G technology providing building energy and network support services. The modelling methodology builds upon probabilistic and stochastic methods previously carried out [23–25] along with agent-based modelling [26,27], system dynamics approaches [28,29], linear and non-linear programming [30] and stochastic modelling [31,32]. Of note in the present work is its simulated and empirical data-driven approach, which utilises vehicle usage data, building demand, renewable energy generation and ancillary market data to simulate the economic potential of EVs with V2G. The system of interest is illustrated in Figure 1 to demonstrate model data flows. This indicates how vehicles might operate in practice and the key elements of a V2G enabled energy scenario.
4
2.1 Scenario Analysis
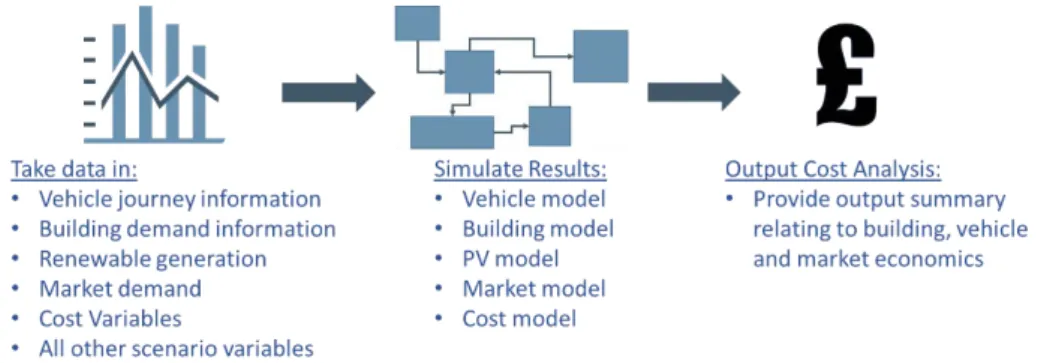
The modelling approach allows simulation of multiple vehicles within several pre-defined V2G energy and network support scenarios. All variables are pre-defined prior to simulation, and various scenarios are selected to evaluate economic viability. Simulation outputs relate to building energy cost savings, vehicle-related income generation and battery degradation costs. A modelling process diagram is shown in Figure 2.
Figure 2 – Simple Software Process Diagram
All scenarios include building energy support together with specific ancillary electricity market supply and scenarios were designed in light of previous work [33], in which building energy supply and market provision to STOR and the wholesale electricity market were identified as key potential opportunities for V2G-enabled services. Specific scenarios are summarised in Table 1.
Table 1 – Energy scenario summary table
Energy Support Scenarios Scenario B1
Simulates peak shaving for a commercial building. A flat rate electricity tariff is assumed, along with the cost of re-charging the EV after use. Vehicles discharge at any time when they are available throughout the day and when the building is consuming electricity from the grid.
Scenario B2 Simulates time of use demand response. Two tariffs are specified, along with the time periods during which the tariffs operate. Vehicles discharge during the most expensive tariff period, and re-charge during the lower cost period. Scenario B3 Same as scenario B1, but vehicles charge from PV if there is an excess of PV generation at any time, which would have otherwise been exported to the grid. Scenario B4 Same as scenario B2, but vehicles charge from PV if there is an excess of PV generation at any time, which would have otherwise been exported to the grid. Scenario M1 Simulates vehicles supplying STOR services. Demand periods are simulated based on STOR call-out periods and tariffs. Scenario M2
Uses wholesale market pricing to identify where the maximum income generation could be achieved per vehicle. Simulated discharge during this period and then the income generated includes the capacity market with the wholesale market ½ hourly pricing index.
2.2 Monte Carlo Simulation
Vehicle availability for service provision is simulated using real-world field-trial data and a Monte Carlo simulation approach to derive arrival and departure times of the vehicle. This approach is based on previous work [34], and initially involves comparing the probability of a vehicles arrival or departure per time step against a randomly distributed variable using a transition probability matrix. Based on the simulated arrival time for the vehicle, the duration of a vehicle’s residence time at the V2G station is then simulated using an associated normal distribution curve for duration of stay derived from the field trial dataset. This process is repeated if multiple vehicle journeys throughout the day are specified.
5
2.3 Modelling Environment, Inputs and Implementation
2.3.1 Electric Vehicle Arrival State of Charge
The extent to which an EV can provide V2G services is dependent upon the amount of energy available within the battery. Therefore, simulation of the EV battery SoC upon its arrival and the energy required for departure is required to calculate the energy available for V2G service provision. Analysis of real-world data results in a normal distribution for journey distances travelled, which is used to sample arrival and departure times. The energy consumed for each journey is then calculated using the ARTEMIS (Assessment and Reliability of Transport Emission Models and Inventory Systems) drive cycle [35]. These are deemed representative of real-world drive cycles based on European driving behaviour and have been shown to be more accurate than other drive cycles previously developed [35]. Table 2 shows ARTEMIS Values for urban, road and motorway driving.
Table 2 – Calculated ARTEMIS drive cycle values (based on data from [36]) Drive Cycle Value (kWh/100km)
Urban 16.86
Road 13.05
Motorway 19.78
Depending on the specific drive cycle adopted (or the mean of the three for a combined drive cycle), these values are then used to calculate the energy consumed per journey (EJ) as per equation (1), where
AV is ARTEMIS value and JD is journey distance in km.
𝐸𝐸𝐽𝐽= 100 𝐴𝐴𝑉𝑉 𝑥𝑥𝐽𝐽𝐷𝐷
(1) The energy available for V2G services (EV2G) is then calculated using equations (2) - (4), where ABC is
arrival battery capacity, DBC is departure battery capacity, DEJ is the departure journey energy consumed
and BB is the minimum state of charge for the vehicle battery;
𝐴𝐴𝐵𝐵𝐵𝐵 = 100− 𝐸𝐸𝐽𝐽 (2) 𝐷𝐷𝐵𝐵𝐵𝐵 =𝐷𝐷𝐸𝐸𝐽𝐽+ (100 𝑥𝑥𝐵𝐵𝐵𝐵) (3) 𝐸𝐸𝑉𝑉2𝐺𝐺= 𝐴𝐴𝐵𝐵𝐵𝐵− 𝐷𝐷𝐵𝐵𝐵𝐵 (4) 2.3.2 Electric Vehicle Discharge
The energy available for V2G services per 30-minute time step (EAV) is related to the time and battery
energy available and the discharge (or charge) efficiency, as defined in equations (5) and (6) [37].
𝜂𝜂= 𝑂𝑂𝑂𝑂𝑂𝑂 − 𝑂𝑂𝑂𝑂𝑂𝑂𝑂𝑂
(5) [37] Where η is charge efficiency (%), OCV is open-circuit voltage and V is voltage.
The new state of charge (SoC) per half-hour time step is then calculated [37].
𝑆𝑆𝑆𝑆𝑂𝑂(𝑡𝑡) =𝑆𝑆𝑆𝑆𝑂𝑂(0)− 𝑂𝑂1
𝑏𝑏𝑏𝑏𝑏𝑏� 𝐼𝐼.𝑑𝑑𝑡𝑡
(6) [37] Where SoC is state of charge and Cbat is battery capacity.
6
The energy available per time step can then be calculated as a linear function of energy and time available. The same process is adopted to simulate charging of the battery.
2.3.3 Vehicle Income
Depending upon the scenario selected for evaluation and the number of vehicles simulated, the energy available per time step for V2G services is assumed as being either consumed within a building or exported to an external energy services market. The energy available from the vehicles is either subtracted from the real-world building demand or aggregated as energy available for market supply. The total daily income generated for the vehicle from either of these services (VI) includes the cost of
re-charging the battery after V2G provision is calculated (CCost) and is a function of the energy supplied (ES),
the charge or discharge unit efficiency (Ef) and the electricity tariff charged per kWh for re-charging (CC),
shown in equation (7).
𝑂𝑂𝐵𝐵𝐶𝐶𝐶𝐶𝑏𝑏 = 𝐸𝐸𝑆𝑆 𝑥𝑥 �2− 𝐸𝐸𝑓𝑓� 𝑥𝑥 𝑂𝑂𝐵𝐵
(7) The income per day received by the vehicle for the electricity delivered for V2G services (V2GI) is
dependent upon the V2G service tariff payment (V2GT), the unit efficiency and the energy supplied:
𝑂𝑂2𝐺𝐺𝐼𝐼= 𝐸𝐸𝑆𝑆 𝑥𝑥 𝐸𝐸𝑓𝑓 𝑥𝑥 𝑂𝑂2𝐺𝐺𝑇𝑇
(8) Battery degradation effects is a parameter of considerable uncertainty, and has been explored in detail in previous work [38–42]. Using a methodology applied previously in work on the impact of V2G on battery degradation [43],q a cost of degradation (CDeg) can be assigned per kWh of energy transferred.
This is calculated as a function of the percentage increase in cycles as a result of V2G cycling (CIn) , the
initial cost of the battery (BC) and the total energy supplied for V2G services (TES), as per equations
(9)-(11). 𝑂𝑂𝐼𝐼𝐼𝐼= 𝑂𝑂2𝑂𝑂𝐺𝐺𝐵𝐵 𝐵𝐵 (9) 𝑂𝑂2𝐺𝐺𝐵𝐵𝐵𝐵= 𝐵𝐵𝐼𝐼𝐼𝐼𝐼𝐼𝑥𝑥𝐵𝐵𝐵𝐵 (10) 𝑂𝑂𝐷𝐷𝐷𝐷𝐷𝐷=𝑂𝑂𝑇𝑇𝐸𝐸2𝐺𝐺𝐵𝐵𝐵𝐵 𝑆𝑆 (11) Where; V2GC and VC are the number of battery cycles with V2G and without V2G respectively, V2GCC is
the cost per cycle and BInc is the increase in battery use.
The total daily income to the vehicle for V2G service provision is therefore calculated as follows; 𝑂𝑂𝐼𝐼= 𝑂𝑂2𝐺𝐺𝐼𝐼− 𝑂𝑂𝐵𝐵𝐶𝐶𝐶𝐶𝑏𝑏− 𝑂𝑂𝐷𝐷𝐷𝐷𝐷𝐷
(12) 2.3.4 Building and Market Income
The daily savings to a building in utilising the V2G service to offset a proportion of grid-imported electricity (BldS) is a function of the original electricity cost (BldC) (£), the energy supplied per day by all
vehicles simulated (AES), the V2G service tariff payment and the infrastructure costs of the V2G
7
𝐵𝐵𝐵𝐵𝑑𝑑𝑆𝑆= 𝐵𝐵𝐵𝐵𝑑𝑑𝐵𝐵 −(𝐵𝐵𝐵𝐵𝑑𝑑𝐵𝐵 −(𝑂𝑂2𝐺𝐺𝑇𝑇 𝑥𝑥 𝐴𝐴𝐸𝐸𝑆𝑆)− 𝐼𝐼𝐵𝐵)
(13) The aggregated income from all vehicles selling into STOR is dependent upon the delivery payment received for each kWh of electricity transferred, multiplied by the amount of energy supplied. An availability fee is then added, which is a function of the availability payment multiplied by the time the EVs were available for STOR provision. Income received from the wholesale market with capacity market payments is a function of the capacity market provision payment plus the wholesale market payment for each half-hour delivery period, multiplied by the energy supplied.
2.3.5 System Model
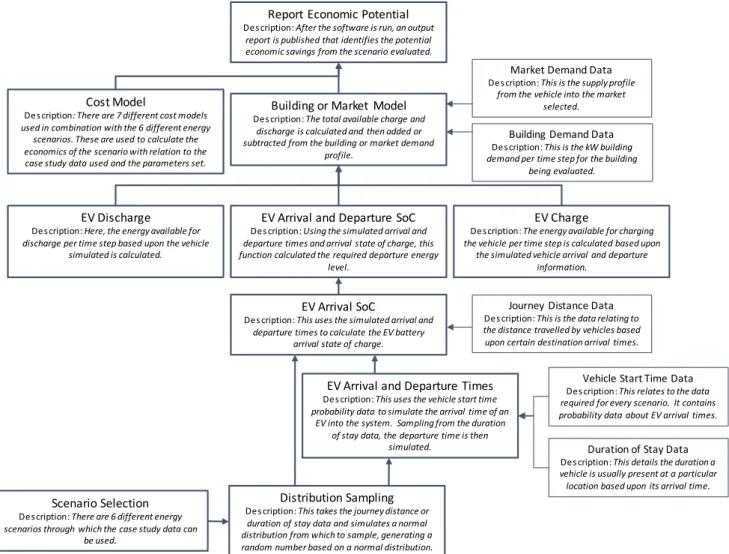
The process model is given in Figure 3. This details the data and input requirements for evaluation and the process followed for the analysis.
Figure 3 – Simulation process flow model, showing data and input requirements used in the analysis
2.3.6 Vehicle Usage Data Evaluation
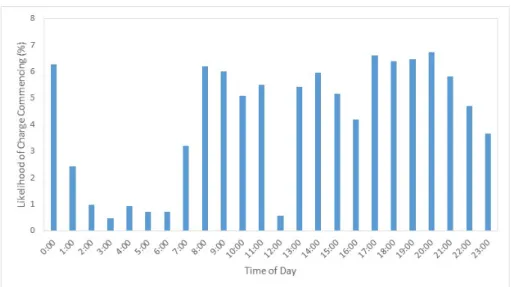
Vehicle usage data is derived from a field trial of 62 EVs containing two key datasets relating to charging and journey information [44]. A total of 2,305 work-based charging events took place during the year-long trail and 4,717 journeys were made. The distribution of charging events is given in Figure 4, which shows that most weekday charging events commence between 07:00 and 23:00, indicating that maximum vehicle availability is likely to occur between these times for this dataset.
Report Economic Potential
Description: After the software is run, an output report is published that identifies the potential economic savings from the scenario evaluated.
Scenario Selection
Description: There are 6 different energy scenarios through which the case study data can
be used.
Building Demand Data Description: This is the kW building demand per time step for the building
being evaluated.
Vehicle Start Time Data Description: This relates to the data required for every scenario. It contains probability data about EV arrival times.
Building or Market Model
Description: The total available charge and discharge is calculated and then added or subtracted from the building or market demand
profile.
EV Arrival and Departure SoC
Description: Using the simulated arrival and departure times and arrival state of charge, this function calculated the required departure energy
level.
EV Discharge
Description: Here, the energy available for discharge per time step based upon the vehicle
simulated is calculated.
EV Charge
Description: The energy available for charging the vehicle per time step is calculated based upon
the simulated vehicle arrival and departure information.
EV Arrival SoC
Description: This uses the simulated arrival and departure times to calculate the EV battery
arrival state of charge.
EV Arrival and Departure Times
Description: This uses the vehicle start time probability data to simulate the arrival time of an
EV into the system. Sampling from the duration of stay data, the departure time is then
simulated.
Journey Distance Data Description: This is the data relating to the distance travelled by vehicles based upon certain destination arrival times.
Duration of Stay Data Description: This details the duration a vehicle is usually present at a particular location based upon its arrival time.
Distribution Sampling
Description: This takes the journey distance or duration of stay data and simulates a normal distribution from which to sample, generating a random number based on a normal distribution.
Cost Model
Description: There are 7 different cost models used in combination with the 6 different energy scenarios. These are used to calculate the economics of the scenario with relation to the case study data used and the parameters set.
Market Demand Data Description: This is the supply profile
from the vehicle into the market selected.
8
Figure 4 - Number of weekday charging events per hour for commuting and pool vehicles
2.3.7 Building Demand Data Evaluation
Half-hourly data relating to electricity demand for a specific commercial building located at Manchester Science Park (MSP) were measured from July 2014 to June 2015. This building is used as a case study due to its relatively high electricity demand profile for its building class, and the relatively large number of adjacent parking spaces compared to its peers, making it potentially most suitable for V2G services. Figure 5 shows the maximum, minimum and average demand for the year per half-hour for a 24-hour period.
Figure 5 – Manchester Science Park electricity demand profile
This building is also subject to triad charges, and the relevant triad periods are shown in Table 3. Table 3 – Triad periods for 2014/2015 [45]
Day Time Period 04/12/2014 17:00 – 17:30 19/01/2015 17:00 – 17:30 02/02/2015 17:30 – 18:00
In addition, the building is also subject to Distribution Use of System (DUoS) charges, together with a standard electricity retail tariff. These charges are given in Table 4, with the network’s demand times shown via red-amber-green coding. [46]. The lowest cost charges occur during night-time hours, with peak (red) charges occurring during peak national demand times. In addition, an electricity tariff of £0.085/kWh is assumed, based on data obtained from the building’s facilities management agency.
9 Table 4 – DUoS charges input data (taken from [46])
Price Unit Red DUoS Charge 0.07156 [46] £/kWh Amber DUoS Charge 0.00392 [46] £/kWh Green DUoS Charge 0.00007 [46] £/kWh
2.3.8 Short Term Operating Reserve (STOR) Data Evaluation
Data on STOR dispatch periods is based on information supplied by E.ON and taken from [47]. Figure 6 shows the average monthly delivery to STOR for 2015 using data taken from the National Grid [48]. This indicates a higher probability of vehicles being called to discharge between 8am and 2pm and 4pm and 8pm.
Figure 6 – Short Term Operating Reserve (STOR) average provision per month for 2015 (based on data from [48]) Income generated from STOR provision disaggregated by season for 2014/2015 is shown in Table 5 [49]. Call-outs for STOR supply usually occur around 3 times weekly, or 155 days per annum.
Table 5 – STOR availability and utilisation payments (taken from data supplied by [49]) Season STOR Availability Payment (£/kWh-1) STOR Utilisation Payment (£/kWh-1)
Apr 0.0042624 0.1710748 May-Aug 0.004252 0.1704394 Sept 0.0040397 0.1673483 Oct 0.0041369 0.1672806 Nov-Jan 0.0032526 0.1711733 Feb-Mar 0.0032698 0.1713413
2.3.9 Half-hour Day Ahead Wholesale Market Data Evaluation
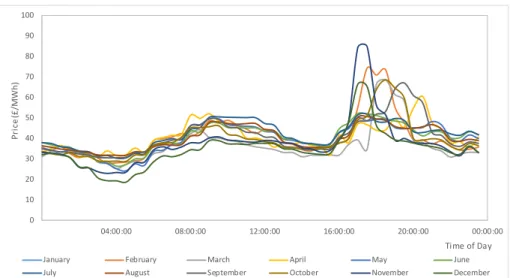
Bidding into this market for multiple half-hours per day is undertaken one day ahead of delivery [50]. Thus it is assumed that upon commencing discharge, vehicles provide energy for 1 hour and payment is based on rates specified in [50]. It is assumed supply occurs concurrently with STOR provision, namely 155 days per annum to provide comparative analysis. Figure 7 shows the monthly payment price per MWh of electricity supplied into the wholesale electricity market by half-hour period. This indicates that supply during the peak evening demand period would yield the greatest income.
0 20 40 60 80 100 120 140 04:00 08:00 12:00 16:00 20:00 00:00 Av er ag e Del iv er y p er 1 /2 h ou r S et tlem en t Per io d (MW h) Time of Day
January February March April May June
10
Figure 7 – Price per MWh for electricity supplied to the day ahead market per half-hour, showing monthly variation The capacity market is not predominantly an energy delivery scheme, but rather provides a power availability payment, with a contract based on a yearly payment. It could therefore be used as an additional income stream, provided power delivery can be guaranteed. Auctions during 2014 and 2015 closed at an average price of around £19/kW/year, resulting in an income of £19,400/MW/ year.
2.3.10 Input Variables
Learning curves for V2G costs have not as yet been evaluated. Thus, V2G infrastructure cost projections are approximated based on 2025 electricity prices and using a cost projection curve built from a PV system model (Figure 8). This is based on data derived from [51] and assumes a level of technical comparability for both PV and V2G technologies, and similar technology learning curves as the V2G market matures. Additionally, the income generation potential of PV is comparable to that of the income generation V2G offers through market trading and aggregation services. Prices have been aligned with data taken from the Plugged-in Midlands (PiM) network on charging station prices.
Figure 8 – V2G infrastructure cost projections
0 10 20 30 40 50 60 70 80 90 100 04:00:00 08:00:00 12:00:00 16:00:00 20:00:00 00:00:00 Pr ic e ( £/ M W h) Time of Day
January February March April May June
11
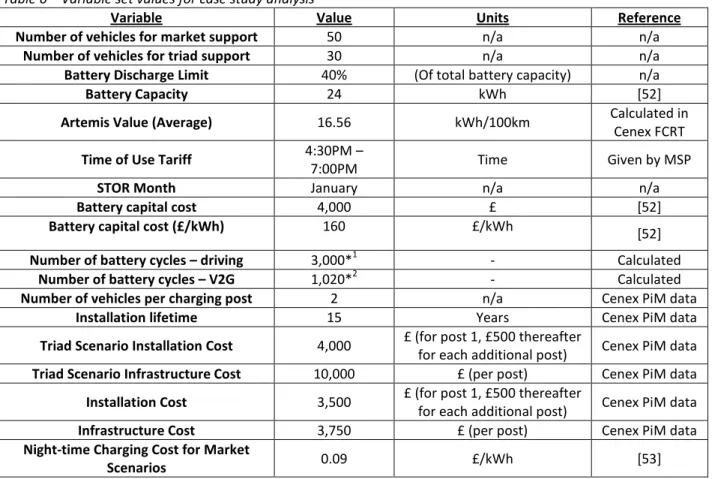
All other variables used within the analysis are given in Table 6. Table 6 – Variable set values for case study analysis
Variable Value Units Reference
Number of vehicles for market support 50 n/a n/a
Number of vehicles for triad support 30 n/a n/a
Battery Discharge Limit 40% (Of total battery capacity) n/a
Battery Capacity 24 kWh [52]
Artemis Value (Average) 16.56 kWh/100km Calculated in Cenex FCRT
Time of Use Tariff 4:30PM – 7:00PM Time Given by MSP
STOR Month January n/a n/a
Battery capital cost 4,000 £ [52]
Battery capital cost (£/kWh) 160 £/kWh [52]
Number of battery cycles – driving 3,000*1 - Calculated
Number of battery cycles – V2G 1,020*2 - Calculated
Number of vehicles per charging post 2 n/a Cenex PiM data
Installation lifetime 15 Years Cenex PiM data
Triad Scenario Installation Cost 4,000 £ (for post 1, £500 thereafter for each additional post) Cenex PiM data Triad Scenario Infrastructure Cost 10,000 £ (per post) Cenex PiM data Installation Cost 3,500 £ (for post 1, £500 thereafter for each additional post) Cenex PiM data
Infrastructure Cost 3,750 £ (per post) Cenex PiM data
Night-time Charging Cost for Market
Scenarios 0.09 £/kWh [53]
*1The number of drive cycles is based on an assumed annual mileage of 15,000 miles per annum,
equivalent to 60,000 miles over four years.
*2The number of V2G battery cycles is calculated based on 255 V2G cycles per annum, equalling 1020
cycles over 4 years.
3. Analysis and Discussion
This section details the evaluation of the economic viability of ‘pool’ EVs used for V2G services for three different use scenarios, namely triad demand reduction, STOR and wholesale market supply. Pool vehicles are those owned and managed by a company as part of the fleet, but used by employees for work based travel.
3.1 Vehicle usage profiles
Based on the EV field trial dataset used in this study, the probabilities of an EV being available for V2G services for each of the three scenarios is based on the field trial dataset, and is shown in Table 7. The simulation was run 750 times to provide an average value for pool vehicle availability as specified in Section 2.3.6.
Table 7 - Comparison of number of vehicles available for each scenario type Scenario Pool vehicles
Triad 36.40%
STOR 16.00%
12
Building triad demand avoidance ranked the highest in terms of vehicle availability for the three scenarios specified, with just over 36% of vehicles being available. Availability for STOR and wholesale market trading was significantly lower, at 16% and 14.37% respectively of vehicles available. This is due to the pool vehicles in question undertaking frequent shorter journeys throughout the day, therefore reducing their availability on-site.
Analysis indicated a vehicle availability for all three scenarios of maximum 36.4% of pool vehicles available, or around 275 vehicles for the case study in question. It should be noted here that the 30 and 50 vehicle simulation carried out in the present work represents 4% and 6% respectively. This is a realistic assumption given UK EV uptake figures projected for 2025.
3.2 Vehicle Income Evaluation
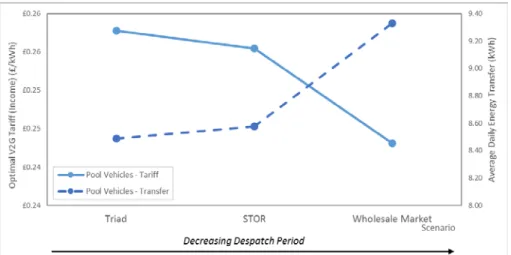
Figure 9 shows a comparison of services supplied and the minimum income required by one EV based on equation (12), where income relates to the minimum tariff required by the vehicle per kWh of electricity supplied to break even.
Figure 9 - V2G minimum required vehicle tariff for the Science Park building demand, STOR and the Capacity Market
These results imply that vehicles with higher energy transfer volumes can achieve a lower break-even payment requirement due to greater utilisation of the battery, greater depths of discharge and therefore greater income generated for each battery cycle undertaken. This means those markets with a higher energy transfer per V2G cycle offer greater potential income per kWh of electricity provided. This is illustrated by the STOR scenario outcome, which possesses a higher energy transfer value and thus the break-even electricity price is reduced by £0.02/kWh. Of note here is that in addition is the cost of recharging the vehicle after it has delivered V2G services.
Income for vehicles is investigated via the two external market revenue streams only, as income generation from building support is assumed to be included within the building income due to the vehicles being owned by the building operator. Based on the maximum income values, annual profit can be calculated per vehicle. These results are shown in Table 8, which are calculated based on the net profit after degradation and EV charging costs are considered. The results indicate that selling energy into the wholesale market provides is profitable. For the STOR market, the results indicate that income is not sufficient to cover the cost of degradation via combined availability and delivery payments. Table 8 – Yearly Income Generation from Market Support
Scenario Income Generated
STOR -£174.469
13
3.3 Building Income Evaluation
The potential savings made via utilisation of V2G during triad periods are calculated as follows:
A. Initially, the maximum demand for each of the triad periods shown in Table 3 are taken from the Science Park data and aggregated.
𝑇𝑇𝑆𝑆𝑡𝑡𝑇𝑇𝐵𝐵𝑇𝑇𝑇𝑇𝑇𝑇𝑇𝑇𝑑𝑑𝐷𝐷𝐷𝐷𝐷𝐷𝑇𝑇𝐷𝐷𝑑𝑑= 197.151 + 224.236 + 209.407 = 630.794𝑘𝑘𝑘𝑘h B. A loss adjustment factor is applied, taken as 1.051 from [46].
630.794 𝑥𝑥 1.051 = 662.964
C. Using the half hourly zonal tariff taken from [54], total triad charges are calculated.
𝑇𝑇𝑆𝑆𝑡𝑡𝑇𝑇𝐵𝐵𝑇𝑇𝑇𝑇𝑇𝑇𝑇𝑇𝑑𝑑𝑂𝑂ℎ𝑇𝑇𝑇𝑇𝑎𝑎𝐷𝐷𝑎𝑎= 662.964 𝑥𝑥 33.78 = £22,394.92
Thus, based on an average electricity cost of ~£35.50/ kWh during triad periods, a significant saving could be made from triad charge avoidance, depending on the costs of the V2G system and vehicle availability.
Given a maximum rate of EV discharge of 12kW per vehicle for triad periods, which is the average power rating for fast chargers in the UK, an average of 30 vehicles is required to reduce building electricity demand to zero during the triad periods. Thus, the potential benefit in utilising EVs for triad demand reduction is potentially significant, with an annual energy cost saving of around £13,000. It should be noted that triad periods are not fixed. Thus, the use of a triad forecasting approach to enable accurate prediction of triad periods, and appropriate pool vehicle fleet management would be optimal.
It may also be beneficial to utilise EVs to offset peak demand costs on days not subject to triad charges. Based on the case study electricity and DUoS charges (Table 4), there is potential benefit in utilising V2G during peak tariff periods, of between 4:30–7:00pm. At these times, the electricity price increases to around £0.175/kWh during this peak demand period. Thus, if vehicles are charged during the cheaper day and night time tariff periods, further cost savings could be achieved.
Using 30 pool vehicles to provide this demand reduction, the cost savings for the Science Park case study per annum are around £1,400 in addition to the triad demand reduction, giving a total saving of £14,247 per annum excluding infrastructure costs. Including the additional cost of the V2G infrastructure (Table 6), yearly savings are around £3,500.
3.4 Discounted Cash Flow Analysis
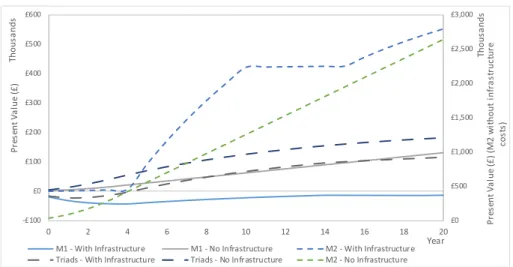
Whilst average cost calculations give a representation of daily income over the investment period, economic viability of each scenario is further evaluated using a discounted cash flow analysis. Analysis for 30 and 50 vehicles respectively (requiring 15 and 25 V2G units) servicing both triad and energy markets is carried out. These are assumed to be installed in blocks of 5 each year to provide a steady state solution and are each replaced after 15 years of use. NPV is calculated for all three scenarios using a discount rate of 10%, And the results are shown in Figure 10.
14
Figure 10 – Present Value analysis for all scenarios with and without infrastructure costs
Evaluation of all three scenarios indicates that triad demand reduction and wholesale market trading with capacity market support provide the primary economic benefits when infrastructure costs are included. Without V2G hardware installation costs (assumed if relevant infrastructure is already in place for EV charging purposes), all scenarios provide energy cost savings or income generation. The wholesale market with capacity market support provides a substantially increased income over all other opportunities. This is due primarily to income received from the capacity market together with additional income from energy provided to the wholesale electricity market.
3.5 Sensitivity analysis
The total potential cost savings or income generated via utilisation of V2G services is subject to annual variability depending on specific market characteristics. Thus, sensitivity analysis has been carried out for a 10-year investment period. Each of the input variables relating to the specific scenario evaluated are subjected to a positive and negative variation from the baseline by 20%, and NPV re-calculated each time. The variables used for the analysis are given in Table 9.
Table 9 – Sensitivity analysis variables
Variable Units 100% -20% +20%
EV charging payment £/kWh 0.05 0.04 0.06
V2G tariff payment (B2) £/kWh 0.15 0.12 0.18 V2G tariff payment (M1) £/kWh 0.30 0.24 0.36
TOUT peak payment £/kWh 0.215 0.172 0.258
V2G STOR payment £/kWh 0.293 0.2344 0.3516 STOR availability payment £/kWh 0.011 0.0088 0.0132
Total MW provision MW 3000 2400 3600
VPP vehicle number - 3000 2400 3600
Infrastructure cost £ 3750 3000 4500
Installation cost first £ 3500 2800 4200
Installation cost sub £ 500 400 600
Installation lifetime Years 15 12 18
Number of days per annum (B2) Days 255 204 306 Number of days per annum (M1) Days 155 124 186
Number of vehicles - 15 12 18
Analysis of STOR provision included calculation of NPV for 30 vehicles and 50 V2G assets respectively aggregated within a VPP network. Over the 10-year analysis period, the greatest sensitivity is associated with the cost of infrastructure. This is illustrated in Figure 11, which shows a tornado plot of all key
£0 £500 £1,000 £1,500 £2,000 £2,500 £3,000 -£100 £0 £100 £200 £300 £400 £500 £600 0 2 4 6 8 10 12 14 16 18 20 Pr es ent V al ue (£ ) ( M 2 w itho ut inf ra st ruc tur e co st s) Tho us ands Pr es en t V al ue ( £) Tho us ands Year M1 - With Infrastructure M1 - No Infrastructure M2 - With Infrastructure Triads - With Infrastructure Triads - No Infrastructure M2 - No Infrastructure
15
variables and their associated sensitivities. Also of significance sensitivity is the discharge payment received per kWh of electricity, which is a result of the relatively high degradation costs associated with V2G provision for all three scenarios evaluated.
Figure 11 – NPV sensitivity analysis for STOR market supply
The sensitivity analysis demonstrates the importance of electricity tariffs and infrastructure costs on potential V2G income, and especially the importance of the vehicle payment tariff to the ultimate viability of V2G. These results also indicate that the implications of the cost of V2G infrastructure is significant, with a negative NPV over the 20-year period evaluated if infrastructure at present costs is included. Scenarios where these costs are excluded include cases where the EV charging infrastructure is already a requirement, making V2G an existing asset.
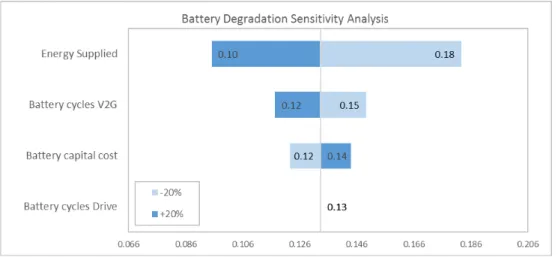
Another key sensitivity highlighted is battery degradation costs associated with V2G cycling. It should be noted that the calculations described in this paper, based on degradation rates obtained from previous studies represent a worst-case scenario [37,39–41,55]. Figure 12 shows the impact of battery degradation cost variations on the 10-year NPV.
Figure 12 – Battery degradation sensitivity analysis
The energy supplied from the battery during cycling has the single greatest impact on the cost of degradation, with increased energy supply decreasing the degradation cost. This is because the analysis assumes that for higher levels of energy discharged, the V2G cycling is increased. However, research on these aspects is not comprehensive, and the impact of other factors on battery degradation would be advantageous.
16 4. Conclusions
The potential for EVs to obtain income from energy supplied to a commercial building together with revenue accruing from specific ancillary service markets in the UK has been evaluated. The results indicate that implementation of V2G in the UK could provide a significant source of income in specific scenarios, in terms of energy supplied to the buildings as analysed here and to the owners of the EV assets. It was found that the cost of battery degradation and re-charging of the vehicle after V2G services has a significant impact on the feasibility of EVs to provide energy for V2G services. Due to the relatively high battery degradation costs associated with V2G cycling, wholesale market trading together with participation in the capacity market provided the highest income generation after the degradation costs were accounted for, with an NPV of around £8,400 per vehicle over a 10-year investment period. This is due to the payment per kWh of electricity being highest for this market compared to the other scenarios evaluated. Less value is generated from building self-consumption for triad and peak demand reduction, whilst the provision of STOR services proved to be the least viable, with income payments failing to meet battery degradation costs. Sensitivities associated with specific input parameters such as tariff levels were found to be significant, meaning the business case for V2G is subject to significant risk if for small variations in costs. However, this also offers significant potential, for example with falling battery costs, degradation costs decrease, thus generating a greater profit potential within the scenarios evaluated.
5. Acknowledgements
The authors wish to acknowledge funding from the Engineering and Physical Sciences Research Council (EPSRC) [Grant Number GR/T11295] and Cenex, The Centre of Excellence for Low Carbon and Fuel Cell Technologies, together with Manchester Science Partnerships for the supply of data.
6. References
[1] Department of Energy & Climate Change. Energy Security Strategy. London: 2012. [2] Element Energy (EE). Pathways to high penetration of electric vehicles. Cambridge: 2013.
[3] Shepard S. Tapping the Power Potential of Plug-in Electric Vehicles 2016:8–10. http://www.plugincars.com/tapping-power-potential-plug-electric-vehicles-130495.html.
[4] Haddadian GJ. Power Grid Operation Risk Management: V2G Deployment for Sustainable Development. Illinois Institute of Technology, 2014.
[5] Engerati. Nissan Begins LEAF to Home Grid Demand Response Testing 2015. http://www.engerati.com/article/nissan-begins-leaf-home-grid-demand-response-testing.
[6] Gough B. The Limitations and Potential Barriers to Wide-Scale Vehicle-to-Grid in the UK? IEEE Transp Electrif 2014.
[7] Loisel R, Pasaoglu G, Thiel C. Large-scale deployment of electric vehicles in Germany by 2030: An analysis of grid-to-vehicle and vehicle-to-grid concepts. Energy Policy 2014;65:432–43. doi:10.1016/j.enpol.2013.10.029.
[8] Nezamoddini N, Wang Y. Risk management and participation planning of electric vehicles in smart grids for demand response. Energy 2016;116:836–50. doi:10.1016/j.energy.2016.10.002. [9] Hoehne CG, Chester M V. Optimizing plug-in electric vehicle and vehicle-to-grid charge
scheduling to minimize carbon emissions. Energy 2016;115, Part:646–57. doi:http://dx.doi.org/10.1016/j.energy.2016.09.057.
[10] Gough B, Rowley P, Khan S, Walsh C. The Value of Electric Vehicles in the Context of Evolving Electricity Markets, n.d.
[11] National Grid (NG). Commercial Aggregation Service Providers. Natl Grid Website 2015. http://www2.nationalgrid.com/UK/Services/Balancing-services/Demand-Side-Aggregators/ (accessed July 23, 2015).
17 Buildings 2002.
[13] Pandžić H, Morales JM, Conejo AJ, Kuzle I. Offering model for a virtual power plant based on stochastic programming. Appl Energy 2013;105:282–92. doi:10.1016/j.apenergy.2012.12.077. [14] Zurborg A. Unlocking Customer Value : The Virtual Power Plant. World Power 2010:1–5.
[15] National Grid. Short Term Operating Reserve. Natl Grid Website 2015.
http://www2.nationalgrid.com/uk/services/balancing-services/reserve-services/short-term-operating-reserve/ (accessed July 23, 2015).
[16] GDF Suez Energy UK. Understanding the Capacity Market. Leeds: 2016.
[17] Department of Energy and Climate Change (DECC). Electricity Market Reform: Capacity Market - Detailed Design Proposals. London: 2013.
[18] National Grid. Triad Data. Natl Grid Website 2015. http://www2.nationalgrid.com/UK/Industry- information/System-charges/Electricity-transmission/Transmission-Network-Use-of-System-Charges/Transmission-Charges-Triad-Data/ (accessed July 24, 2015).
[19] EDF Energy. Triad charge reconciliation. London: 2007.
[20] Valk W, Iwaarden J. Monitoring in service triads consisting of buyers, subcontractors and end customers. J Purch Supply Manag 2011;17:198–206. doi:10.1016/j.pursup.2011.05.002.
[21] Sarabi S, Davigny A, Courtecuisse V, Riffonneau Y, Robyns B. Potential of vehicle-to-grid ancillary services considering the uncertainties in plug-in electric vehicle availability and service/localization limitations in distribution grids. Appl Energy 2016;171:523–40. doi:10.1016/j.apenergy.2016.03.064.
[22] Noori M, Zhao Y, Onat NC, Gardner S, Tatari O. Light-duty electric vehicles to improve the integrity of the electricity grid through Vehicle-to-Grid technology: Analysis of regional net revenue and emissions savings. Appl Energy 2016;168:146–58. doi:10.1016/j.apenergy.2016.01.030.
[23] McKenna E, McManus M, Cooper S, Thomson M. Economic and environmental impact of lead-acid batteries in grid-connected domestic PV systems. Appl Energy 2013;104:239–49. doi:10.1016/j.apenergy.2012.11.016.
[24] Gough B, Rowley P, Walsh C. What impact will the journey patterns of electric vehicles have on their capability to provide ancillary services? 5th IET Hybrid Electr. Veh. Conf. (HEVC 2014), London: IEEE; 2014, p. 1–5.
[25] Aryanezhad M, Ostadaghaee E, Joorabian M. Management and Coordination Charging of Smart Park and V2G Strategy Based on Monte Carlo Algorithm. Smart Grid Conf., Tehran: IEEE; 2014, p. 1–8.
[26] Bustos-turu G, Dam KH Van, Acha S, Shah N. Estimating Plug-in Electric Vehicle Demand Flexibility through an Agent-Based Simulation Model. 2014 5th IEEE PES Smart Grid Technol. Eur. (ISGT Eur., Istanbul: IEEE; 2014, p. 1–6.
[27] Robinson S. Simulation: The Practice of Model Development and Use. 2nd ed. Loughborough: Palgrave Macmillan; 2014.
[28] Hein R, Kleindorfer PR, Spinler S. Valuation of electric vehicle batteries in vehicle-to-grid and battery-to-grid systems. Technol Forecast Soc Change 2012;79:1654–71. doi:10.1016/j.techfore.2012.06.002.
[29] Tako AA, Robinson S. Model development in discrete event simulation and system dynamics: an empirical study of expert modellers. Eur J Oper Res 2010;207:784–94.
[30] Fattori F, Anglani N, Muliere G. Combining photovoltaic energy with electric vehicles, smart charging and vehicle-to-grid. Sol Energy 2014;110:438–51. doi:10.1016/j.solener.2014.09.034. [31] Druitt J, Früh W-G. Simulation of demand management and grid balancing with electric vehicles. J
Power Sources 2012;216:104–16. doi:10.1016/j.jpowsour.2012.05.033.
[32] Jian L, Zheng Y, Xiao X, Chan CC. Optimal scheduling for vehicle-to-grid operation with stochastic connection of plug-in electric vehicles to smart grid. Appl Energy 2015;146:150–61. doi:10.1016/j.apenergy.2015.02.030.
[33] Gough RC. Electric Vehicle Energy Integration Scenarios: A Feasibility Analysis Environment. Loughborough University, 2016.
18
[34] Zhan K, Hu Z, Song Y, Lu N, Xu Z, Jia L. A probability transition matrix based decentralized electric vehicle charging method for load valley filling. Electr Power Syst Res 2015;125:1–7. doi:10.1016/j.epsr.2015.03.013.
[35] André M. The ARTEMIS European driving cycles for measuring car pollutant emissions. Sci Total Environ 2004;334–335:73–84. doi:10.1016/j.scitotenv.2004.04.070.
[36] Barlow T, Latham S, Mccrae I, Boulter P. A reference book of driving cycles for use in the measurement of road vehicle emissions 2009:280.
[37] Uddin K, Picarelli A, Lyness C, Taylor N, Marco J. An acausal Li-ion battery pack model for automotive applications. Energies 2014;7:5675–700. doi:10.3390/en7095675.
[38] Barai A, Uddin K, Widanalage WD, McGordon A, Jennings P. The effect of average cycling current on total energy of lithium-ion batteries for electric vehicles. J Power Sources 2016;303:81–5. doi:10.1016/j.jpowsour.2015.10.095.
[39] Uddin K, Perera S, Widanage W, Somerville L, Marco J. Characterising Lithium-Ion Battery Degradation through the Identification and Tracking of Electrochemical Battery Model Parameters. Batteries 2016;2:13. doi:10.3390/batteries2020013.
[40] Petit M, Prada E, Sauvant-Moynot V. Development of an empirical aging model for Li-ion batteries and application to assess the impact of Vehicle-to-Grid strategies on battery lifetime. Appl Energy 2016;172:398–407. doi:10.1016/j.apenergy.2016.03.119.
[41] Wang D, Coignard J, Zeng T, Zhang C, Saxena S. Quantifying electric vehicle battery degradation from driving vs. vehicle-to-grid services. J Power Sources 2016;332:193–203. doi:10.1016/j.jpowsour.2016.09.116.
[42] Zhang C, Jiang J, Gao Y, Zhang W, Liu Q, Hu X. Charging optimization in lithium-ion batteries based on temperature rise and charge time. Appl Energy 2016. doi:10.1016/j.apenergy.2016.10.059.
[43] White CD, Zhang KM. Using vehicle-to-grid technology for frequency regulation and peak-load reduction. J Power Sources 2011;196:3972–80. doi:10.1016/j.jpowsour.2010.11.010.
[44] Cenex, Oxford Brookes University. Assessing the viability of EVs in daily life. vol. 96. Loughborough: 2004.
[45] National Grid. 2014-15 Triads. London: 2015.
[46] Western Power Distribution. Use of System Charging Statement. Bristol: 2015.
[47] National Grid. Short Term Operating Reserve: General Description of the Service. London: 2014. [48] National Grid. Forecast Volumes and Costs 2016.
http://www2.nationalgrid.com/UK/Industry- information/Electricity-transmission-operational-data/Data-explorer/Forecast-Volumes-and-Costs/ (accessed March 18, 2016).
[49] National Grid. STOR Annual Market Report 2014/ 2015 2016.
http://www2.nationalgrid.com/UK/Services/Balancing-services/Reserve-services/Short-Term-Operating-Reserve/Short-Term-Operating-Reserve-Information/ (accessed March 18, 2016). [50] APX Power UK. APX Power UK. Apx Power Spot Exch 2016:2–3.
http://www.apxgroup.com/trading-clearing/apx-power-uk/ (accessed March 10, 2016).
[51] Green Business Watch. UK Domestic Solar Panel Costs and Returns: 2010 – 2014. London: 2014. [52] Burn J. Nissan Leaf battery replacement to cost £ 4,920. Auto Express 2014.
http://www.autoexpress.co.uk/nissan/89694/nissan-leaf-battery-replacement-to-cost-4920# (accessed November 2, 2015).
[53] SSE Southern Electric. Prices & Tariff Information 2015. http://www.southern-electric.co.uk/ourprices/current/?ekfxmensel=663_665_665&postcode=M15 6SE (accessed November 2, 2015).
[54] National Grid. Final TNUoS tariffs for 2014/15. London: 2014.
[55] Wang L, Sharkh S, Chipperfield A. Optimal coordination of vehicle-to-grid batteries and renewable generators in a distribution system. Energy 2016;113:1250–64. doi:10.1016/j.energy.2016.07.125.
![Figure 6 – Short Term Operating Reserve (STOR) average provision per month for 2015 (based on data from [48]) Income generated from STOR provision disaggregated by season for 2014/2015 is shown in Table 5 [49]](https://thumb-us.123doks.com/thumbv2/123dok_us/9406165.2422160/10.892.193.702.367.618/figure-operating-reserve-average-provision-generated-provision-disaggregated.webp)