Manuscript received March 5, 2008 Manuscript revised March 20, 2008
Evaluating the Performance and Accuracy of Network Traffic
Management via Simulation Modelling in Heterogeneous
Environment
1Mohd Nazri Ismail and
2Abdullah Mohd Zin
1Faculty of MIIT, University Kuala Lumpur, Malaysia2Faculty of Computer Science, UKM, Malaysia
Abstract
We present a novel approach for the measurement and estimation of network traffic management in heterogeneous network environment. This research investigates performance evaluation of network traffic on heterogeneous services and technologies environment. We propose an enhanced equation to evaluate the performance of network traffic management via Little Law and Queuing theory to improve the evaluation algorithm. To get accuracy results on the performance of simulation model, we measure data from lab experiment and real LAN network environment. We use network management tool to capture those data and network analyzer to generate traffic. As a result, this simulation model can provide a good approximation of the real traffic observed in the real LAN network environment.
Keywords:
Simulation, Queuing theory, heterogeneous services, traffic management, network analyzer
1. Introduction
Considerable research has been conducted to model and quantify the performance of heterogeneous services and technologies (e.g [23]). Accurate measurements and analyses of network traffic characteristics are essential for robust network performance and management. Queuing theory [3] has been used as an effective tool to model performance in several technical and social contexts. The heterogeneous environment model is then analyzed and simulated using mathematical techniques. For example, several flow-level network traffic models have been proposed to describe/stimulate [21]. These models have been used to study fairness, response times, queue lengths and loss probabilities under different assumptions and using a variety of mathematical techniques. In contrast to other works in the literature (e.g., [7], [8], [9]), we developed simulation model to measure the performance of heterogeneous environment. Our model can be used to generate representative network traffic in a live network environment or in a simulated environment.
The significant of this study was to develop a simulation model to measure the network traffic performance in heterogeneous network environment using Queuing theory. This model could assist network administrators to design and manage heterogeneous network systems. Therefore, this simulation model is designed to: i) predict the performance of various services in order to aid technology assessment and capacity planning; ii) predict the expected behavior of services and design through qualitative or quantitative estimates of network performance; iii) assist network administrator to prepare, propose, plan and design network topology more effective and systematic; and iv) conduct ‘What-If’ analysis for evaluating heterogeneous network environment performance. Moreover, in the future, the integration of data and communication services, almost every ‘Internet Ready’ device [11]. With the availability of this infrastructure, users are now demanding and expecting more services [19], [20]. Convergence is pushing towards an environment that requires new investment in infrastructure and able to support the delivery of rich various services, applications and content [17], [21], [5]. Network deployment is growing increasing complex as the industry lashes together a mix of wired and wireless technologies into large-scale heterogeneous network architecture [2], [6]. Many factors may contribute to the congestion of network interface, such as a heavy load in the network that usually generates higher traffic [1]. Thus, this research is critical to be conducted in order to predict and measure of remote data transfers in heterogeneous environment.
2. Problem Statements
In the 21 century, a network infrastructure is based on multi-service implementation over convergence of network medium such as ISP, PSTN and GSM [12], [15]. Availability of various services has produced multi-traffic in network infrastructure and become more complex to analyze [13], [16], [17]. Today, retrieving and sending information can be done using a variety of technologies such as PC, PDA, fix and mobile phones via the wireless, high speed network, ISDN and ADSL lines that are more
prone to heterogeneous environment. The main factors of network congestion are related to network design and bandwidth capacity [18]. We have setup real LAN network environment to analyze and measure of network traffic utilization at University of Kuala Lumpur in Malaysia. This study posits several research questions: i) what is the performance level of the network traffic; and ii) Is the simulation model for evaluating and measuring the heterogeneous environment performance effective?
3. Methodologies
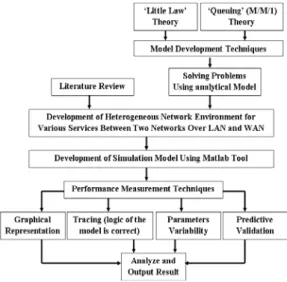
Whatever modeling paradigm or solution techniques in heterogeneous environment model development are being used, the performance measures extracted from a simulation model must be a good representation of the real LAN environment. Figure 3.1 shows the overall framework of the simulation model. There are four performance techniques to validate the simulation model: i) graphical representation; ii) tracing; iii) parameter variability; and iv) predictive validation. In addition, there are two techniques to judging how good a model is with respect to the real network: i) it must ascertain whether the simulation model implements the assumptions correctly; and ii) assumptions which have been made are reasonable with respect to the real network. Comparison with a real network is the most reliable and preferred method to validate a simulation model (refer to Figure 3.2).
Figure 3.1: Simulation Model Development Methodology
Figure 3.2: Simulation Model Verification and Validation Methodology
4. Simulation Model Development for
Remote Data Transfer
Many different types of modeling and simulation applications are used in various disciplines such as acquisition, analysis, education, entertainment, research and training [14]. In the Figure 4.1, theoretical model is based on a random distribution of service duration. Simulation model is divided as follows: i) to study physical model of real heterogeneous network environment; ii) transform physical model of real heterogeneous network environment into logical model; and iii) develop and implement the heterogeneous simulation model.
4.1 Physical Model of Real LAN Heterogeneous
Environment
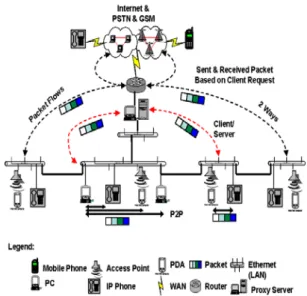
Figure 4.1 shows the network heterogeneous environment in real world. The physical model of real LAN heterogeneous environment is based on multi-services and multi-technologies has implemented at University of Kuala Lumpur. Then we need to transform from heterogeneous environment in real world into logical model. The logical model is the phase where mathematical techniques are used to stimulate heterogeneous environment.
Figure 4.1: Real Heterogeneous Network Environment at Main and Branch Campus
4.2 Logical Model of Heterogeneous Network
Environment
Figure 4.2 depicts the open queuing network based on M/M/1 will use to develop logical model of heterogeneous network environment for traffic management. Queuing theories are powerful enough to include many different combinations [1]. Parameters like bandwidth capacity, size of packet services and distances between two networks are used to ‘characterize’ the network traffic. The logical model is the important area need to define which mathematical techniques should be used in development of heterogeneous environment.
Figure 4.2: Logical model of Heterogeneous Network Environment at Main and Branch Campus
4.3 Development of Heterogeneous Network
Environment Model
This section describes a simple analytical queuing and little law theories that capture the performance of network traffic. A link refers to a single connection between routers and hosts. The link bandwidth is the rate at which bits can be inserted into the medium [22]. At this stage, we assume the data are transported between the two network sites (source and destination) as previously shown in Figures 4.1. Table 4.1 and Table 4.2 show the
parameters that have been used in original theory and simulation model development. The original Queuing theory is defined as an average number of clients in the system (variable name is ‘N’) in equation 1. Equation 2, defined as traffic intensity use by clients in the system. Equation 1, 2, 3 and 4 are derived based on logical model that has designed to meet requirements for heterogeneous network environment to measure network traffic availability. Logical model is derived and formulated in a single service (homogeneous concept) as in equations 5, 6, 7, 8, 9, 10 and 11. Then, the logical model is derived to the heterogeneous network environment in equations 12, 13, 14, 15 and 16.
Table 4.1: Notations for Original Queuing and Little Theories
Model Parameters
Meaning
N Average numbers of clients
T Average time a client spends in
the system (second) Clients arrival rates
μ Service rate in second
1/μ Mean service times
ρ
Traffic intensityTable 4.2: Notations for Model Development
Model Parameters
Meaning
Jum_klient Numbers of clients
P (P1,P2,P3,...Pm) Various of services
C (CLAN, CWAN) Size of Bandwidth on LAN and WAN interface ports
Tfik_Semasa Total of current traffics in the network
P1 Client uses single service
Tp Throughput or bandwidth
allocation base on time service required (second) Size of packet service request
by single client ( traffic)
μ
Jumlah Total size of packet services request by clients (traffic)λ
1 klient
μ
---- (1) --- (2)
Expectation value for traffic intensity:
--- (3)
Average time per clients in the system;
--- (4)
Numbers of Clients use single service for accessing network server
Bandwidth Capacity = Size of Packet Services + Current Traffic --- (5)
--- (6) --- (7) Traffic Current ] C ) 1 klient * ) klient _ Jum (( C [ C 1 Tp≥ −
μ
+---(8)
Traffic Current ] 1 klient * ) klient _ Jum ( C [ 1 Tp + − ≥
μ
---- (9) Traffic Current )] 1 klient * ) klient _ Jum (( Tp 1 [ C≥ +
μ
+--- (10)
Additional bandwidth link allocation to support traffic usage:
--- (11)
Total numbers of Clients use various services for accessing network server in Heterogeneous Environment
(Jum_klient*P1)+(Jum_klient*P2)+ (Jum_klient*P3)+…+(Jum_klient*Pm)=
µ
Jumlah --- (12) --- (13) Traffic Current ) ] C ) ( C C[ 1 ( T Jumlahμ
p + − ≥ ---- (14) ---- (15)Additional bandwidth link allocation to support traffic usage in heterogeneous network environment:
Traffic Current )] ( T 1 [ C
μ
Jumlah p + + ≥ --- (16)5. Accuracy of Simulation Model with Real
LAN Experimental
In this section, we verify the little law and queuing theories for heterogeneous simulation model experiments. The experiments are composed of WAN and LAN experiment to real LAN environment. Several tests were performed to evaluate the tuned parameters and the values that better ‘mimic’ the characteristics of the real networks. Real experiment is based on real network and need to consider as follows: i) network bandwidth is limited and is not enough for all application and users at the same time; ii) delay due to the network overloads; and iii) packet losses.
5.1 Experimental of Real Network Setup
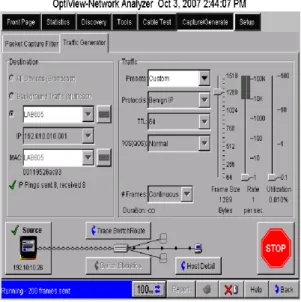
We used a network management application (Colasoft Capsa) to capture traffic between two networks link in real LAN experiments. Figure 5.1 shows the experimental setup of real network used in our tests. Fluke Optiview device can be configured to insert size of packet services and number of clients to generate traffic into the network interface port (Figure 5.2). By using varying number of clients and size of packet services, we are able to simulate network traffic. μ λ μ λ ρ = < 1; < ρ − ρ = 1 } n { E ) 1 ( 1 1 N T ρ − μ = λ − μ = λ =
T
*
N
=
λ
Traffic Current ) /C] P * t) (Jum_klien [1 1 C 1 ( T 1 p + − ≥ Traffic urrent C ) /C] * t) (Jum_klien [1 1 C 1 ( Tp klient1μ
+ − ≥ Traffic Current ]] * nt) [(Jum_klie T 1 [ C klient1 p+μ
+ ≥ Traffic Current ] C / 1 [ 1 C 1 T Jumlahμ
p + − ≥ Traffic Current ) )] ( [C 1 ( T Jumlahμ
p + − ≥Figure 5.1: Experimental Laboratory for Real LAN Environment Setup
Figure 5.2: Fluke Optiview Engine Setting for Size of Packet Services and Clients (Real LAN Experiment)
5.2 Real LAN Experiment
We have setup a real LAN environment for network traffic that generates measurement data to analyze network performance at main campus. The real network is based on LAN. We pump traffic to main campus over real LAN connection that is using Ethernet technologies. Low bandwidth link will affect size of packet services and
number of clients’ access to the network server (see Figure 5.3). Six sets of experiments were conducted with different scenarios (see Table 5.1). Fluke Optiview device is able to generate maximum traffic to 1518 bytes (12144 bits) only into real network (see Figure 5.2). In addition, this device is limited to LAN interface (Ethernet and fibre optic interface)
Table 5.1: Estimation of Network Traffic Management for Real LAN Experiments
Clients arrive (sec) Size of Services (bytes) Size of Services (bps) 53 1518 12144 209 1518 12144 372 1518 12144 53 1518 12144 209 1518 12144 372 1518 12144
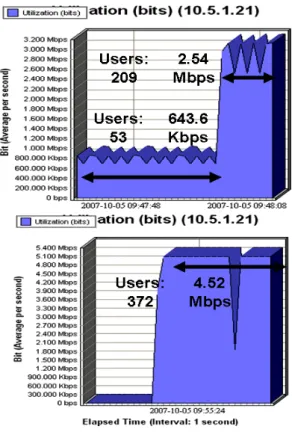
Figure 5.3: Bandwidth Link for Real Network Measurement
Then, we predict and estimate our data using simulation model and compare with real LAN experiments. Figure 5.6 shows the output results capture by network management application to measure network traffic over real LAN. The output results from real network will compare with simulation model. The results show that the variables are closely resemble with simulation model. Simulation model is also show the availability of the bandwidth capacity for heterogeneous technology such as 10, 100, 1000 and 10000 Mbps (see Figure 5.5). In addition, this simulation model capable to measure maximum throughput base on service time requires for identifying whether throughput of traffic is exceeding the maximum bandwidth link (see Figure 5.7).
Figure 5.5: Network Traffic Management over Ethernet Technology Using Simulation Model Measurement (Time
Series: 1 second) without Consider Any Current Traffic
Figure 5.6: Real Network Result for Ethernet Technology
Figure 5.7: Network Traffic Management over Ethernet Technology Using Simulation Model Measurement (Time
Series: 1 second) in Graphical Interface without Consider Any Current Traffic
We conclude that base on our findings, the simulation modelis able to predict and estimate network traffic usage for real LAN environment (see Table 5.2).
Table 5.2: Network Traffic Management Measurement Result Using Simulation Model
Message : size 1518 clients 53; Voice 1: size 1518 clients 209;
Voice 2: size 1518 clients 372
Ethernet Technology Bandwidth Link Mbps10 Mbps 100 Gbps 1 Gbps10 Current and Heterogeneo us Traffic 7.6993 Mbps (1 sec) Available Bandwidth (1 sec) 2.3007 Mbps 92.301 Mbps 0.992Mbps 9.9923 Mbps Additional
Bandwidth Current and Heterogeneous Traffic7.700 Mbps (1 sec) Additional Bandwidth for time service 8.699 Mbps
(Current and Heterogeneous Traffic) (0.001 sec) Upgrade Bandwidth Link 100 Mbps Above Acceptable
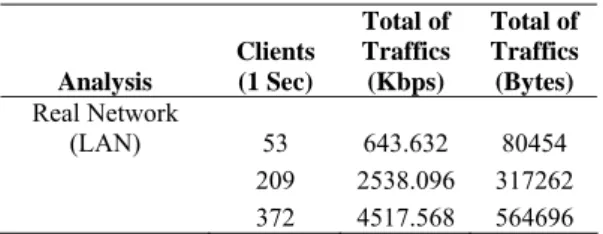
5.3 Comparison of Real LAN and Simulation
Model
Table 5.3 and Table 5.4 show a comparison between simulation model and real network using Ethernet interface. The result shows both scenarios use in simulation model and real network are able to predict and
measure network traffic usage. From the simulation model and real network results, it confirms that low bandwidth link can affect size of packet services and number of clients to access the network server in heterogeneous environment. Therefore, from the prediction and estimation result, this simulation model can assist network administrator to plan, propose and design network topology more systematic and efficiently for heterogeneous network environment.
Table 5.3: Measurement of Network Traffic Management for Simulation Model
Analysis Clients (1 Sec) Total of Traffics (Kbps) Total of Traffics (Bytes) Simulation 53 643.632 80454 Model 209 2538.096 317262 372 4517.568 564696
Table 5.4: Measurement of Network Traffic Management for Real LAN Experiment
Analysis Clients (1 Sec) Total of Traffics (Kbps) Total of Traffics (Bytes) Real Network (LAN) 53 643.632 80454 209 2538.096 317262 372 4517.568 564696
6. Conclusion
In this article we have shown how an analytical queuing network model can be used to understand the behaviors of heterogeneous environment over LAN experiment. The most apparent aspect is the network traffic usage due to size of bandwidth and number of clients. Our simulation model, has demonstrated that it can measure accurately the performance of heterogeneous services and technologies to access network server. Through real LAN experiments, the simulation model is verified and validated for providing accurate performance information for various services. Network traffic rate will directly affect the network performance. In network management, by monitoring and analyzing network traffic rate we can monitor the performance of the network, thus to study whether network is normal, optimal or overloaded. Network traffic rate also plays an important role in benchmark setting and network troubleshooting.
References
[1] J.kontio & R.Conradi, “Evaluating the Performance of a Web Site via Queuing Theory” Software Quality: 7th International Conference, Helsinki, Finland, Springer-Verlag Berlin Heideberg, pp. 63-72, 2002.
[2]. John Heidemann, Kevin Mills, Sri Kumar.”Expanding Confidence in Network Simulation”, IEEE computer, Vol. 15 (5), p.p 58-63, 2001.
[3] Ramon Puigjaner ,“Performance Modelling of Computer Networks”, IFIP/ACM Latin America Networking Conference, 2003, La Paz, Bolivia. ACM 2003.
[4] Fidel C., et al. “Performance analysis of distributed information retrieval architectures using an improved network simulation model”. Information Processing and Management 43 (2007) 204-224, Science Direct, 2006. [5] Georges Nogueira. “Measurement based validation of
GPRS/EDGE Analytical Models”, Infocom Student Workshop, 2006
[6] Chadi Barakat, et al. “A flow-based model for Internet backbone traffic”. Proceedings of the 2nd ACM SIGCOMM
Workshop on Internet measurment, Marseille, France, p.p:
35 – 47, 2002.
[7] S. Ben Fredj, et al. “Statistical Bandwidth Sharing: A Study of Congestion at Flow Level”, ACM SIGCOMM, 2001. [8] T. Bu & D. Towsley, “Fixed Point Approximation for TCP
behavior in an AQM Network”, ACM SIGMETRICS, Jun. 2001.
[9] A.A. Kherani & A. Kumar, “Performance Analysis of TCP with Nonpersistent Sessions”, Workshop on Modeling of Flow and Congestion Control, INRIA, Paris, 2000.
[10] Osman Balci. ‘Quality Assessment, Verification and Validation of Modeling and Simulation Applications’. Proceeding of Winter Simulation Conference. Simulation Conference, Vol. 1, pp. 129, 2004.
[11] Qigang Zhao, et al. “WNN-based NGN traffic Prediction”. ISADS. Proceedings Autonomous Decentralized Systems, pp. 230-234, 2005.
[12] Kyung-Hyu .L, et al. “Architecture to be deployed on strategies of next-generation networks”. Communications ICC '03. The IEEE,Vol. 2, pp. 819 – 822, 2003.
[13] Xianxin Jiang; Fangchun Yang; Hua Zou. “A novel architecture to customer service management for the NGN”. ICCT 2003. International Conference, pp. 123-126, 2003. [14] David R.Gerhan & Stephen M. Mutula. “Bandwidth
bottlenecks at the University of Botswana”, Published by Emerald Group, Vol. 23 (1), pp. 102-117, 2005.
[15] Jianqiang Li; Zhaohao Sun. “Internet/Web technology in higher education in China”. Advanced Learning Technologies, Proceedings. IEEE International Conference, pp. 993 – 997, 2004.
[16] Binh Thai, et al. “Integrated Personal Mobility Architecture: A Complete Personal Mobility Solution”.Kluwer Academic Publishers, 2003.
[17] Podhradsky, P.” Migration scenarios and convergence processes towards NGN (present state and future trends)”. Electronics in Marine Proceedings Elmar. 46th International
Symposium, pp. 39-46, 2004.
[18] J. Curtis & T. McGregor, "Review of bandwidth estimation techniques, " Proceeding New Zealand Computer Science Research Students, New Zealand , Vol. 8, 2001.
[19] C. Barakat, et al. “Modeling Internet backbone traffic at the flow Level”. IEEE Transactions on Signal Processing, 2003. [20] T. Bu & D. Towsley. “Fixed point approximation for TCP
behavior in an AQM network”. In Proceedings of ACM SIGMETRICS ’01, San Diego, CA, 2001.
[21] S. Fredj, et al. “Statistical bandwidth sharing: A study of congestion at flow level”. In Proceedings of ACM SIGCOMM ’01, San Diego, CA, 2001.
[22] Sommers, Joel; Barford, Paul. Self-Configuring Network Traffic Generation, In Proceedings of ACM Internet Measurement Conference, October, 2004.
[23] A. Tsalgatidou, et. al. “Developing scientific workflows from heterogeneous services”, ACM SIGMOD,Vol. 35 (2 ),