Siemens PLM Software
BI Presentation
Disclaimer
The BI Strategy discussed in the following slides
are unique to Siemens PLM Software and are not
necessarily representative of Siemens AG
Once Upon a Time there was a
company that loved Excel…
…they owned every Excel-based
…acquisitions were sad because of
the complex reporting silos…
…but the ever-wise CIO knew
there must be a better way. So
he formed a new, highly-skilled
team to change the culture…
…the challenge was issued…
•
Self-service
and Cross-application reporting new goals
•
Friendly Data
for end-user and developer
•
Analytics and Visualization
would be the way forward
•
One Source of the Truth -
reduce data movement and
shadow IT by creating a Data Lake
…the steps set…
•
ETL
- procure enterprise ETL tool to meet data movement and
transformation needs
•
Reporting
– find enterprise reporting tool to meet end-user ad-hoc
and visualization reporting needs – host reporting tool “bake-off”
•
Data Management
- minimize data transformation while bringing
in disparate data sources; provide consistency across enterprise
•
Governance
- develop rock-solid governance that protects data
yet is flexible enough to allow business to prototype and do ad-hoc
reporting
ETL – Extract, Transform and Load
•
Informatica PowerCenter was obvious choice – industry leader - no
“bake off” needed
•
High-speed connectors can move millions of rows of data very
quickly out of source systems such as SAP, BW and SFDC into
Greenplum Data Lake
•
Informatica’s footprint is expanding – has become “tool of choice” for
all data movement!
Reporting Tool “Bake-off”
Vendor PROs CONs
Tableau
§Easy enough for business analyst to use
§Direct data connectors
§Reporting experts really liked product
§Analytics and Visualizations tool of choice
§Does not slow Greenplum DB down – low overhead
§Good support for row-level security
§Scales for enterprise rollout
§Decent Admin tools
§Reasonably priced
§Focused on analytics and visualizations – not necessarily a good choice for operational reporting
WebFOCUS InfoAssist 8
§Existing WebFOCUS environment
§Inexpensive
§Operational Reporting tool of choice
§Limited Ease of Use
§IT support required
Business Objects
§Existing BO environment
§Great Operational Reporting tool
§Limited Ease of Use
§IT support required
§Current environment not scalable
§Expensive
Qlikview §Produces nice-looking reports
§Limited ease of use - scripting is required
§In memory engine required – cannot use Greenplum DB directly
Data Management
•
Informatica uses high-speed connectors to bring millions of rows of
source data into Greenplum
•
Data Staging process gets data ready for use:
•
Flatten out / de-normalize data
•
Add friendly, consistent column names
•
Ensure column values consistent
•
Snapshot data for trending analysis
•
Perform automated error checking
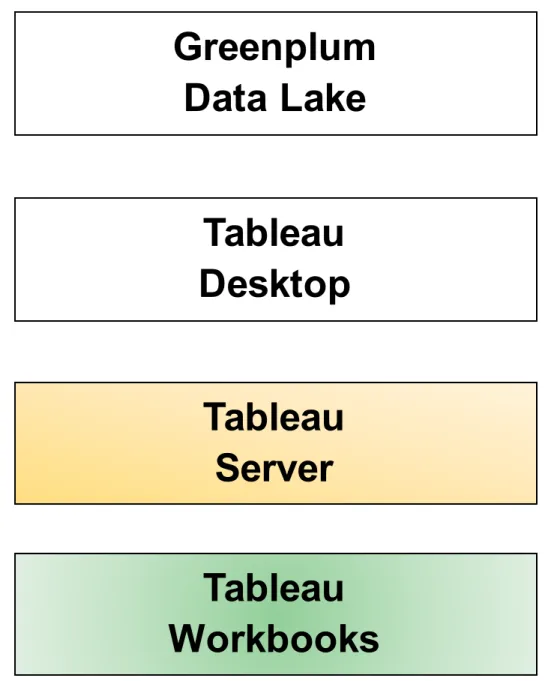
Governance
Tableau
Server
Tableau
Workbooks
Greenplum
Data Lake
Data loads from source systems and ease-of-use
verified by IT and signed off by the business
Tableau Workbooks can only be created or
modified by authorized users. Authorized user can
use Certified and Uncertified data sources
IT publishes all Certified Data Sources at request
of business
Tableau Workbooks are published only after
business SME approval
Tableau
Desktop
Put it all Together…
Greenplum Data Lake Tableau Server Informatica Extract, Transform and Load (ETL) O2O SFDC OpenAir Tableau Desktop(Super Users) Reporting Other Systems
There were bumps in the road…
•
IT Team very uncomfortable – wanted more detail when we
were “making it up as we went”
•
Difficult to manage expectations
•
Impossible to manage timeline – art not science
…some good decisions too…
•
CIO – project sponsor
•
Professional Services helped verify technical installation of product
and gave us excellent “best practices” help
•
Training was extremely important to get team up and running as
quickly as possible
•
Team “sequestered” for first year as we worked through standing up
reporting solution
Business Reporting Team
• Executive Reporting Council – sets overarching direction for Enterprise Reporting
• Business Stakeholders – responsible for reporting in a specific area of the business. Provides IT with Reporting Demands (data and, in some cases, reports)
• Reporting Council – group of Business Stakeholders that prioritize all Reporting Demands across the Enterprise
• Super Users – Business users that can create reports and, in some instances, combine Uncertified data with Certified data
• Data Czar – responsible for Enterprise Data Cleansing/Monitoring and reporting-specific
business process around DUNS, Industry, Product Hierarchy, etc. Must understand and has authority to require changes to business processes and Transactional systems where needed to support reporting and other such initiatives
IT Reporting Team
• Demand Manager – conducts periodic meeting with Reporting Council to prioritize all Enterprise reporting demands; works closely with Business Stakeholders to ensure alignment in developing Enterprise reporting area vision
• Project Manager(s) – works with different areas of the business managing business expectations and reporting projects
• Data Modeler(s)– develops overarching database architecture for providing Certified and Uncertified data to appropriate Business users, using “data in place” and ETL to Stage and De-normalize data into Data Lake
• Reporting Tool Team(s) – creates reports, provides support and administers security for Operational reporting tool
• Meta Data Manager – manages Data Certification, Data Cleansing, Data Normalization and provides Business users with Data Guides on all Certified data sources; works closely with and supports Data Czar
• Data Lake DBA – technical resource that manages Data Lake
Overall Roles and Responsibilities
Business – Data, Workbooks and Priorities:
• Owns data and business processes
• Verifies “ease of use” of Greenplum data
• Approves/denies user security requests
• Responsible for creating workbooks from published data sources
• Works with IT in training end users
• Sets priorities for what data is transformed when by IT team
IT – Data Transformation, Governance:
• Performs business analysis on data needed per the business
• Extracts, transforms and loads needed data into Greenplum
• Implements security per business requirements
• Ensures governance of data source and workbook publishing
• Creates “starter” workbooks when needed
Data Alignment Matrix
•
Gather each slice of data needed by each Business Stakeholder
•
Add to Data Alignment Matrix
Priorities – More Work Than People…
•
Each Business Stakeholder prioritizes their work
•
Meet with all Business Stakeholders – prioritize overall work
Data Governance Process
• Uncertified Data – is often brought into the reporting tool or even into Greenplum as Super Users do prototyping and ad-hoc reporting. This is encouraged by all, because the business will iterate the reports before requesting data to be Certified. Preserves precious IT resources
• Certified Data – data must be verified and signed off by the business before it can be used in a Production report.
• Data Requests – are made by the business in the Help Desk ticketing system
• What Data is Most Important? – prioritizing what data moves into the Data Lake when is the most important item to prioritize. We look for “sweet spots” where multiple Business
Stakeholders need the same data to help guide prioritization