BUILDING FORM OPTIMIZATION IN EARLY DESIGN STAGE TO REDUCE
1ADVERSE WIND CONDITION – USING COMPUTATIONAL FLUID DYNAMICS
23
Jihun Kim, Yun Kyu Yi, and Ali M. Malkawi
4The T. C. Chan Center for Building Simulation and Energy Studies
5University of Pennsylvania
6401 Furness Building, 220 South 34
thStreet, Philadelphia, PA19104
7[email protected]
8 9 10ABSTRACT
Computational Fluid Dynamics Simulation (CFD) has been mainly used for building scientists as an analysis tool to assess the complex phenomenon of building physics. It has recently been used as a design support tool. However, its utilization in the later phase of design restricts the applicability, mainly due to the lack of integration with geometry software application and optimization. This paper explores a method to integrate CFD with NURBS Modelling program (CAD) to optimize the building form in order to reduce the adverse wind. The first step is to investigate the hierarchical relationship between the geometries of the proposed building and surroundings, which are to be investigated by CFD to analyse the wind behaviour. The identified problems will be considered to generate the alternative forms to be simulated again with the existing surrounding geometries. This feedback loop will be repeated until it satisfies the objective. The proposed method will provide several alternative forms to be utilized for architects while discovering the relationship between building form and outdoor wind conditions.
INTRODUCTION
Background
Computational Fluid Dynamics Simulation (CFD) has been gaining its validity and applicability to analyse complex phenomena of building physics (Gosman 1999; Ferreira, Sousa et al. 2002). Currently CFD is used to assess natural indoor/outdoor airflow, heat transfer, turbulence modelling and many other flow related phenomenon (ANSYS 2006). More recently CFD has been perceived as a tool to increase the aforementioned performances along with building geometry software (CAD). Nevertheless, it is mainly utilized in later phase of design, when exterior building form has been fixed. It essentially limits the room to improve performance (Malkawi and Augenbroe 2004) . CFD can support the designer in the early stage of design to explore the variations of possible building geometries to achieve the goals set by the designer. However, the main obstacles for CFD application in
early design are due to lack of the integration with geometry software application and optimization. This paper explores a method to integrate CFD with recent development of NURBS (Non-uniform rational B-spline) modelling program to optimize the building form to reduce the adverse wind velocity in a given urban condition.
Buildings in a city significantly influence wind velocity and its patterns. Pedestrian wind discomfort can be increased by turbulence among buildings, which potentially leads to a danger. (Blocken and Carmeliet 2004). It is highly likely that building form will add an impact on this regard, when a new building is constructed. However, it is difficult to utilize wind in design consideration in the early phase, due to the complex nature of wind and the surrounding buildings.
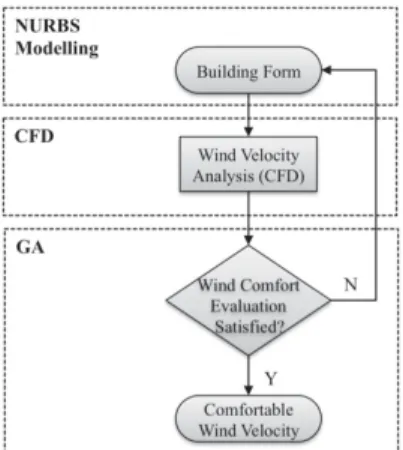
Figure 1 Conceptual Work Flow
The suggested overall process is illustrated in Figure 1, for which the initial building form will be modelled with surrounding buildings on an intersection of a commercial district. This geometrical information of built environment in a NURBS modelling software will be evaluated by CFD to determine whether wind velocity is comfortable to pedestrian or not. The next step is to create the alternative building form by modifying initial geometry, which will be analysed by CFD for the change of velocity pattern and intensity, compared to the initial design and its analysis. At this stage, the better performing building form(s) will
influence the next generation as in Genetic Algorithms (GA), which is a stochastic global search and optimization method (Chipperfield and Fleming 1995; Caldas and Norford 2002). In order to experiment the effectiveness of the the proposed method, alternative forms will be produced until either they converge or the predefined number of generation.
Agent Point Modelling
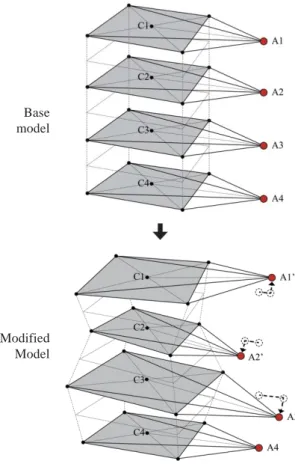
The agent point modelling technique is used to manipulate complex geometry with the movement of few control point data (xi,yi,zi) in Cartesian coordinate system (Yi and Malkawi 2009). This represents the building through its hierarchical relations with building geometries as it is illustrated in Figure 2. This modelling technique is greatly important to reduce the number of variables to define complex geometrical data and to enhance the controllability while saving significant computation expense during optimization process.
The following equations are how a point data can be represented in Cartesian coordinate system. Focus is to relocate the child points (Pi), according to the displacement of the agent point (A) relative to the centre point (C).
Pi(x,y,z) = C(x,y,z) + {Pi(x,y,z) – C(x,y,z)} +
{A(x,y,z) − C(x,y,z)} (1)
where,
Pi (x, y, z): child point position
C (x, y, z): centre point position (same as A before any movement of A)
{Pi(x, y, z) − C(x, y, z)}: displacement A(x, y, z): agent point position
{A(x, y, z) − C(x, y, z)}: agent point displacement
In this paper, 'Spherical Coordinate' is introduced for the numbers to literally represent rotational movement with angle (φ) on xy plane and magnitude (γ) of displacement (Anderson 1991). Angle on xz plane (θ) is omitted since each child point (Pi) stay fixed on z direction of Cartesian coordinate. Equation (2) shows the modified agent point representation from Equation (1). Pi(, φ) = C(, φ) + {Pi(, φ) − C(, φ)} + {A(, φ) − C(, φ)} (2) where, γ : magnitude of displacement φ : angle of rotation
The geometry is controlled, using the agent point method, Figure 2. Step 1 is that the agent points (Ai) are located at its initial location. When each agent
Step 1
A(γ, φ) : Initial agent point location C: Centre of initial geometry
Pi : Initial child point location
Step 2
A(γ’, φ) : New agent point location with rotation angle γ’ C: Centre of initial geometry
Pi : rotated child point location with rotation angle γ’
Step 3
A(γ’, φ’) : New agent point location with magnitude of displacement φ’ from centre point C: Centre of initial geometry Pi : Displaced child points with magnitude of displacement φ’ from centre point
Figure 2 Agent point strategy to control geometry
Base model
Modified Model
Figure 3 Three-dimensional arrays of agent points and their modification to control building form
point rotates at angle of γ’ around the centre point (C), each child point (Pi) rotates with the same angle with the same center in Step 2. Then, the agent point moves away from the centre point with magnitude of φ’, which displaces each child point from the same centre with the same magnitude as the last step. To control the three-dimensional scheme, 4 agent points are used for this paper, Figure 3. Each floor will rotate on its own angle (φi) and displaced with its own magnitude (γi) based on its own centre of floor due to the changes of values in each agent point that is created by random number generator.
Integrating Agent Point Modelling with GA
GA is stochastic global search and optimization methods that mimic the natural biological evolution. GA operates on generating potential solutions with the principle of survival of the fittest and successively produces better approximations to a solution (Chipperfield and Fleming 1995). At each generation of a GA, a new set of approximations is created by the process of selecting better-performing individuals according to their level of fitness in the tested environment, then reproduce them using numerical operators borrowed from natural genetics. This process leads to the evolution of populations of individuals that are better suited to their environment than the individuals from which they were created, just as in natural adaptation.
Solution domain in GA figurativly consititutes the individuals, as natural genetic structure has chromosomes (Yi and Malkawi 2009). This could be interpreted as a matrix format, equation (3). The matrix has a size of N_ind x L_ind, where, N_ind is the number of individuals and L_in is the length of genotype of the each individual.
(3)
The solution domain is composed with the group of individuals (chromosome). Each value in the simplified spherical coordinate system (γ and φ) is the genotype that constitute individual, equation (4).
gN,L = [γN,L φN,L] (4)
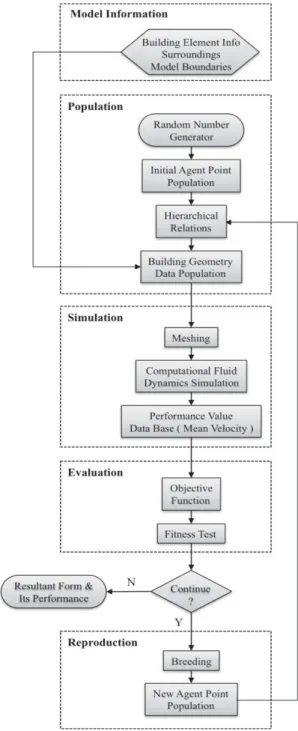
GA can be sub-categorized in to three part based on the current method, which are population, evaluation after simulation and reproduction as in Figure 4.
Initial numerical data population begins with random number generator. Newly created agent points will be processed by hierarchical relation to create the initial building geometry data in NURBS modelling program with other predefined surroundings / model boundaries in the population stage.
Meshing will be generated with the resultant form, and evaluated by CFD to assign the fitness value to its set of building geometry information (point data). This will then be compared with another set and its fitness value. Rank will be performed based on
Figure 4 GA Process With CFD Simulation Using Agent Point Technique (figure based on Yi and
fitness value comparison. High ranked geometry will be prioritized in reproduction of the next generation, where desirably performs better than its prodecessor. By 'breeding’, the loop will continue until either multiple solutions converges or pre-defined number of iterations or the objective value is satisfied.
EXPERIMENTATION
The geometry used in this experiment is a 6 story box shaped building (15m x 15m x 24.5m), which is located in an urban environment. The proposed building is located at the intersection of two commercial streets, Figure 5. The width of the street is 24m for east-west direction and 15m for south-north direction. Sizes and heights of surrounding buildings varies from 12 to 30m (3~8 stories).
:Surrounding building
: Building of interest (15W x 15D x 24.5H) :Measurement point location on 2m above ground
: Road
Figure 5 Site plan with velocity measurement plane
The random number generator creates four genotypes to compose one individual. Five individuals
constitute one domain for GA process. Therefore, one domain has 5 geometrically different buildings that are originally modified from the box-shaped base geometry. Each building form is transformed for each iteration by newly created genotypes.
One iteration takes about 1 hour, in which majority of time is spent for meshing and CFD simulation. This processing time can be considered feasible for early design decision, given the iterations are automated.
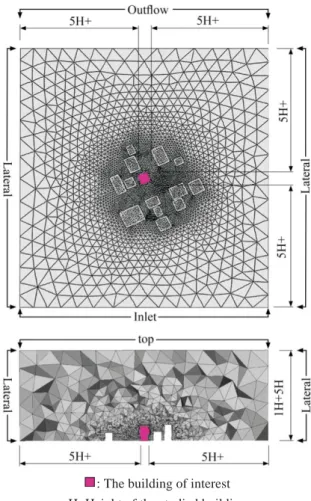
The mesh domain has the distance of 5H (H=height of the studied building) from the building of interest to inlet / outflow / lateral / top boundaries, Figure 6. The surrounding buildings are modelled within 2H distance. The surface mesh type is triangular and volume mesh type is tetrahedral with 3 prism layers on the building surfaces. The number of meshing grids on the building of interest is 11 x 11 x 18. This mesh domain conforms 'Recommendations of COST action C14 (Franke 2006).
The Reynolds Averaged Navier-Stokes (RANS) model is used for its known validity with K-epsilon Renormalized Group (RNG) as turbulence model for
better prediction of pressure coefficient and velocity. Pressure-based solver with steady state setting is used with gravitational (=9.81 m/s2). For the boundary condition, inlet boundary has velocity of 3.63 m/s at 2m above ground with power law. Parallel flow is used at top and lateral boundaries. For the numerical approximation, the second order upwind is used for momentum, gradient, pressure, turbulent kinetic energy, and turbulent dissipation rate. SIMPLEC is used for pressure-velocity coupling. This CFD application complies with the recommended use in wind engineering (Franke, Hirsch et al. 2004) to predict velocity in urban area for wind comfort analysis.
Even though the gust wind is typically used to evaluate the wind discomfort level (Koss 2006), this paper will use mean velocity for simplicification purpose due to solely focus on the expriment the impact of building geometry on change of wind. Additionally, most comfort criteria in current practice demands mean velocity (P. Delpech, C.J. Baker et al. 2005). Weather data at Philadelphia International Airport is used whwere prevailing wind speed is 6 m/s at reference level on December, roughly 155 degrees from east.
: The building of interest H: Height of the studied building
Figure 6 Mesh configurations in plan (upper) & section (lower) view with types and sizes
Individual A 6.94 5.42 7.15 5.31 6.04
Figure 7 Evolution of building form & velocity by selected generation for prevailing wind on December at downtown Philadelphia. Optimized forms are on the bottom of each column.
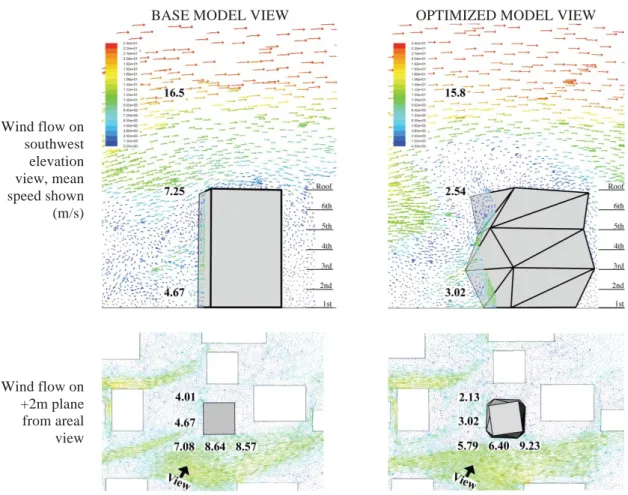
BASE MODEL VIEW OPTIMIZED MODEL VIEW
Wind flow on southwest elevation view, mean speed shown (m/s) Wind flow on +2m plane from areal view
RESULT AND DISCUSSION
The morphological evolution of each individual is shown in Figure 7, which is eventually converged to a similar form. The building form after GA process has the modified middle part in a way that there are changes of plane on the surfaces. This condition interrupts the continuity of wind eventually brings less velocity to pedestrian level as Figure 8 shows. The southwest elevation view illustrates how the optimized building form creates a couple of clusters of small turbulences, which were dispersed from the main wind flow above and around the upper part of the building. This is quite a contrast where the base box form (orthogonal before any modification) allows the downwash wind along its surface, while shaping one large shape of turbulence. At the areal view of Figure 8 for the optimized model, the velocities are dropped significantly for the most areas except for the south east corner, which shows an increase probably because of a pressure increase from added re-routed wind. This partial increase was overlooked because average velocity is utilized for the objective.
In the end of the GA process, the mean velocity eventually was reduced to 3.48 m/s for four
individuals, and to 3.45 m/s for individual ‘E’. This is very significant performance increase, compared to 5.72 m/s of the base model with the velocity reduction of 2.27 m/s, which is 39 % decrease from the base model.
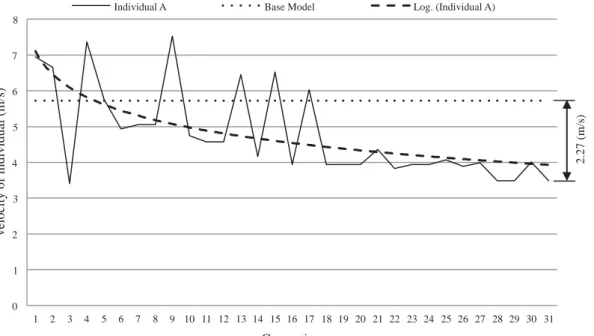
Figure 9 shows the evolution of velocity for the
individual A of the experimented domain in Figure 7. This individual has significant variances on early
generations from generation #1 to #10. This is led by the different building forms, hierarchically generated by wide range of agent points, which are created by random number generator. However, this diversity of velocities significantly decreases until 17th generation and the vast majority of resultant velocity from 18th generation yields less velocity than the base model (5.72 m/s). It is because only high performing
individual(s) (building form) within the domain survived and prospered through the reproduction procedure in GA. This figure also shows logarithmically fitted line of individual A, which shows the gradual evolution process even though there are some variations in actual velocities until it reaches the optimized solution.
CONCLUSION
This paper presents a design method to incorporate CFD in an early design phase with introduction of GA and agent point based modelling technique. GA is the search engine to find optimal solution to reduce wind velocity at pedestrian level around the building of interest. Prevailing wind in Philadelphia downtown was assessed in current work, resulting significant performance increase to reduce pedestrian wind velocity.
The results showed that there is high diversity in alternative building forms (or initial populations) with velocity for each individual, which will gradually converge to the optimized building form with optimal or near-optimal solutions. This will provide design options and educated intuition for architects to incorporate in design practices.
0 1 2 3 4 5 6 7 8 1 2 3 4 5 6 7 8 9 10 11 12 13 14 15 16 17 18 19 20 21 22 23 24 25 26 27 28 29 30 31 velocity of individual (m/s) Generation
Figure 9 Velocity evolution of Individual A
Individual A Base Model Log. (Individual A)
The paper is intended for the very early stage of design process, but more studies need to be conducted for the later stage with added details. Large openings, balconies or attached shading devices may be considered with other changes that can significantly impact on wind behavior. These added details can be potential studies with the suggested method in this paper. Other building typologies can be explored such as cylindrical or oval form to reflect the current trend in design practice. Additionally, the different types of pedestrian activities can be considered, such as sitting in outdoor restaurant or standing to wait for a bus with the consideration of gust effect. Current steady-state solution can also be extended to capture the extended period of time of concerns.
REFERENCES
Anderson, J. D. (1991). Fundamentals of aerodynamics, McGraw-Hill.
ANSYS, I. (2006). ANSYS FLUENT 12.0 Getting Started Guide.
Blocken, B. and J. Carmeliet (2004). "Pedestrian Wind Environment around Buildings: Literature Review and Practical Examples." 28(2).
Chipperfield, A. and P. Fleming (1995). The MATLAB genetic algorithm toolbox, IET. Ferreira, A., A. Sousa, et al. (2002). "Prediction of
building interference effects on pedestrian level comfort." Journal of Wind Engineering and Industrial Aerodynamics 90(4-5): 305-319. Franke, J. (2006). Recommendations of the COST
action C14 on the use of CFD in predicting pedestrian wind environment.
Gosman, A. (1999). "Developments in CFD for industrial and environmental applications in wind engineering." Journal of Wind Engineering and Industrial Aerodynamics 81(1-3): 21-39. Holmes, J. D. (2007). Wind loading of structures,
Taylor & Francis Group.
Koss, H. (2006). "On differences and similarities of applied wind comfort criteria." Journal of Wind Engineering and Industrial Aerodynamics 94(11): 781-797.
Malkawi, A. M. and G. Augenbroe (2004). Advanced Building Simulation. New York & London, Spon Press.
P. Delpech, C.J. Baker, et al. (2005). "Pedestrian wind comfort assessment criteria: a comparative study, In J. Náprstek and C. Fischer (Eds.)." 4th European & African Conference on Wind Engineering, Prague.
Yi, Y. and A. Malkawi (2009). "Optimizing building form for energy performance based on
hierarchical geometry relation." Automation in Construction 18(6): 825-833.
Anderson, J. D. (1991). Fundamentals of aerodynamics, McGraw-Hill.
ANSYS, I. (2006). ANSYS FLUENT 12.0 Getting Started Guide.
Blocken, B. and J. Carmeliet (2004). "Pedestrian Wind Environment around Buildings: Literature Review and Practical Examples." 28(2).
Caldas, L. G. and L. K. Norford (2002). "A design optimization tool based on a genetic algorithm." Automation in Construction 11(2): 173-184.
Chipperfield, A. and P. Fleming (1995). The MATLAB genetic algorithm toolbox, IET.
Ferreira, A., A. Sousa, et al. (2002). "Prediction of building interference effects on pedestrian level comfort." Journal of Wind Engineering and Industrial Aerodynamics 90(4-5): 305-319.
Franke, J. (2006). Recommendations of the COST action C14 on the use of CFD in predicting pedestrian wind environment.
Franke, J., C. Hirsch, et al. (2004). Recommendations on the use of CFD in wind engineering.
Gosman, A. (1999). "Developments in CFD for industrial and environmental applications in wind engineering." Journal of Wind Engineering and Industrial Aerodynamics 81(1-3): 21-39.
Koss, H. (2006). "On differences and similarities of applied wind comfort criteria." Journal of Wind Engineering and Industrial Aerodynamics 94(11): 781-797.
Malkawi, A. M. and G. Augenbroe (2004). Advanced Building Simulation. New York & London, Spon Press.
P. Delpech, C.J. Baker, et al. (2005). "Pedestrian wind comfort assessment criteria: a comparative study, In J. Náprstek and C. Fischer (Eds.)." 4th European & African Conference on Wind Engineering, Prague.
Yi, Y. and A. Malkawi (2009). "Optimizing building form for energy performance based on hierarchical geometry relation." Automation in Construction 18(6): 825-833.