Keeping Pace
with
K – 12 Online Learning
A Review of State-Level
Policy and Practice
2008
Research and writing by
John Watson, Butch Gemin and Jennifer Ryan Evergreen Consulting Associates
Writing, editing, and guidance from
Todd Hitchcock, Pearson Education Kate Loughrey, Texas Education Agency
Chuck Mitchell, Wyoming Department of Education Liz Pape, Virtual High School Global Consortium
Allison Powell, North American Council for Online Learning Mickey Revenaugh, Connections Academy
Dan Schultz, Michigan Virtual University Matt Wicks, Illinois Virtual High School Julie Young, Florida Virtual School
November 2008
Keeping Pace
with
K – 12 Online Learning:
A Review of State-Level
Policy and Practice
®2 ACKNOWLEDGEMENTS
Acknowledgements
This is the fifth annual Keeping Pace report. With the report becoming increasingly
recognized—similar to the acceptance of online learning in general—it is worth recalling the people and organizations that had the foresight to support this research in its early days, as well as those who continue to provide backing.
The first Keeping Pace was published in 2004, in response to a request for timely online education policy information by the Colorado Department of Education (CDE). Stevan Kalmon, then of the CDE, was a strong advocate for the project, and helped with raising funds, writing and editing. The report was originally envisioned as a simple document that would be distributed only to the sponsoring organizations, but Cathy Gunn, then of the North Central Regional Educational Laboratory at Learning Point Associates, recognized the work’s larger value and was instrumental in suggesting and overseeing publication and distribution to a wider audience. The four funding organizations in the first year were the CDE, Illinois Virtual High School (IVHS), Learning Point Associates, and Wisconsin Virtual School. In 2004 Keeping Pace reviewed 22 states, and in 2005 expanded to review all 50 states. All subsequent years have continued this national approach. The expansion to review the entire country was largely in response to the vision of Matthew Wicks of IVHS.
For the 2008 report, funders are Connections Academy, Florida Virtual School, Illinois Virtual High School, Michigan Virtual School, North American Council for Online Learning, Pearson Education, Texas Education Agency, Virtual High School, and the Wyoming
Department of Education.
Keeping Pace benefits from the guidance and leadership of some of the most experienced and
knowledgeable online learning practitioners, who represent a wide range of organizations that share an interest in online education:
Todd Hitchcock
Pearson Education
Kate Loughrey
Texas Education Agency
Chuck Mitchell
Wyoming Department of Education
Liz Pape
Virtual High School Global Consortium
Allison Powell
North American Council for Online Learning
Mickey Revenaugh
Connections Academy
Dan Schultz
Michigan Virtual University
Matt Wicks
Illinois Virtual High School
Julie Young
Florida Virtual School
Another set of key contributors to the report are the people associated with an online program or education agency who gave their time to provide the information that is the basis for Keeping Pace. We have been consistently surprised by the amount of time and quality of responses we receive from people around the country. This report would not be possible without their input.
We have made every attempt to ensure accuracy of the information in Keeping Pace, but recognize that in a report of this breadth some errors of accuracy or omission are likely. We welcome comments, clarifications, and suggestions; please send them to johnw@ evergreenassoc.com.
Table of Contents
Acknowledgements . . . 2
How to read this report . . . 4
Definitions . . . 5
Executive summary . . . 8
1. National snapshot and the year in review . . . 12
2. Survey results: online programs and practices . . 18
3. Notes from the field . . . 22
4. Key policy issues . . . 32
5. Conclusion: Will online learning
Disrupt Class?
. 44
6. Program profiles . . . 48
7. State profiles . . . 70
Southeastern states . . . 70 Northeastern states . . . 92 Central states . . . 102 Western states . . . 126Appendix A: Methodology . . . 163
4 HOW TO READ THIS REPORT
How to read this report
Keeping Pace has several goals. First, it strives to add to the body of knowledge about
online education policy and make recommendations for advances. Second, it serves as a reference source for information about programs and policies across the country, for both policymakers and practitioners who are new to online education as well as those who have extensive experience in the field. Third, because there has been so much online education activity in the past year, the report attempts to capture new activity.
A definitions section immediately precedes the executive summary. There are many terms in online learning without commonly understood definitions; this section defines some key terms in this report.
The first chapter, titled National snapshot and the year in review, captures a picture of the state of online learning in 2008 and provides a short summary of some key developments in the past year.
Survey results: Online programs and practices discusses some of the findings of the Keeping Pace survey of online programs around the country.
For Notes from the field we invited sponsors and other researchers and practitioners to contribute short articles on specific subjects that in most cases were not major areas of focus for Keeping Pace. The resulting articles raise several key issues that are not discussed in depth elsewhere in the report, and we appreciate the effort by the authors.
Key policy issues discusses important online learning issues and is based on the research done for the state profiles that appear near the end of the report.
The Conclusion looks to the future and explores some of the policy changes that, if implemented, will help expand educational options for students.
Following the above-listed chapters are two long sections that provide much of the data on which the summaries and conclusions are based. The first section describes a subset of the programs that responded to the Keeping Pace program survey, divided by program type. For each program type common attributes are discussed, and exceptions to the common attributes are noted. The second section contains online learning profiles of all fifty states, divided into four geographic regions.
Although presented first, the key issues chapter of the document builds on the program and state profiles presented later in the report. Most state profiles include footnotes that reference state laws, state policies, and websites of programs. However, in some cases, the information is general and was gathered through numerous website reviews and phone interviews with state agencies; in these cases footnotes are not included. The primary purpose of footnotes is to provide the source documents that will be most valuable to readers.
Definitions
Keeping Pace reports primarily on issues surrounding online learning, which we define
as teacher-led education that takes place over the Internet, with the teacher and student separated geographically. Several associated educational practices, such as programs that blend online and face-to-face instruction, the use of Internet-based resources in the classroom, and laptop initiatives, are discussed in cases where there are significant programs or policies related to these practices.
We prefer the terms “online learning” and “online schools,” instead of expressions such as elearning, virtual schools, and cyberschools. However, state legislatures across the country often use these terms. For example, Texas legislation defines “electronic courses” as “instruction and content are delivered primarily over the Internet,” and several states use the term “virtual” in their laws regarding online education. In some cases where state programs or policies describe online learning using these words, in the state profiles we use the terms used by the state to describe the online learning landscape.
For simplicity, Keeping Pace draws a distinction between supplemental programs and
full-time programs. The distinction is not precise, because a few supplemental programs have some full-time students, and programs that fall into the full-time category have some part-time students. Although not exact, the distinction is important because students in supplemental programs are enrolled in a school separate from the online program, while students in full-time programs are enrolled only in the online school. In addition,
Full-time programs typically are responsible for these students’ scores on state
assessments required by No Child Left Behind, which is the primary way in which student outcomes, and school performance, are measured; and
Full-time programs are often funded by the per-pupil (also known as FTE for
full-
time equivalent) public education funding formula that follows the student, while most state-led supplemental programs are funded primarily by separate legislative appropriations. (Florida Virtual School is an exception in that FLVS receives per-pupil formula funding.) While both types of programs are state-funded, using taxpayer dollars, the difference in the funding mechanisms is significant.
The way in which Keeping Pace counts student numbers for full-time programs and supplemental programs is also fundamentally different. For supplemental programs we count course registrations—one student in one semester-long course—while in full-time programs we count enrollments, defined as one year-long FTE student.
Other terms used in this report are defined as follows:
State-led online programs are created by legislation or by a state-level agency, and/or administered by a state education agency, and/or funded by a state appropriation or grant for the purpose of providing online learning opportunities across the state. (They may also receive federal or private foundation grants, and often charge course fees to help cover their costs.) State-led programs are typically supplemental, offering courses for students who are otherwise enrolled in a traditional school setting. Examples of state-led online programs include the Illinois Virtual High School, Kentucky Virtual High School, and Michigan Virtual School.
6 DEFINITIONS
Because online programs evolve, some programs are categorized as state-led that do not fit the definition presently, but did in important stages of their development. Florida Virtual School, for example, is now independent and funded via the state’s FTE public education funding formula, but previously received funding via separate legislative appropriation.
State-led online initiatives are different from online programs in that initiatives typically offer online tools and resources for schools across the state, including aggregating courses from outside sources, instead of developing and offering their own courses that are taught by teachers that they have hired. Examples include the Washington Digital Learning Commons, Oregon Virtual School District, and Massachusetts Online Network for Education (MassONE).
Full-time online programs, sometimes called cyberschools, are online learning programs in which students enroll and earn credit issued by the full-time online program towards academic advancement based on successful completion of the courses (or other designated learning opportunities) provided by the online school. Many full-time online schools are charter schools.
Some states draw a distinction between single district programs, which serve students who reside within the district that is providing the online courses, and multi-district programs, which serve students from multiple districts. Multi-district programs may be state-led, run by a consortium or network, or operated by one district offering an online program to students from other districts.
State-level policies, including legislation, education code, and formal rules promulgated by the state education agency, are a main focus of the state profiles. This report is primarily interested in policies that were created to address online learning in its various forms, but also includes policies that were created for brick-and-mortar schools, or other types of distance learning, that are used to regulate online learning in the absence of specific online policy.
EXECUTIVE SUMMARY 8
Executive summary
Late 2007 and the first half of 2008 saw the continued growth of online learning, both in terms of new programs being created, existing programs growing, and new legislation being passed to facilitate further growth. As of fall 2008, 44 states offer significant online learning opportunities for students.
Seventeen states offer significant supplemental and full-time, online options for
students. Many of these states have both a state-led program and full-time, online schools.
Twenty-three states offer significant supplemental opportunities, but not full-time
options. Most of these states have state-led programs, such as the Michigan Virtual School, Illinois Virtual School, and Virtual Virginia.
Four states offer significant full-time opportunities—but not supplemental. These
states have extensive charter schools and/or district online programs, but do not have a state-led supplemental program that offers courses to students across the state.
Types of online programs
State-led programs and initiatives continue to be an important online learning option for students in many states. As of fall 2008, 34 states offer state-led programs or initiatives that are designed, in most cases, to work with existing school districts to supplement course offerings for students. Examples of state-led programs (which provide full courses, teachers, and student support) include Florida Virtual School, Illinois Virtual High School, Michigan Virtual School, Idaho Digital Learning Academy, Georgia Virtual School, Kentucky Virtual Schools, and the Missouri Virtual Instruction Program. Examples of state-led initiatives, which provide online resources, or serve as a central clearinghouse for online courses, include the Washington Digital Learning Commons, Wyoming Switchboard Network, Texas Virtual School Network, and Oregon Virtual School District. Most state-led programs are:
High school level, with some middle school,
Supplemental—providing one or more courses to students enrolled elsewhere, and
Funded primarily by separate state appropriations rather than the per-pupil funding
formula.
Full-time online schools are a second common online learning option. As of fall 2008 there are 21 states that have these types of schools. They are often charter schools, although there are also some non-charter, district-run programs that are available to students across the state.
Online learning policy developments
Late 2007 and the first half of 2008 saw many new policy developments related to online learning. Among the most notable were:
In Florida, the state legislature passed a new law that requires school districts to
provide virtual learning programs “to make online and distance learning instruction available to full-time virtual students in grades kindergarten through grade 8 by 2009-2010.” Florida Virtual School continued its rapid growth, reaching over 120,000 course registrations in 2007-2008.
Alabama became the second state in the country after Michigan to create an online
learning requirement, when the state board of education passed a resolution that “beginning with the ninth-grade class of 2009-2010 (graduating class of 2012-2013), students shall be required to take and receive a passing grade in one on-line/ technology enhanced course in either a core course (mathematics, science, social studies, or English) or an elective with waivers being possible for students with a justifiable reason(s).”
Wisconsin gained national attention when an appeals court ruled in December 2007
that the Wisconsin Virtual Academy (WIVA) violated state laws and was not eligible for state funding. To prevent online charter schools across the state from being denied funding and closing, the legislature responded by enacting Act 222, which makes changes to charter school, open enrollment, and teacher licensing laws to allow virtual charter schools in Wisconsin to operate with public funding.
South Carolina clarified the law passed in 2007 that had led to confusion as to
whether full-time online schools were allowed in the state. In fall 2008 the first three online charter schools are opening, joining the South Carolina Virtual School Program (the state-led, supplemental online program).
Hawaii and Wyoming both established task forces to research online learning options
for their states. Both reported to their respective state legislatures, which in 2008 passed legislation supportive of the task force recommendations. Wyoming created the Wyoming Switchboard Network to create and oversee online and other distance learning courses, while Hawaii’s legislation supports both a state-led supplemental program and full-time online schools.
There have been a few exceptions to the pattern of consistent growth in online programs. Both Connecticut and Delaware established state-led online programs in the past year, but budget cuts did not allow either program to grow nearly as large or as quickly as planned. Both are going forward with online courses in fall 2008, but with small numbers of students and courses. The experiences of the state-led programs in these states reflect concerns of such programs in other states that are dependent on yearly appropriations from the legislature and therefore also reliant on the health of state budgets and economies.
Growth of online programs
Many supplemental programs are continuing to grow rapidly, with nearly one-third reporting increases in number of course registrations of more than 50%. Full-time online schools are growing as well, but much of the growth in student numbers in full-time online
EXECUTIVE SUMMARY 10
schools represents new schools, instead of the growth of existing schools. When programs were asked if they were satisfied with their size and growth rate, they were split about evenly: 47% responded that they are satisfied, while 53% said they would like to grow more quickly. Of those who said they would like to grow more quickly, the most common reasons for slow growth was lack of funding (66%) and legislative restrictions (43%). Of the programs that cited lack of funding as a factor limiting growth, over three-quarters (79%) were supplemental programs. This suggests that the programs receiving public education FTE funds are more likely to be satisfied with funding than the programs that are dependent on other funding sources.
Conclusion
Online learning has the capacity to grow, and the early results demonstrate the benefits of students and parents being given the choice of a variety of learning options, from fully online courses at a distance, to classroom-based courses, with blended learning options in between. However, in many states today—despite the rapid growth so far—a real or potential barrier exists for students who seek an online course. These barriers are sometimes on the student side (related to access to online courses or the willingness of their school to grant credit for online courses they do take), or on the school side (related to funding or other limiting policies).
Funding is clearly one of the keys to the growth of online learning—perhaps the most important single factor. In addition to funding, one of the challenges in developing online learning policy is that the term “online learning” has different meanings for different people. Different online learning courses and programs can have very different levels of teacher involvement, computer technology (such as diagnostic assessments), real-time and asynchronous interaction, and face-to-face elements, making the development of appropriate policy prescriptions challenging. Policies to facilitate an increase in online options for students include:
Ensuring that students and parents are free to choose online courses and schools.
Encouraging schools of education to incorporate online instruction as part of the
curriculum for future teachers, to include pre-service training in teaching online, and creating additional professional development options for certified teachers.
Allowing teachers to teach across state lines by encouraging reciprocity of recognition
of teaching credentials.
Creating true national content standards so online content does not need to
demonstrate alignment with countless different content frameworks.
Revising accounting standards for funding to get away from count dates, seat time,
and other measures that don’t apply to the online environment.
Establishing some standard metrics for basic quality assurance and measurements,
such as consistent measures for course completions.
Online learning is growing rapidly, but continued growth requires specific policy and funding changes, including and in addition to those suggested above. These policy changes should focus on increasing educational choices and opportunities while ensuring quality and improved student achievement.
1
SECTION 1: NATIONAL SNAPSHOT AND THE YEAR IN REVIEW 12
National snapshot and the year in review
Late 2007 and the first half of 2008 saw the continued growth of online learning, in terms of new programs being created, existing programs growing, and new legislation being passed to facilitate further growth. As of fall 2008, all but a handful of states offer significant online learning opportunities for students.
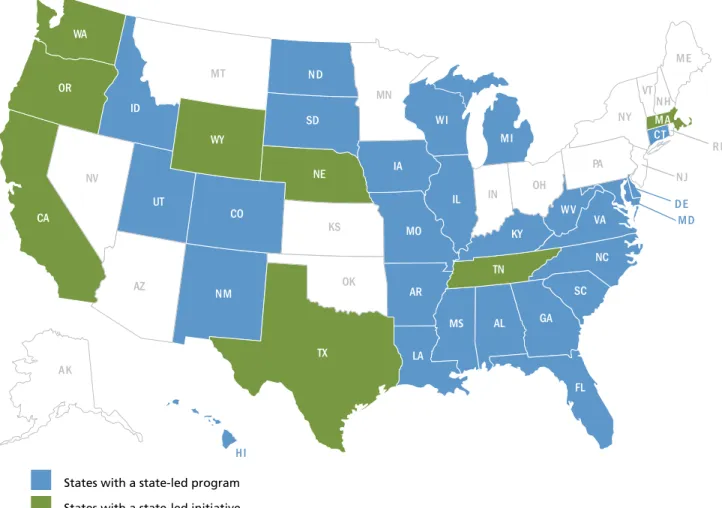
As shown in Figure 1:
Seventeen states offer significant supplemental
and full-time online options for
students (purple). Many of these states have both a state-led program and full-time, online schools. For example, Florida offers the supplemental Florida Virtual School, and the full-time Florida Connections Academy and Florida Virtual Academy.
Similarly, Colorado offers the state-led Colorado Online Learning, and numerous full-time district programs and charter schools.
Twenty-three states offer significant supplemental opportunities—but not full-time
(light blue). Most of these states have state-led programs, such as the Michigan Virtual School, Illinois Virtual School, and Virtual Virginia. Some of these states have a few full-time online options, such as the Chicago Virtual Charter School and the Traverse City (Michigan) School District, but these programs are not available to students across the state.
Four states offer significant full-time opportunities—but not supplemental (dark
blue). These states have extensive charter schools and/or district online programs, but do not have a state-led supplemental program that offers courses to students across the state.
In sum, as of fall 2008 there are 44 states that offer significant full-time or supplemental online learning options for students, and only six states that do not offer either of these.
What do we mean by “significant” online learning options?
There are now so many schools, districts, state agencies, and nonprofit organizations offering online courses at the K-12 level that tracking them all is nearly impossible, and all states have at least some minor online learning options. Our test for “significant” takes a student’s point of view and is based on the following question: If students (or their parents) from anywhere in the state are seeking a publicly funded online course, or full-time online school, are they likely to have access to these opportunities? The elements that go into answering that question are:
Do online schools and programs exist in the state? What percentage of school districts 1.
have a student in an online course?
Are online opportunities available to students across the entire state? 2.
Are they sufficiently large relative to the state’s population or otherwise 3.
prominent such that most students are likely to know about these options? States with significant supplemental state-led or multi-district online programs or initiatives States with significant full-time, multi-district programs
States with both States with neither
Figure 1: National Summary of How Online Learning is Being Implemented Across the Country WA OR ID MT UT NV AZ AK HI CO NM ND MN SD IA WI MI IN OH CT IL MS AL GA FL SC NC VA PA DE NJ RI MD WV KY MO AR LA CA WY NE KS TX OK NY VT ME TN MA NH
1
SECTION 1: NATIONAL SNAPSHOT AND THE YEAR IN REVIEW 14
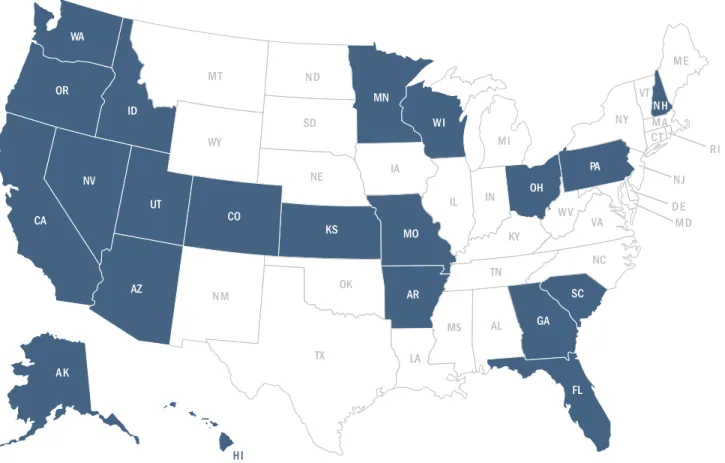
State-led programs and initiatives
State-led programs and initiatives continue to be an important online learning option for students in many states. As of fall 2008, 34 states offer state-led programs or initiatives that are designed, in most cases, to work with existing school districts to supplement course offerings for students. Examples of state-led programs (which provide full courses, teachers, and student support) include Florida Virtual School, Illinois Virtual High School, Michigan Virtual School, Idaho Digital Learning Academy, Georgia Virtual School, Kentucky Virtual School, and the Missouri Virtual Instruction Program. Examples of state-led initiatives, which provide online resources, or serve as a central clearinghouse for online courses, include the Washington Digital Learning Commons, Wyoming Switchboard Network, Texas Virtual School Network, and Oregon Virtual School District. Most state-led programs are:
High school level, with some middle school,
Supplemental—providing one or more courses to students enrolled elsewhere, and
Funded primarily by separate state appropriations rather than the per-pupil funding
formula.
States with a state-led program States with a state-led initiative
NH CA OR WA VT UT CO TX SD NE IA MO AR LA AL GA SC NC TN KY IL WV VA MD NJ CT ME MA MI FL ID NM DE RI MT ND HI AK MS WY AZ NV KS OK MN IN OH PA NY WI
Full-time, multi-district online schools
A second common online learning option for students are full-time online schools that are available throughout much, or all, of the state. As of fall 2008 there are 21 states that have these types of schools. They are often charter schools, although there are also some non-charter, district-run programs that are available to students across the state.
Figure 3: States with Full-time, Multi-district Online Programs
States with significant full-time, multi-district charter schools or district programs States without significant full-time, multi-district charter schools or district programs CA OR WA VT UT AZ CO TX SD NE KS OK MN IA MO AR LA AL GA SC NC TN KY IL IN OH PA WV VA MD NJ CT ME MA NY MI FL WI WY ID NV NM DE RI MT ND HI AK NH MS *
1
SECTION 1: NATIONAL SNAPSHOT AND THE YEAR IN REVIEW 16
Online learning policy developments
Late 2007 and the first half of 2008 saw many new policy developments related to online learning. Among the most notable were:
In Florida, the state legislature passed a new law that requires school districts to
provide virtual learning programs “to make online and distance learning instruction available to full-time virtual students in grades kindergarten through grade 8 by 2009-2010.” Following the lead established by the Florida Virtual School (FLVS), the School District Virtual Instruction Program (K-8) will be funded based on successful completions (there will still be a seat time component as providers under the new K-8 legislation will have to take attendance and adhere to a 180-day school year). FLVS continued its rapid growth, reaching over 120,000 course registrations in 2007-2008. Alabama became the second state in the country after Michigan to create an online
learning requirement, when the State Board of Education passed a resolution that “beginning with the ninth-grade class of 2009-2010 (graduating class of 2012-2013), students shall be required to take and receive a passing grade in one on-line/ technology enhanced course in either a core course (mathematics, science, social studies, or English) or an elective with waivers being possible for students with a justifiable reason(s).”1
Wisconsin gained national attention when an appeals court ruled in December 2007
that the Wisconsin Virtual Academy (WIVA), a charter school established by the Northern Ozaukee School District and affiliated with K12 Inc., violated state laws and was not eligible for state funding. To pre vent online charter schools across the state from being denied funding and closing, the legislature responded by enacting Act 222, which makes changes to charter school, open enrollment, and teacher licensing laws to allow virtual charter schools in Wiscon sin to operate with public funding. South Carolina clarified the law passed in 2007 that had led to confusion as to
whether full-time online schools were allowed in the state. In fall 2008 the first three online charter schools are opening, joining the South Carolina Virtual School Program (the state-led, supplemental online program).
Hawaii and Wyoming both established task forces to research online learning options
for their states. Both reported to their respective state legislatures, which in 2008 passed legislation supportive of the task force recommendations. Wyoming created the Wyoming Switchboard Network to create and oversee online and other distance learning courses, while Hawaii’s legislation supports both a state-led supplemental program and full-time online schools.
The legislatures in Kansas and Idaho both responded to concerns raised in state
audits about practices of a few online programs and oversight by state agencies. The laws created new reporting and oversight requirements and allowed the continued operation and growth of online programs.
Notably, in all the states that have experienced questions about the practices or oversight of online programs (via state audits or lawsuits), after the state legislature has reviewed the programs it has passed laws that allow the online options to continue. In cases such as Wisconsin and Colorado there were initial concerns that online schools would be shut
down (the result of the court case in Wisconsin) or that new schools would not be allowed (a suggested moratorium in Colorado). Instead, in Wisconsin, Colorado, Kansas, and Idaho, after the initial questions raised by the state audit were explored in more depth, the legislatures decided that oversight and reporting of online schools needed some changes, but overall the online programs were successfully serving students and filling an unmet educational need, and should be allowed to continue and grow.
There have been a few exceptions to the pattern of consistent growth in online programs. Both Connecticut and Delaware established state-led online programs in the past year, but budget cuts did not allow either program to grow nearly as large or as quickly as planned. Both are going forward with online courses in fall 2008, but with small numbers of students and courses. The experiences of the state-led programs in these states reflect concerns of such programs in other states that are dependent on yearly appropriations from the legislature and therefore also reliant on the health of state budgets and economies.
2
SECTION 2: SURVEY RESULTS: ONLINE PROGRAMS AND PRACTICES 18
Survey results: online programs
and practices
In June 2008 Keeping Pace distributed an extensive web-based survey and received 114 responses. Respondents were a varied mix of state-led programs, district programs, charter schools, and other organization types.
Size of supplemental programs
Supplemental programs are widely varied in size, with many small programs and fewer large programs. The distribution shows lots of small programs with 1,000 or fewer course registrations, and a much smaller number of large programs with 10,000 or more course registrations. The smallest programs, with 500 or fewer course registrations per year, tend to be run by districts or other local education agencies (LEAs); 64% of the programs with fewer than 500 course registrations fall into this category. At the other extreme, nearly all the supplemental programs with more than 5,000 course registrations are state-led programs such as the programs in Florida, Michigan, Alabama, Louisiana, and Idaho. The one large program exception is the Virtual High School Global Consortium, which works directly with school districts across many states and internationally.
0 5 10 15 20 25 Under 1,000 1,000-4,999 5,000-9,999 10,000 or more
Number of Schools Reporting
Number of Course Registrations
0 5 10 15 20 25 30 35 Decline > 50% Decline 25-50% Decline 10-25% Decline 5-10% No change (within 5%) Increase 10-25% Increase 25-50% Increase > 50%
Percent (%) of Schools Reporting Percent (%) of Schools Reporting
0 5 10 15 20 25 30 35 40 45 Decline > 50% Decline 25-50% Decline 10-25% Decline 5-10% No change (within 5%) Increase 10-25% Increase 25-50% Increase > 50% Percent of T
otal Course Registrations
Percent (%) of Schools Reporting
0 5 10 15 20 25 30 35 40 45 50 55 0% Don’t Know 1-15% 16-30% 31-45% 46-60% 61-75% 75-90% 91-100% 11 0 26 5 1 2 2 0 0 n 7 11 10 9 2 5 1 3 1 n
Number of Schools Reporting
Full-Time Equivalency (FTE)
21
15
11
4
0 5 10 15 20 25 Under 100 100-999 1,000-1,999 2,000-2,999 3,000-3,999 4,000 or more9
18
2
4
4
4
K 13.2% Fifth 21.2% Fourth 18.0% Third 14.9% Second 16.3% First 16.3% Advanced PlacementCredit Recovery Courses
KEEPING PACE WITH K – 12 ONLINE LEARNING | WWW.KPK12.COM 19
Size of full-time schools
The size of full-time schools is based on the total number of students enrolled, or FTE. The largest of these in the survey were the Pennsylvania Cyber Charter School, with 7,798 students, and the Ohio Virtual Academy, with 5,225 students. Nearly two-thirds had fewer than 1,000 students. 0 5 10 15 20 25 Under 1,000 1,000-4,999 5,000-9,999 10,000 or more
Number of Schools Reporting
Number of Course Registrations
0 5 10 15 20 25 30 35 Decline > 50% Decline 25-50% Decline 10-25% Decline 5-10% No change (within 5%) Increase 10-25% Increase 25-50% Increase > 50%
Percent (%) of Schools Reporting Percent (%) of Schools Reporting
0 5 10 15 20 25 30 35 40 45 Decline > 50% Decline 25-50% Decline 10-25% Decline 5-10% No change (within 5%) Increase 10-25% Increase 25-50% Increase > 50% Percent of T
otal Course Registrations
Percent (%) of Schools Reporting
0 5 10 15 20 25 30 35 40 45 50 55 0% Don’t Know 1-15% 16-30% 31-45% 46-60% 61-75% 75-90% 91-100% 11 0 26 5 1 2 2 0 0 n 7 11 10 9 2 5 1 3 1 n
Number of Schools Reporting
Full-Time Equivalency (FTE)
21
15
11
4
0 5 10 15 20 25 Under 100 100-999 1,000-1,999 2,000-2,999 3,000-3,999 4,000 or more9
18
2
4
4
4
K 13.2% Fifth 21.2% Second 16.3% First 16.3% Advanced PlacementCredit Recovery Courses
Figure 5: Size of Full-Time Schools (FTE), School Year 2007-2008
Comparing size of supplemental programs
and full-time schools
Although the full-time schools may look smaller at first glance than the supplemental programs, the numbers are not one-to-one comparisons. The full-time programs count student FTE, which are often the equivalent of about ten or twelve one-semester courses in a year. The ranges of sizes of supplemental and full-time programs are roughly the same.
2
SECTION 2: SURVEY RESULTS: ONLINE PROGRAMS AND PRACTICES 20
Growth rates
Many supplemental programs are continuing to grow rapidly, with nearly one-third increasing more than 50% annually.
0 5 10 15 20 25 Under 1,000 1,000-4,999 5,000-9,999 10,000 or more
Number of Schools Reporting
Number of Course Registrations
0 5 10 15 20 25 30 35 Decline > 50% Decline 25-50% Decline 10-25% Decline 5-10% No change (within 5%) Increase 10-25% Increase 25-50% Increase > 50%
Percent (%) of Schools Reporting Percent (%) of Schools Reporting
0 5 10 15 20 25 30 35 40 45 Decline > 50% Decline 25-50% Decline 10-25% Decline 5-10% No change (within 5%) Increase 10-25% Increase 25-50% Increase > 50% Percent of T
otal Course Registrations
Percent (%) of Schools Reporting
0 5 10 15 20 25 30 35 40 45 50 55 0% Don’t Know 1-15% 16-30% 31-45% 46-60% 61-75% 75-90% 91-100% 11 0 26 5 1 2 2 0 0 n 7 11 10 9 2 5 1 3 1 n
Number of Schools Reporting
Full-Time Equivalency (FTE)
21
15
11
4
0 5 10 15 20 25 Under 100 100-999 1,000-1,999 2,000-2,999 3,000-3,999 4,000 or more9
18
2
4
4
4
K 13.2% Fifth 21.2% Fourth 18.0% Third 14.9% Second 16.3% First 16.3% Advanced PlacementCredit Recovery Courses
Figure 6: Annual Change in Course Registrations in Supplemental Programs
Unlike the supplemental programs, the biggest growth category for the full-time programs is no change (within 5% of the previous year). Of the 21 schools that did change in size, 17 grew—and 10 of the 17 grew by 25% or more. The total number of full-time students is growing along with the continued increase in the number of new full-time programs.
0 5 10 15 20 25 Under 1,000 1,000-4,999 5,000-9,999 10,000 or more
Number of Schools Reporting
Number of Course Registrations
0 5 10 15 20 25 30 35 Decline > 50% Decline 25-50% Decline 10-25% Decline 5-10% No change (within 5%) Increase 10-25% Increase 25-50% Increase > 50%
Percent (%) of Schools Reporting Percent (%) of Schools Reporting
0 5 10 15 20 25 30 35 40 45 Decline > 50% Decline 25-50% Decline 10-25% Decline 5-10% No change (within 5%) Increase 10-25% Increase 25-50% Increase > 50% Percent of T
otal Course Registrations
Percent (%) of Schools Reporting
0 5 10 15 20 25 30 35 40 45 50 55 0% Don’t Know 1-15% 16-30% 31-45% 46-60% 61-75% 75-90% 91-100% 11 0 26 5 1 2 2 0 0 n 7 11 10 9 2 5 1 3 1 n
Number of Schools Reporting
Full-Time Equivalency (FTE)
21
15
11
4
0 5 10 15 20 25 Under 100 100-999 1,000-1,999 2,000-2,999 3,000-3,999 4,000 or more9
18
2
4
4
4
K 13.2% Fifth 21.2% Fourth 18.0% Third 14.9% Second 16.3% First 16.3% Advanced PlacementCredit Recovery Courses
Figure 7: Annual Change (FTE) in Full-Time Programs
Many of the fastest growing programs are also among the largest; it’s not the case that programs grow to a certain size and then stagnate. Among the full-time programs, the second largest school in the survey grew by more than 25%, and among the supplemental programs, the largest (FLVS) grew by more than 50%. In fact, the history of FLVS shows sustained high growth rates over time.
KEEPING PACE WITH K – 12 ONLINE LEARNING | WWW.KPK12.COM 21
Evolution of online programs
When programs were asked if they were satisfied with their size and growth rate, they were split about evenly: 47% responded that they are satisfied, while 53% said they would like to grow more quickly. Of those who said they would like to grow more quickly, the most common reasons for slow growth was lack of funding (66%) and legislative restrictions (43%). Respondents could choose more than one reason, so in some cases the legislative restriction may have been lack of funding. Of the programs that cited lack of funding as a factor limiting growth, over three-quarters (79%) were supplemental programs. This suggests that the programs receiving public education FTE funds are more likely to be satisfied with funding than the programs that are dependent on other funding sources.
Counting the entire group, including those who are satisfied with their growth, 12% cited IT/infrastructure limitations, 9% cited lack of courses or course content, and 4% cited lack of highly qualified staff as factors limiting growth. It appears that teachers, content, and technology are not significantly limiting factors. In the case of the IT infrastructure limitations, based on the comments it appears that these programs are supplemental and rely on local schools to provide computer and Internet access for students, and in some cases they are not able to get enough computers for the students.
Types of students and courses
In the early days of online learning there was a common perception that online courses in supplemental programs were primarily for advanced or honors students. Whether or not that was ever true, it is clear today that these programs serve a variety of students. Programs were asked the percentage of students taking Advanced Placement and credit recovery courses, and the results suggest that there are more students in credit recovery courses than in AP courses. The results are complicated because what constitutes a credit recovery course is not as clear-cut as an AP course; this confusion is shown by the 22% of responding programs that don’t know what percentage of their course registrations are for credit recovery. 0 5 10 15 20 25 Under 1,000 1,000-4,999 5,000-9,999 10,000 or more
Number of Schools Reporting
Number of Course Registrations
0 5 10 15 20 25 30 35 Decline > 50% Decline 25-50% Decline 10-25% Decline 5-10% No change (within 5%) Increase 10-25% Increase 25-50% Increase > 50%
Percent (%) of Schools Reporting Percent (%) of Schools Reporting
0 5 10 15 20 25 30 35 40 45 Decline > 50% Decline 25-50% Decline 10-25% Decline 5-10% No change (within 5%) Increase 10-25% Increase 25-50% Increase > 50% Percent of T
otal Course Registrations
Percent (%) of Schools Reporting
0 5 10 15 20 25 30 35 40 45 50 55 0% Don’t Know 1-15% 16-30% 31-45% 46-60% 61-75% 75-90% 91-100% 11 0 26 5 1 2 2 0 0 n 7 11 10 9 2 5 1 3 1 n
Number of Schools Reporting
Full-Time Equivalency (FTE)
21
15
11
4
0 5 10 15 20 25 Under 100 100-999 1,000-1,999 2,000-2,999 3,000-3,999 4,000 or more9
18
2
4
4
4
K 13.2% Fifth 21.2% Second 16.3% First 16.3% Advanced PlacementCredit Recovery Courses
3
SECTION 3: NOTES FROM THE FIELD 22
Notes from the field
Each year we ask a few researchers and practitioners to contribute articles to Keeping Pace. Although in some cases these articles are written by Keeping Pace sponsors, they are not primarily based on the research done for Keeping Pace, and often reflect the experience of the authors in a specific area of expertise.
Special Education in Online Learning
Marjorie Rofel and Mickey Revenaugh
Marjorie Rofel is Director of Special Education, and Mickey Revenaugh is Vice President for State Relations for Connections Academy.
Special education provides a unique lens on current state online learning policy and the evolution of online learning itself. Experienced online providers have now been working with special needs students for years, and have collectively seen almost every possible permutation in approach to special education. Some trends worth noting include:
Online learning is now officially on the radar screen of the National Association of
State Directors of Special Education, which issued a special report in January 2008 entitled “Demystifying Special Education in Virtual Charter Schools.”2 Structured
as a series of questions and answers under headings such as “Service Provision” and “Assessment and Accountability,” the report captures the typical practices of cyberschools around the country while referring back to relevant law. “Many view virtual schools with reserved puzzlement and the idea of special education and related services in this environment with outright skepticism,” note authors Lauren Morando Rhim and Julie Kowal. “Our examination of special education in the virtual environment dispelled many misconceptions about what exactly virtual education is and opportunities this mode of instruction can provide to students across the spectrum of disability categories.”
Although the default approach in many states is to leave responsibility for special
education with the virtual student’s district of residence, implementation varies so radically as to raise occasional concerns about disenfranchisement. While some state education agencies, such as Missouri’s, use their leverage over the districts, the online learning program, and special education oversight to ensure active provision of services for virtual learners, other states leave virtual programs and districts to work it out on their own, with decidedly mixed results. Where parents of special needs students have the option to leave their traditional school structure and enroll full-time in an online program, they are often reluctant to reconnect with the district for special education services, and may choose to exit special education altogether. In supplemental online programs, the student’s district of residence often remains the primary special education services provider. The online teacher is responsible for
making accommodations within the course, but communication must occur with the district of residence to ensure that special needs are known.
As online learning matures as a field, we are seeing more diverse disabilities among
the special education students choosing virtual schools. In any public school
setting, specific learning disabilities such as dyslexia along with speech and language disorders are the most common qualifying issues for students in special education, and the same has been true of virtual schools. However, the data suggest that virtual schools, as they become increasingly mainstream, are beginning to serve more students with visual impairments, hearing impairments, and other “low incidence” disabilities.
Autism and related issues such as Asperger’s syndrome are continuing to increase
as disabilities presented by virtual school students. While some of the increase may be due to more public attention to these disorders and therefore more frequent diagnoses, virtual educators can attest to the effectiveness of the online environment for many students with autism spectrum disorders. Working in an individualized environment free from the sometimes agonizing social interactions of the regular classroom can be very beneficial for children with autism. Because parents of children with these conditions are often in touch with one another, when one such child has a positive experience in a virtual school, the parents of others are likely to seek the same.
Online learning provides some advantages over physical schools in addressing the
needs of special education students in some cases, and virtual schools are becoming more sophisticated in their use of technology for providing special education services. In addition to ensuring that students have adaptive technology for their own use, online special educators are using webcams and microphones to provide speech and language services, and web conferencing software for direct instruction as required by a student’s Individualized Education Plan (IEP).
Despite this progress in serving students with special needs, the remarkable growth in online learning presents some new challenges. In particular, as more and more students split their time between a physical school and an online school or take individual online courses—often taught by adjunct faculty with whom they interact for that class only—how do we ensure that students’ IEPs are being addressed? Communication between physical schools and online schools, and creative thinking about meeting students’ special needs, is essential in order to realize the tremendous potential that virtual learning represents for special learners.
3
SECTION 3: NOTES FROM THE FIELD 24
Communication in Online Programs
Susan Lowes, Ray Rose, and Donna E. Scribner
Susan Lowes is Director of Research and Evaluation at the Institute for Learning Technologies at Teachers College, Columbia University. Ray Rose is the Director of Programs and Partnerships, MentorNet. Donna E. Scribner is Chief Learning Officer for the Virtual High School Global Consortium. A longer version of this research will appear as part of a NACOL Research Brief on Quality and Effectiveness in K-12 Online Teaching, to be published in fall 2008.
A key component of online education policy and practice is around communication: teacher-student, teacher-parent, and/or student-student communication. To learn more about communication in online programs, the NACOL research committee conducted a survey to determine:
Do online schools have written policies regarding communication between teachers
and students, teachers and parents/guardians, and students with students?
If so, what do these policies cover? In particular, are they setting expectations around
the frequency and/or the content of communications?
This survey was different than the Keeping Pace survey. The 81 valid responses overlapped with the responses to Keeping Pace, but there were numerous programs in one survey or the other, but not both. Similar to the Keeping Pace survey, the full range of online organization types (state-led, full-time online charters, district programs) was represented.
Key findings include:
Almost 85% of programs that responded reported that they had at least one type of
policy in place, with over 40% having all three types of policies (covering teacher-student, teacher-parent, and student-student communication).
More than 80% indicated that they had policies in place regarding the kind, or the
amount, of teacher communication with students, while an additional 9% stated that they were planning to institute such policies but had not yet done so.
On the other hand, only 53% reported that they had policies in place regarding the
amount and content of teacher communication with parents, although 16% said they were planning to create such policies.
58% said they had policies in place regarding student-to-student communication,
with eight saying they planned to do so.
It appears that those that reported that they did not have student-student policies were generally schools that do not have, or do not emphasize, student-to-student
communication, particularly those whose courses are self-paced, with the students keeping to their own schedules.
Teacher-student communication
Most policies regarding teacher-student communication covered both the frequency and the content of the contact, with 85% having policies about frequency of contact via email, 77% having policies regarding frequency of contact by phone, and 54% having policies regarding
frequency of contact through discussion forums. Forty-seven percent of the responders reported that they had policies about frequency of contact through synchronous platforms (such as Elluminate, NetMeeting, Wimba). The inclusion of these (relatively) new online tools is an indication of how rapidly the field of online learning is changing and adapting to emerging technologies.
In addition, 82% indicated that they have policies in place regarding the content of teacher contact with students, and 68% have policies regarding the content of student contact with the teacher.
In open-ended responses to a question that asked about the content of these policies, it was clear that the method of responding (synchronous, asynchronous, phone, email, message board) was not as important as the timeframe. The requirements for the quantity of contact between teacher and student, as well as the mode, varied widely: some reported that they expected a minimum of twice a month, others once a week, others two or three times a week, and others daily. Some required that this be by phone, but for others the modes of contact included email, discussion forums, and synchronous platforms, and most schools seem to require their teachers to use more than one of these (i.e., email and phone, or phone and synchronous platform). Most required that teachers respond to students within a specific time frame—generally 24 hours. Most also require teachers to get in touch with their students within one or two days of enrollment. Schools tend to require more contact with younger students, and most reported that, aside from the response-time requirement, they expected that the frequency of contact would vary by the age of the students and the content of the course.
Teacher-parent communication
A large majority (74%) of the responders reported that their policies about teacher-parent communication addressed frequency of contact, both via phone and email. On the other hand, both synchronous platforms and discussion forums are clearly less common means of communicating with parents, and only 26% reported that their policies covered synchronous platforms, while only 14% reported that they had policies in place for discussion forums.
In many schools, teachers are required to speak to parents regularly to review student progress, but the frequency varies widely, from once a quarter, to once a month, every two weeks, or weekly. However, all require much more frequent contact with students who are doing poorly or who have high rates of absenteeism.
Student-student communication
Unlike communication involving teachers, which was more often about frequency than about content, most student-student communication policies center on content. Forty percent of schools reported that they had their own policies regarding student-student communication, while 9% followed the site-based school’s Acceptable Use Policies (AUP); and 10% said they used both. Some noted that while they required that student discussions use appropriate language, they also noted the discussion must be relevant to the topic and be positive in tone. One added that the nature and size of images in personal profiles was also subject to proper etiquette.
3
SECTION 3: NOTES FROM THE FIELD 26
Evaluation in Online Learning
Liz Pape, Matthew Wicks, Christopher Brown, and W. Patrick Dickson
Liz Pape is CEO of the Virtual High School Global Consortium. Matthew Wicks is President, Matthew Wicks & Associates, Inc. Chris Brown is Senior Vice President of Research, Pearson. Patrick Dickson is Professor of Educational Psychology & Educational Technology at Michigan State University.
The rise in the number of online programs, of various organizational types, sizes, and educational approaches, raises numerous questions for educators and policymakers around a central idea: How good are these programs? Specific questions about student achievement could include the following, however an online program evaluation could focus on issues beyond student outcomes and achievement, such as equity, access, and development of online teachers:
What population(s) of students are being served?
What level of student learning is being achieved?
Whether student outcomes have improved or not, why is this so?
How can student outcomes be further improved?
Program administrators can help answer these questions through a variety of research and evaluation efforts, and policymakers are increasingly expecting online programs to report on their results. However, there are a variety of program evaluation considerations that should be addressed at the start of implementing an evaluation.
Internal vs. external evaluation
Evaluation processes can either be internal (conducted by internal staff) or external
(conducted by an outside individual or team). External evaluations tend to look at an entire program and provide the benefit of bringing in an outside perspective that may uncover potential weaknesses or add credibility to results. External evaluators also may receive more unfiltered feedback from a variety of stakeholders (parents, teachers, local school administrators) than the program administrators might receive. The main drawback to external evaluation is time and expense, both in hiring someone from outside the program and also in the need for the evaluator to become familiar with the program. Some programs combine internal evaluations that are done every semester with external evaluations that are done every year (or less often). The external evaluation can be used to help establish data gathering procedures for ongoing internal evaluations. Regardless of whether the evaluation is internal or external, it should be an ongoing part of a culture of continuous improvement.
What to evaluate
An evaluation should be closely tied to the stated mission of the online program, to address the question of how well the program is meeting its goals. It might also address issues identified during program implementation. If the goal of an online program is to give students more opportunities for recovering course credits in order to graduate, then two evaluation measures could be the number of credit recovery courses being offered, and the graduation rate for students in those courses. If the mission of the online program is
to increase 21st century learning opportunities for a district’s students, possible evaluation
criteria include 1) the number of new courses available to students; 2) the increase in student proficiency in use of Web 2.0 tools; and 3) the increase in teachers’ use of Web 2.0 tools in classroom and online instruction. It is helpful to categorize the evaluation metrics into immediate, intermediate and longer-term outcomes and then to ensure that the evaluation measures all three types, with different expectations for pace of change. An immediate outcome might be students’ increased use of an electronic library or instructors’ increased use of background content resources, whereas a longer-term outcome might be an increased graduation rate. Experienced evaluators can provide a number of possible variables to consider in an evaluation.
Who should be involved
In order to ensure that evaluation makes a difference in practice, it is crucial to the success of any evaluation to ensure that all stakeholders are sufficiently consulted and that they buy in to the evaluation process. This provides better inputs, enhances the quality of the results, and in most cases increases the opportunities to use the results. For evaluations that are part of a continuous improvement approach, this is essential.
When to evaluate
One of the benefits of an on-going evaluation process is the ability to quickly gather the critical data which measure program success, in order to make needed changes on an on-going basis. Semester-based data (such as course completion rates, student drop rates, student achievement levels, technical and administrative support satisfaction rates) should be quickly calculated so that needed changes can be identified and implemented as soon as possible. Understanding how to effectively develop and use an evaluation program can not only help to answer questions about the effectiveness of an online program, but can also play a crucial role in improving a program.
The future of evaluation in online learning
The online environment offers an exceptional opportunity for enhancing student
learning by using the rich data automatically gathered by learning management systems, and offers opportunities for continuous assessment and improvement. Students are in a sense “entering their own data” in real time, and this data is collected by the learning management system. Gathering such fine-grained information about students in traditional face-to-face classrooms is almost impossible and would certainly cost a fortune.
Data routinely gathered by the learning management system include the time of day, day of week, duration of students’ logins, completion of assignments, scores on quizzes, and participation in discussion forums. These data can provide students, instructors, course designers, and program administrators a rich description of overall student activity in a course and detailed “observations” of individual students. Such real-time data can be immediately “actionable” in the sense of enabling an instructor to make data-informed decisions about how the course is doing overall and how individual students
3
SECTION 3: NOTES FROM THE FIELD 28
Research at the Michigan Virtual School has shown that even such simple measures as frequency of activity (number of clicks) were highly predictive of student success.3 This
research also showed the wide variation in patterns of student activity in the trajectories of individual students over time and the variability among online courses.
Until the advent of online courses, administrators and teachers did not have such rich, real-time data at their fingertips. Because online learning is still quite new, it is not surprising that educators are only beginning to understand how to make use of these data to provide fast feedback to students and mid-course corrections based on overall patterns of student performance. In addition, although the data are available, the current data displays are often poorly designed for use by busy teachers.
By focusing increased attention on understanding and using data on individuals and courses with a view to informing pedagogical decisions while the courses are in process, we may gain greater insight into what makes a course “good” for which individual students than can ever be inferred from evaluations based on end-of-course data alone. Most importantly, some changes can be incorporated immediately, while others are part of ongoing
improvements to course design and teaching practices.
An International Perspective on K-12 Online Learning
Allison Powell
Allison Powell is Vice President, North American Council for Online Learning. This article is based on information from an international survey of online learning initiatives conducted by NACOL.
In the United States there is increasing acceptance of online learning in grades K-12, as more and more students and parents choose the benefits and convenience of online courses and schools. Many people, including policymakers and educators, don’t realize the extent to which online learning is being implemented in countries across the world.
Research has been done on several virtual schools in North America; however, relatively little information has been made available in the U.S. about current K-12 online learning initiatives in other countries. Multi-billion dollar deals and national e-learning plans and initiatives are being developed to bring online learning to K-12 students all over the world. A few examples are highlighted below:
In September 2007, the UK and China signed a deal to create e-learning content for
20 million Chinese students to access content beginning in the spring of 2008. With this deal, education is now seen as a top export for the UK, bringing in over £28bn for the economy, more than the car and financial services industries.4
New Zealand, Hong Kong, and Singapore have developed national Information and
Communication Technology (ICT) plans with sections on how to effectively integrate e-learning throughout their individual nation’s K-12 education systems.
In Hong Kong’s
IT in Education Strategy 2004 plan, the development of
e-Learning in local primary and secondary schools in the next few years was discussed.5 In Hong Kong, they believe that e-learning is not likely to take over 3 Dickson, W. P. (2005). Toward a deeper understanding of student performance in virtual high school courses: Using quantitative
analyses and data visualization to inform decision making. Report submitted to the Michigan Virtual University, July 21, 2005.
4 UK and China Sign e-Learning Deal. September 24, 2007. http://news.bbc.co.uk/1/hi/education/7010282.stm 5 http://www.emb.gov.hk/index.aspx?langno=1&nodeID=2497
face-to-face teaching; however, the use of Information Technology, including e-learning, is enhancing student learning and is practiced daily in Hong Kong schools.
The New Zealand Ministry of Education’s
Enabling the 21st Century Learner:
An e-Learning Action Plan for Schools 2006-2010 provides multiple goals for
implementing e-learning within the schools and supporting a wider range of digital and ICT tools. They believe e-learning has the potential to transform the way students learn and want to reorient their educational system away from the organization and bring the learner to the center of the system by personalizing each student’s learning. They believe they can do this by providing a flexible system using online learning.6
At the turn of the century, Singapore’s Ministry of Education also decided to
move towards a more ability-driven and learner-centered mode of education. The second phase of the country’s ICT Masterplan, which was launched in 2003, focused on students and teachers using online tools to discuss, research, and develop technology for learning.7 From this plan, the country has already
implemented a nationwide learning management system and as of November 2006, 100% of secondary students and 85% of primary schools (grades 1-6) were using it for teaching and learning on a daily basis.8
Several other countries such as Canada, Australia, Turkey and Mexico have integrated successful models of virtual schools and online learning for students in their K-12 education systems. Highlights of these and several other countries can be found in An International
Perspective of K-12 Online Learning: A Summary of the 2006 NACOL International E-Learning Survey9 which identified online learning initiatives and projects in these countries. While
the size, government and policies related to online learning across the globe vary, we can learn from others processes and experiences, both positive and negative, for implementing successful e-learning programs and policies within our schools in order to build new and grow current online learning programs in different environments.
The Virtual School Clearinghouse
Rick Ferdig
Rick Ferdig is Associate Professor and University Research Foundation Professor in Educational Technology at the University of Florida.
Access to data can fundamentally change the quality of service a virtual school provides to its students, teachers, parents, mentors, and administrators. Unfortunately, according to research by my colleagues and I at the University of Florida, many virtual schools do not currently collect or analyze data outside of simple reporting measures (e.g. how many students took classes). Those that do collect data may only focus on one or two areas of data collection rather than attempting to analyze a broad spectrum of data to improve
6 New Zealand Ministry of Education. (2006). Enabling the 21st Century Learner: An e-Learning Action Plan for Schools 2006-2010.
Wellington, New Zealand: Learning Media Limited
7 Singapore Ministry of Education. (2003). Masterplan II for ICT in Education. http://www3.moe.edu.sg/edumall/mp2/mp2.htm 8 Powell, A. and Patrick, S. (2006). An International Perspective of K-12 Online Learning: A Summary of the 2006 NACOL International
E-Learning Survey. Vienna, VA: North American Council for Online Learning
3
SECTION 3: NOTES FROM THE FIELD 30
their practice. In response to this need, the University of Florida team was funded by AT&T Foundation to create the Virtual School Clearinghouse (http://vs.education.ufl.edu). The Virtual School Clearinghouse serves four main audiences: a) virtual schools; b) virtual school researchers; c) practitioners; and d) the general public.
Virtual schools
The main goal of the project is to help virtual schools collect and analyze data. A virtual school leader can log in to the site and download a data template. After filling in any or all of the variables, the leader can upload the data file to the site and instantly analyze that data. There are currently over 70 reports that can be run depending on the amount of data that was uploaded. Many schools that collect data generally only focus on simple student data and teacher data. This enhanced data structure not only helps gather additional data from teachers and students, it also helps virtual schools understand the value of the course (e.g. who created it), the course instance (e.g. what course was offered, when, and where), various entities (e.g. schools that send students for various courses), and the role of the other (e.g. administrators, mentors, and parents). Virtual schools that use this free resource have instant access to reports ranging from gender and race to special needs, and from course averages to teacher effectiveness.
Virtual school researchers
In 2004, a report was released that documented a relative dearth of research related to teaching and learning in K-12 virtual schools. Since that time, a new research body has emerged and a foundation for understanding the field is beginning to take shape. A second goal of the Clearinghouse is to provide a repository of information for those interested in research on teaching and learning in K-12 virtual schools. Any public user can freely access the site to view a bibliography (currently with almost 300 article references), a list of virtual school journals, and a list of virtual school research websites. Any user that creates a free username can also add to the database repository and can make comments on specific articles, websites, or journals.
Practitioners
In order to improve teaching and learning in K-12 virtual schools, it is critical that research findings are shared with those involved in the day-to-day activities of virtual schooling. The repository is an excellent location for researchers to share their findings with other researchers and with practitioners and policymakers. Additionally, the Clearinghouse has a Videos/Media feature. This section of the website provides media (e.g. audio and video) related to best practices in virtual schooling, important topics for policymakers and practitioners, and instructional videos for improving virtual school teaching.
The general public
Although virtual schooling numbers continue to rise, K-12 virtual schooling is new to many in the general public. A third goal of the Clearinghouse is to provide a location for the parents, teachers, administrators, and others who might be new to virtual schooling to gain in-depth knowledge about teaching and learning online. The article repository and the media feature are excellent links to share with those who might be new to teach and learning online.