Banco Central de Chile
Documentos de Trabajo
Central Bank of Chile
Working Papers
N° 542
Diciembre 2009
A NETWORK MODEL OF SUPER-SYSTEMIC
CRISES
Prasanna Gai
Sujit Kapadia
La serie de Documentos de Trabajo en versión PDF puede obtenerse gratis en la dirección electrónica:
http://www.bcentral.cl/esp/estpub/estudios/dtbc. Existe la posibilidad de solicitar una copia impresa con un costo de $500 si es dentro de Chile y US$12 si es para fuera de Chile. Las solicitudes se pueden hacer por fax: (56-2) 6702231 o a través de correo electrónico: [email protected].
Working Papers in PDF format can be downloaded free of charge from:
http://www.bcentral.cl/eng/stdpub/studies/workingpaper. Printed versions can be ordered individually for US$12 per copy (for orders inside Chile the charge is Ch$500.) Orders can be placed by fax: (56-2) 6702231 or e-mail: [email protected].
BANCO CENTRAL DE CHILE
CENTRAL BANK OF CHILE
La serie Documentos de Trabajo es una publicación del Banco Central de Chile que divulga los trabajos de investigación económica realizados por profesionales de esta institución o encargados por ella a terceros. El objetivo de la serie es aportar al debate temas relevantes y presentar nuevos enfoques en el análisis de los mismos. La difusión de los Documentos de Trabajo sólo intenta facilitar el intercambio de ideas y dar a conocer investigaciones, con carácter preliminar, para su discusión y comentarios.
La publicación de los Documentos de Trabajo no está sujeta a la aprobación previa de los miembros del Consejo del Banco Central de Chile. Tanto el contenido de los Documentos de Trabajo como también los análisis y conclusiones que de ellos se deriven, son de exclusiva responsabilidad de su o sus autores y no reflejan necesariamente la opinión del Banco Central de Chile o de sus Consejeros.
The Working Papers series of the Central Bank of Chile disseminates economic research conducted by Central Bank staff or third parties under the sponsorship of the Bank. The purpose of the series is to contribute to the discussion of relevant issues and develop new analytical or empirical approaches in their analyses. The only aim of the Working Papers is to disseminate preliminary research for its discussion and comments.
Publication of Working Papers is not subject to previous approval by the members of the Board of the Central Bank. The views and conclusions presented in the papers are exclusively those of the author(s) and do not necessarily reflect the position of the Central Bank of Chile or of the Board members.
Documentos de Trabajo del Banco Central de Chile Working Papers of the Central Bank of Chile
Agustinas 1180
Documento de Trabajo
Working Paper
N° 542
N° 542
A NETWORK MODEL OF SUPER-SYSTEMIC
CRISES
Prasanna Gai
Sujit Kapadia
Resumen
Si bien los países avanzados han podido sortear múltiples shocks financieros en los últimos años, los sucesos que desencadenó la crisis hipotecaria de agosto del 2007 han tenido un alcance “supersistémico” al alcanzar a las instituciones financieras de las principales economías y a otras tan lejanas como Islandia y Nueva Zelanda. Aquí aplicamos técnicas de red para desarrollar un marco analítico para estudiar el contagio financiero que aíslan la probabilidad de contagio de su posible propagación. Nuestros resultados sugieren que un sistema financiero complejo puede ser robusto y a la vez frágil por naturaleza. Bajo supuestos plausibles, la mayor conectividad implícita en instrumentos financieros novedosos tales como derivados crediticios, reduce la probabilidad de contagio, pero puede multiplicar significativamente su impacto en el sistema financiero cuando ocurre un problema.
Abstract
Although the financial systems of advanced countries have weathered numerous shocks in recent years, the events triggered by the sub-prime crisis of August 2007 have been “super-systemic” in scope, enveloping financial institutions across the major economies as well as far away Iceland and New Zealand. In this paper, we apply network techniques to develop a framework for analyzing financial contagion that isolate the probability of contagion from its potential spread. Our results suggest that complex financial systems may be robust-yet-fragile in nature. Under plausible
assumptions, the greater connectivity implied by new financial instruments (e.g., credit derivatives) reduces the likelihood of contagion. But the impact on the financial system, in the event of
problems, can be on a significantly larger scale than before.
______________
We are grateful to Jason Dowson for excellent research assistance. We would also like to thank Michael Bordo, Fabio Castiglionesi, Geoff Coppins, Avinash Dixit, Andy Haldane, Simon Hall, Jorge Selaive, Gabriel Sterne, Garry Schinasi, and seminar participants at the Bank of England and the 12th Annual Conference of the Central Bank of Chile on "Financial Stability, Monetary Policy and Central Banking" (Santiago, 6-7 November 2008) for helpful comments and suggestions. This paper represents the views of the authors and should not be thought to represent those of the Bank of England or Monetary Policy Committee members. Prasanna Gai: E-mail address: [email protected]. Sujit Kapadia E-mail adddress: [email protected].
1
Introduction
Are financial systems shock absorbers or shock amplifiers? Policymakers and academics have long remained divided over this fundamental question. On one hand, some contend that financial innovation and integration make the financial world a safer place (Greenspan, 1999); while others argue the opposite by appealing to the same driving forces (Rajan, 2005). On this view, recent rapid financial innovation has been both good and bad cholesterol -- serving to lower the probability of crisis, but fattening the tail of the distribution of losses for the financial system as a whole (Gieve, 2006; Gai and Haldane, 2007). Although advanced country financial systems have weathered numerous shocks in recent years (the collapse of Amaranth, the events surrounding GM, 9/11, and the Dotcom crash to name a few), the events triggered by the sub-prime crisis of August 2007 have been “super-systemic” in scope, enveloping financial institutions across the major economies as well as far away Iceland and New Zealand1.
The intricate network of claims and obligations that now link the balance sheets of financial intermediaries raises challenges for the positive analysis of contagion in the modern financial system. In a seminal analysis, Allen and Gale (2000) demonstrate how the spread of contagion depends crucially on the pattern of interconnectedness between banks. When the network is “complete”, with all banks having exposures to each other such that the amount of interbank deposits held by any bank is evenly spread over all other banks, the impact of a shock is readily attenuated. By contrast, when the network is “incomplete”, with banks only having exposures to a few counterparties, the system is more fragile. The initial impact of a shock is concentrated among neighbouring banks. Once these succumb, the premature liquidation of long-term assets and the associated loss of value bring previously unaffected banks into the front line of contagion2.
The financial turmoil of 2007-9 has also made clear how the interdependent nature of financial balance sheets creates an environment for indirect contagion to occur. As Cifuentes et.al (2005), Shin (2008) and Brunnermeier and Pederson (2009) stress, the knock-on effect of the default of a financial institution on asset prices can trigger further rounds of default as other financial entities are forced to write down the value of their assets. And, in practice, as recent events highlight, technical default is not necessary for this effect to be relevant. Contagion due to direct interlinkages of claims and obligations may thus be reinforced, particularly if the market for key financial assets is illiquid.
Given the speed with which shocks propagate, there is a need to develop tools that permit economists to articulate the probability and impact of shocks to the financial system. The complexity of modern financial systems means that policymakers have scant information about the true interlinkages between financial intermediaries. Securitisation, for example, means that US mortgage-backed securities acquired by investors in New Zealand or India exposes households in these countries to credit events in Ohio. Information on such
1
We owe the term "super-systemic" to Andy Haldane.
2
See Friexas et.al (2000) for similar results. Network models have also been applied to a range of other topics in finance: for a comprehensive survey, see Allen and Babus (2008).
linkages is typically not in the public domain. Moreover, the intricacy of financial transactions has been such that private sector agents' are also often no longer able to ascertain their own or others' exposures to credit risk. In this context, models such as Allen and Gale (2000), which are based on rigid structures with a handful of banks, have limited appeal. And more recent literature on endogenous network formation (e.g. Leitner, 2005; Castiglionesi and Navarro, 2007) also fails to offer a framework that allows for arbitrary network structures or for a distinction to be made between the probability and spread of contagion.
In this paper, we develop a network model of financial contagion that builds on techniques from the literature on complex systems (Strogatz, 2001). Although this type of approach is frequently applied to the study of epidemiology and ecology, and despite the obvious parallels between financial systems and ecosystems highlighted by prominent authors (e.g. May et.al, 2008), this methodology has yet to be applied to economic problems. Our model allows for arbitrary network structure and explicitly accounts for the nature and scale of aggregate and idiosyncratic shocks as well as asset
price interactions. Although the model can be solved analytically under certain assumptions, we present numerical results to illustrate and clarify the non-linear system dynamics of the model3. In so doing, we are able to isolate the probability of contagion in the financial system from its potential spread.
We find that financial systems exhibit a robust-yet-fragile tendency. While greater connectivity reduces the likelihood of contagion, the impact on the financial system, should problems occur, could be on a significantly larger scale than before. Our results thus nest the two views of financial systems as shock absorbers and/or amplifiers. The wider and deeper is financial innovation and integration, the more likely that the financial system serves as a shock absorber by enabling risk sharing. But innovation also has a dark side and can lead risk sharing to become risk spreading. So, although the
incidence of acute financial distress may have fallen with greater financial inter-connectedness, episodes of distress could have greater impact.
The recent rescue of American International Group (AIG) serves to illustrate the type of analysis made possible by our framework. A key reason given by policymakers for the rescue was concern that banks across the international financial system might have been exposed to AIG via credit derivative contracts. But how far could contagion have spread had AIG been allowed to fail? More generally, how might the expansion of credit risk transfer over the past decade have affected the nature of contagion? Given the limited information that policymakers have about the true interlinkages involved, the connections implied by credit derivatives are, perhaps, best captured by a random graph network of the type we consider here. Our results suggest that under plausible parameter values, greater use of credit derivatives might have reduced the likelihood of contagion. But, by creating complex and far-reaching interlinkages in the financial system, their increased use may mean that when contagion breaks out, it is transmitted much more widely.
3
Gai and Kapadia (2008) provide details of the analytical solution, applying techniques used in percolation theory (Callaway et al., 2001; Newman et al., 2001; Watts, 2002) and the epidemiological literature on the spread of disease in networks (e.g. Newman, 2002; Meyers, 2007).
A natural criticism of our framework is that it assumes that financial connections between intermediaries are formed randomly and exogenously and are static in nature. This leads us to model the contagion process in a relatively mechanical fashion, holding balance sheets and the size and structure of interbank linkages constant as default propagates through the system. Although not cast in a traditional optimizing set-up, our approach, nevertheless, yields a useful and realistic benchmark for analysis. Arguably, in normal times, developed country banks are robust and minor variations in their default probabilities do not affect lending decisions on the interbank market. But in crises, as illustrated by the sudden failures of Bear Stearns and Lehman Brothers, contagion may spread rapidly, with banks having little time to alter their behaviour before they are affected. Note also that banks have no choice over whether to default. This precludes strategic behaviour on networks of the type discussed by Morris (2000), Jackson and Yariv (2007) and Galeotti and Goyal (2007), where nodes can choose whether to adopt a particular state (e.g. adopting a new technology).
Our paper is related to a large empirical literature which uses counterfactual simulations to assess the danger of contagion in a range of national banking systems (see Upper, 2007, for a comprehensive survey). This literature has largely tended to use actual or estimated data on interbank lending to simulate the effects of the failure of an individual bank on financial stability4. The evidence of contagion risk from idiosyncratic shocks is mixed. Furfine (2003) and Wells (2004) report relatively limited scope for contagion in the U.S. and U.K. banking systems. By contrast, Upper and Worms (2004) and van Lelyveld and Liedorp (2006) suggest that contagion risk may be somewhat higher in Germany and the Netherlands. Meanwhile, Mistruilli's (2007) results for the Italian banking system echo the findings of this paper: he finds that while only a relatively low fraction of banks can trigger contagion, large parts of the system are affected in worst-case scenarios. Moreover, he shows that when
moving from an analysis of actual bilateral exposures (which form an incomplete network) to a complete structure estimated using maximum entropy techniques, the probability of contagion from a random, idiosyncratic bank failure is reduced but its spread is sometimes widened.
Contagion due to aggregate shocks is examined by Elsinger et.al (2006) who combine a model of interbank lending in the Austrian banking system with models of market and credit risk. They take draws from a distribution of risk factors and compute the effects on banks' solvency, calculating the probability and the severity of contagion. Their findings also echo the results reported in our paper. While contagious failures are relatively rare, if contagion does occur, it affects a large part of the banking system.
As noted by Upper (2007), existing empirical studies are plagued by data problems and the extent to which reported interbank exposures reflect true linkages is unclear: generally, interbank exposures are only reported on a particular day once a quarter and exclude a range of items, including intraday exposures. As such, they underestimate the true scale of financial connectivity. Moreover, national supervisory authorities do not generally receive
4
information on the exposures of foreign banks to domestic institutions, making it difficult to model the risk of global contagion in the increasingly international financial system. All of this, coupled with short time series for the relevant data, makes it difficult to empirically assess the effects of changes in network structure, as perhaps induced by credit risk transfer, on contagion risk. This highlights the importance of analytical and simulation-based approaches to explore these issues.
The structure of the paper is as follows. Section 2 describes the analytical framework. Section 3 uses numerical simulations to study the effects of failures of individual institutions and articulate the likelihood and extent of contagion. It also considers the impact of liquidity effects and credit derivatives on system stability. A final section concludes.
2
Analytical Framework
Consider a financial network in which $n$ financial intermediaries, `banks' for short, are randomly linked together by their claims on each other. In the language of graph theory, each bank represents a node on the graph and the interbank exposures of bank i define the links with other banks. Since interbank linkages comprise assets as well as liabilities, the links in the network are directed: incoming links, which point into a node or bank, correspond to the interbank assets / exposures of that bank (i.e. money owed to that bank by a counterparty); by contrast, outgoing links, which point out from a node, correspond to its interbank liabilities. Figure 1 shows an example of a directed financial
network in which there are five banks.
Two crucial properties of graphs such as those in Figure 1 are their degree distribution and average degree. Let us denote the number of incoming links, or in-degree, to bank i by ji, and the number of outgoing links, or out-degree, by . We can then define the joint degree distribution of in- and out-degree,
i k jk
p , to be the probability that a randomly chosen node simultaneously has in-degree j and out-degree k. Further, since every interbank asset of a bank is an interbank liability of another, every outgoing link for one node is an incoming
link for another node. Therefore, the average in-degree in the network,
, 1 i j k k i j j j p n
∑
=∑
,must equal the average out-degree,
,
1 i
i j k
k k
n
∑
=∑
pjk. We simply refer to this quantity as the average degree and denote it by, ,
.
jk jk
j k j k
z=
∑
j p =∑
k p (1)In what follows, the joint distribution of in- and out-degree governs the potential for the spread of shocks through the network. A feature of our analysis is that this joint degree distribution, and hence the structure of the links in the network, is entirely arbitrary, though a specific distributional assumption is made in our numerical simulations.
Suppose that the total assets of each bank are normalised to unity and that these consist of interbank assets, , and illiquid external retail assets, such as mortgages and corporate loans, IB i A R i
A . Since we might expect a bank with more incoming links to have a greater total interbank asset position, we allow for the relative shares of interbank and retail assets to depend on the bank's in-degree, ji. Given these assumptions,
( )
( )
1% ,IB R
i i i i
A j +A j = ∀i (2)
Where AiIB
( )
0 =05. We assume that the total interbank asset position of every bank is evenly distributed over each of its incoming links. Although this assumption is stylised, it provides a useful benchmark which emphasises the possible benefits of diversification.Since every interbank asset is another bank's liability, interbank liabilities, , are endogenously determined. Apart from interbank liabilities, the only other component of a bank's liabilities are exogenously given customer deposits, . The condition for bank i to be solvent is therefore IB i L i D
(
1−λφ)
AiIB( )
ji +qAiR( )
ji −LIBi −Di >0, (3) where φ is the fraction of banks with obligations to bank i that have defaulted, λis theaverage loss-given-default on interbank loans, and q is the resale price of the illiquid asset. The value of λ is constrained to lie between zero and one: λ=1 corresponds to a zero recovery assumption, namely that when a linked bank defaults, bank i loses all of its interbank assets held against that bank. The value of q may be less than one in the event of asset sales by banks in default, but equals one if there are no `fire sales'. The solvency condition can also be expressed as
(
) ( )
( )
( )
1 , for 0, R i i i IB i i IB i i K q A j A j A j φ λ λ − − < ≠ i (4)where is the bank's capital buffer, i.e. the difference between the book value of its assets and liabilities.
( )
( )
IB R IB
i i i i
K = A j +A j −L −D
To model the dynamics of contagion, we suppose that all banks in the network are initially solvent and that the network is perturbed at time t=1 by the initial default of a single bank. Although purely idiosyncratic shocks are rare, the crystallisation of operational risk (e.g. fraud) has led to the failure of financial institutions in the past (e.g. Barings). Alternatively, bank failure may result from an aggregate shock which has particularly adverse
5
Across the entire financial system, we might expect total retail assets to be fixed. This would imply a dependence between the average share of retail assets on bank balance sheets and the number of financial intermediaries in the system. As discussed below, our numerical simulations take this dependency into account.}
consequences for one institution: this can be captured in the model through a general erosion in the stock of retail assets or, equivalently, capital buffers across all banks, combined with a major loss for one particular institution.
Recall that ji denotes the number of incoming links for bank i. Since linked banks each lose a fraction 1 / ji of their interbank assets when a single counterparty defaults, it is clear from (4) that the only way default can spread is if there is a neighbouring bank for which
(
) ( )
( )
1 1 . R i i i IB i i i K q A j A j j λ − − < (5)We define banks that are exposed in this sense to the default of a single neighbour as vulnerable and other banks as safe. The vulnerability of a bank clearly depends on its in-degree, j. Specifically, a bank with in-degree j is vulnerable with probability
(
) ( )
( )
1 1 1. R i i j IB i K q A j P A j j υ λ ⎡ − − ⎤ = ⎢ < ⎣ ⎦⎥ ∀ ≥j (6)Further, the probability of a bank having in-degree j, out-degree k and being vulnerable is ·
j pjk
υ .
The model structure described by equations (2) to (6) captures several features of interest in systemic risk analysis. First, as noted above, the nature and scale of adverse aggregate or macroeconomic events can be interpreted as a negative shock to the stock of retail assets,
R i
A , or equivalently, to the capital buffer, . Second, idiosyncratic shocks can be modelled by assuming the exogenous default of a bank. Third, the structural characteristics of the financial system are described by the distribution of interbank linkages,
i K
jk
p , and much can be learnt about the nature of contagion by simply exploring the effects of varying the average degree in the network, z. Fourth, the implications of different dependencies between the total interbank asset position and the number of exposures can be explored by changing the functional form ofAiIB
( )
ji . And finally, liquidity effects associated with the potential knock-on effects of default on asset prices are captured by allowing q to vary.Gai and Kapadia (2008) use probability generating function techniques to obtain analytical results on the transmission of shocks in the system as a function of vj and pjk in the special case where the total interbank asset position is independent of the number of incoming links the bank has (i.e. IB
( )
i i
A j is constant and does not depend on ) and both ji λ and q are set equal to 1. They show that under these assumptions, financial systems exhibit a robust-yet-fragile tendency. While greater connectivity reduces the likelihood of contagion, its potential spread, should problems occur, could be significantly greater.
The intuition underpinning these results is straightforward. In a more connected system, the counterparty losses of a failing institution can be more widely dispersed to, and absorbed by, other entities. So increased connectivity and risk sharing may lower the probability of
contagion. But, conditional on the failure of one institution triggering contagious defaults, a higher number of financial linkages also increases the potential for contagion to spread more widely. In particular, greater connectivity increases the chances that institutions which survive the effects of the initial default will be exposed to more than one defaulting counterparty after the first round of contagion, thus making them vulnerable to a second-round default. The impact of any crisis that does occur could, therefore, be larger.
Although Gai and Kapadia (2008) discuss how assuming an uneven distribution of interbank assets over incoming links would not change any of their fundamental results, the effects of the other simplifying assumptions required to obtain an analytical solution are less clear. In particular, they do not explore the implications of making the total interbank asset position dependent on the number of exposures, making it difficult to assess, for example, the effects of more widespread use of credit derivatives. Therefore, in what follows, we use numerical simulations to explore the implications of relaxing some of the simplifying assumptions needed to solve the model analytically.
3
Numerical Simulations
3.1
Methodology
In our numerical simulations, we assume a uniform (Poisson) random graph in which each possible directed link in the graph is present with independent probability $p$. In other words, the network is constructed by looping over all possible directed links and choosing each one to be present with probability p. Consistent with bankruptcy law, we do not net interbank positions, so it is possible for two banks to be linked with each other in both directions. The average degree, z, is allowed to vary in each simulation. And although our model applies to networks of fully heterogeneous financial intermediaries, we take the capital buffers and asset positions on banks' balance sheets to be identical.
As a benchmark, we consider a network of 1,000 banks. Clearly, the number of financial intermediaries in a system depends on how the system is defined and what counts as a financial intermediary. But several countries have banking networks of this size, and a figure of 1,000 intermediaries also seems reasonable if we are considering a global financial system involving investment banks, hedge funds, and other players. Given this rather high number of banks, however, when calculating the probability and conditional spread of contagion, we only count episodes in which over 5% of the system defaults, as this seems a suitable lower bound for defining a systemic financial crisis in such a large system. When assessing the impact of credit risk transfer, we change these assumptions to reflect the smaller number of major players in credit derivative markets and their greater systemic importance.
Except for the credit derivative experiment, interbank assets are assumed not to depend on the number of incoming links and are held constant so that they comprise 20\% of total assets, with retail assets making up the rest -- the 20% share of interbank assets is broadly
consistent with the figures for developed countries reported by Upper (2007). Banks' capital buffers are set at 4%, a figure calibrated from data contained in the 2005 published accounts of a range of large, international financial institutions6. Since each bank's interbank assets are evenly distributed over its incoming links, interbank liabilities are determined endogenously within the network structure. And the liability side of the balance sheet is `topped up' by customer deposits until the total liability position equals the total asset position.
In the experiments that follow, we draw 1,000 realisations of the network for each value of z used. In each of these draws, we shock one bank at random, wiping out all of its external assets -- this type of idiosyncratic shock may be interpreted as a fraud shock. The failed bank defaults on all of its interbank liabilities. As a result, neighbouring banks may also default if their capital buffer is insufficient to cover their loss on interbank assets. Any neighbouring banks which fail are also assumed to default on all of their interbank liabilities, and the iterative process continues until no new banks are pushed into default.
3.2
Benchmark Case
As a benchmark, Figure 2 depicts the numerical solution under the assumptions needed to solve the model analytically. With no links, contagion is impossible by definition. Therefore, for very low values of z, the likelihood of contagion is increasing in connectivity.
More interesting is what happens for higher values of z. Gradually, the frequency of contagion falls as risk-sharing effects serve to reduce the number of vulnerable banks in the system. But when contagion does break out, it affects an increasing fraction of the system. Indeed, for , contagion never occurs more than five times in 1,000 draws but in each case where it does break out, every bank in the network fails. As well as pointing towards the robust-yet-fragile nature of financial networks, this serves to highlight that a priori indistinguishable shocks to the network can have vastly different consequences for contagion. In each draw, the initial shock is the failure of a single bank. In general, this does not cause contagion. But, in a in a small handful of cases, it is catastrophic. This feature of the complex network cautions against assuming that past resilience to a particular shock will continue to apply to future shocks of a similar magnitude. It also highlights the acute difficulties that policymakers may have when trying to assess the contagion risk from the failure of an institution if they do not have a good understanding of the structure of the financial network.
8
z>
Figure 3 shows how the results change as banks' capital buffers vary. As might be expected, an erosion of capital buffers increases the probability of contagion for fixed values of z7. For small values of z, the extent of contagion is also slightly greater when capital buffers are lower but, in all cases, it reaches one for sufficiently high values of z. When the capital
6
Further details are available on request from the authors.
7
Reduced capital buffers may also increase the likelihood of an initial default. Therefore, they may contribute to an increased probability of contagion from this perspective as well.
buffer is increased to 5%, however, this occurs well after the peak probability of contagion. This neatly illustrates how increased connectivity can simultaneously reduce the probability of contagion but increase its spread conditional on it breaking it out.
3.3
Positive Recovery Rates
Solving the model analytically requires assuming a 100\% loss-given-default on interbank assets. This assumption may well be realistic in the midst of a crisis -- in the immediate aftermath of a default, the recovery rate and the timing of recovery will be highly uncertain and banks' funders are likely to assume the worst-case scenario. But to assess the robustness of the results, Figure 4 relaxes the zero recovery assumption. Instead, we assume that when a bank fails, its default in the interbank market equals its asset shortfall (i.e. its outstanding loss after its capital buffer is absorbed) plus half of any remaining interbank liabilities, where the additional amount is interpreted as reflecting bankruptcy costs that are lost outside the system8. As we might expect from equation (6), this reduces the likelihood of contagion because fewer banks are vulnerable when the recovery rate is positive. But it is also evident that relaxing the zero recovery assumption does not fundamentally affect our broad results.
3.4
Liquidity Risk
We now incorporate liquidity effects into our analysis. When a bank fails, financial markets may have a limited capacity to absorb the illiquid external assets which are sold. As a result, the asset price may be depressed. Following Schnabel and Shin (2004) and Cifuentes et.al (2005), suppose that the price of the illiquid asset, q, is given by
, x
q=e−α (7)
where x>0 is the fraction of system (illiquid) assets which have been sold onto the market (if assets are not being sold onto the market, q=1). We calibrate α so that the asset price falls by 10\% when one-tenth of system assets have been sold.
We integrate this pricing equation into our numerical simulations. Specifically, when a bank defaults, all of its external assets are sold onto the market, reducing the asset price according to equation (7). We assume that when the asset price falls, the external assets of all other banks are marked-to-market to reflect the new asset price. From equation (6), it is clear that this will reduce banks' capital buffers and has the potential to make some banks vulnerable, possibly tipping them into default.
8
Since interbank assets make up 20\%\ of each bank's total asset position, interbank liabilities must, on average, make up 20% of total liabilities. Therefore, for the average bank, if we take (insured) customer deposits as senior, the maximum bankruptcy cost under this assumption is 10% of total assets / liabilities, which accords with the empirical estimates of bankruptcy costs in the banking sector reported by James (1991).
The incorporation of (market) liquidity risk introduces a second potential source of contagion into the model from the asset-side of banks' balance sheets. Note, however, that liquidity risk only materialises upon default. Realistically, asset prices are likely to be depressed by asset sales before any bank defaults. So accounting only for the post-default impact probably understates the true effects of liquidity risk.
Figure 5 illustrates the effects of incorporating liquidity risk into the model. As we might expect, liquidity effects magnify the extent of contagion when it breaks out. Contagion is also slightly more likely for given values of z.
As shown, liquidity effects do not drastically alter the main results of our model. But this should not be taken to mean that liquidity effects are unimportant. In part, the limited effect of liquidity risk reflects the already high spread of contagion embedded in the benchmark scenario. If a fraction of banks were assumed to be totally immune to counterparty credit risk (i.e. they would survive even if all their counterparties defaulted), then liquidity risk would probably be much more significant in amplifying the extent of contagion for intermediate levels of connectivity. And, to the extent that liquidity risk materialises before any bank defaults, it can be viewed as having the potential to erode capital buffers and increase the likelihood of an initial default.
3.5
The Impact of Credit Derivatives
We now illustrate the type of analysis made possible by our framework by using it to assess the possible impact of credit derivatives on the nature of contagion. In recent years, the use of credit derivatives has grown tremendously. For the net buyers of credit protection (typically traditional banks), this has reduced their exposure to non-financial corporates. But, at the same time, it has increased both their number of links to financial
counterparties and their overall exposure to them. Meanwhile, net sellers of credit protection (e.g. insurance companies and monolines) have implicitly taken on corporate credit risk and become part of the financial network through their activities. Perhaps more contentiously, it has also been argued that for the system as a whole, the greater use of credit risk transfer may have slightly reduced capital buffers.
To capture these features in our model, we assume that the greater use of credit derivatives has meant that a typical bank has a greater number of incoming links and a correspondingly higher share of interbank assets on their balance sheet. Specifically, we assume the following functional form forAiIB
( )
ji :( )
,IB b
i i i
A j =aj +c (8)
where a>0 and b>0 are parameters controlling the extent to which the total interbank exposure increases with the number of incoming links9. We also assume that the total stock of retail assets in the economy has remained constant. Together, these assumptions imply
9
Intuitively, introducing this relationship curtails the risk-sharing benefits of greater connectivity because the greater absolute exposure associated with a higher number of links partially offsets the positive effects from greater diversification.
that the number of institutions in the network must have increased -- we associate this with the integration of insurance companies, hedge funds and monolines into the system. To capture the possible erosion in capital buffers, we suppose that the total capital in the system remains unchanged despite the increase in the number of participants -- as a result, all institutions become slightly less well capitalised as credit derivatives assume a greater role. All of these effects automatically key off an increase in the average degree, z.
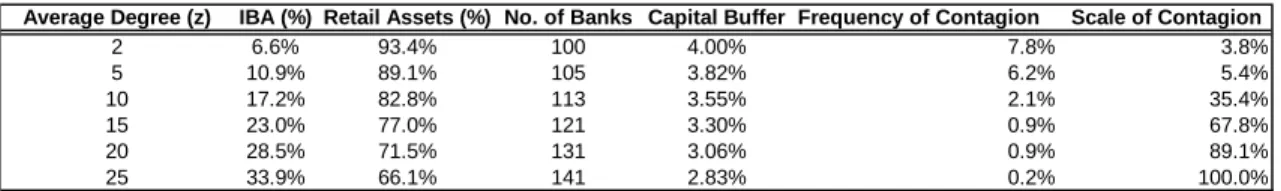
Since our focus is on the relatively limited set of key players in global credit derivative markets, we suppose that in the initial state before the advent of credit derivatives, there were only 100 banks, with each having a 4% capital buffer and just two interbank links on average. We then simulate the system for different values of z, assuming that a=0.02, b=0.85, c=0.03, that the loss-given-default on interbank exposures is 100%, and that there are no liquidity effects. Bearing in mind that the typical bank currently has an interbank asset share of approximately 20% (Upper, 2007), it seems from the second column of Table 1 that this parameterization generates reasonably plausible interbank asset shares for the corresponding number of links. For example, if a bank is linked to one-fifth of the system (z=20), interbank assets comprise 28.5% of its balance sheet.
Table 1 shows how the probability and spread of contagion vary with z. Given our focus on major international financial institutions in this analysis, we adopt a lower threshold for recording contagion events, counting all episodes in which more than one bank defaults as a result of the initial failure. It is evident from the table that the greater use of credit derivatives, as captured by an increase in z, may have reduced the likelihood of contagion following an initial failure. Moreover, to the extent that credit risk transfer may reduce the probability of an initial default, the results may understate its beneficial effects. But the role of credit derivatives as a potential shock amplifier is made clear by the sharply increasing spread of contagion. Even with an average of five links, contagion only affects roughly 5% of the system when it breaks out. But an increase to ten or fifteen links changes the picture completely – once started, crises become super-systemic.
It is worth noting that these results (and indeed all of the numerical results presented in the paper) are cast in terms of random graph network structures involving financial intermediaries (nodes) with comparable balance sheets. As such, our findings could underestimate the impact of an actual financial crisis. If the first bank to fail is particularly large or highly connected (e.g. Lehman Brothers), then the consequences could be much more severe -- indeed, work by Albert et.al (2000) studies the effects of
targeted attacks on hubs and shows how critical nodes are vital to the spread of contagion10. But the existence of a key `node' may also be beneficial. With clear analogies to the epidemiological literature on targeted vaccination of highly connected nodes (Anderson and May, 1991), if the authorities are able to identify and `bail out' key players in the network ex ante, then prospective contagion could be very substantially contained. Extensions of our analysis along these directions are likely to reach similar conclusions.
10
4
Conclusion
In this paper, we develop a model of contagion in arbitrary financial networks that nests the two competing views of financial systems as shock absorbers or amplifiers. In so doing, our framework helps clarify how shocks are transmitted across markets and banking systems. A key finding is that while greater connectivity helps lower the probability of contagion, it can also increase its spread in the event of problems occurring. Illiquid markets for key financial assets compound the problem, amplifying both the likelihood and extent of contagion.
Our model helps illustrate how the failure of a large organization linked to other entities via credit derivatives might play out in the absence of a public sector rescue. The use of credit derivatives in our model creates far-reaching interlinkages and large absolute exposures compared with financial systems that lack such instruments. We demonstrate how the expansion of credit derivative activity may have worked to curtail some of the risk-sharing benefits offered by such innovation, leaving open the scope for a much more virulent or “super-systemic” crisis.
Finally, the paucity of relevant balance sheet data on many financial entities and the international nature of financial intermediation make the empirical modelling of contagion risk difficult to undertake. By isolating probability and impact, our paper also makes a methodological contribution -- pointing towards analytical and numerical ways of assessing the effects of changes in network structure on contagion risk.
Our paper is best viewed as a first step in a research agenda that seeks to develop a deeper understanding of large, complex financial networks. Clearly, there remains scope to sharpen the calibration that forms the basis of the main results. A more pressing challenge, however, is to relax some of the more mechanical assumptions of the analysis. Developing a more behavioural foundation in ways that capture the richness of financial network structure is a crucial next task if such models are to offer further meaningful guidance for policymakers.
References
Albert, R, Jeong, H and A-L Barabasi (2000), Error and attack tolerance of complex networks, Nature, 406, 378-382.
Allen, F and A Babus (2008), Networks in finance, forthcoming in Network-based Strategies and Competencies, Kleindorfer, P and J Wind (eds.), Wharton School Publishing.
Allen, F and D Gale (2000), Financial contagion, Journal of Political Economy, 108, 1-33.
Anderson, R and R May (1991), Infectious diseases of humans: dynamics and control, Oxford University Press.
Angelini, P, Maresca, G and D Russo (1996), Systemic risk in the netting system, Journal of Banking and Finance, 20, 853-868.
Brunnermeier, M and L Pedersen (2009), Market liquidity and funding liquidity, Review of Financial Studies, forthcoming.
Callaway, D, Newman, M, Strogatz, S and D Watts (2000), Network robustness and fragility: percolation on random graphs, Physical Review Letters, 85, 5468-5471.
Castiglionesi, F and N Navarro (2007), Optimal fragile financial networks, Tilburg University Discussion Paper #2007-100.
Cifuentes, R, Ferrucci, G\ and H S Shin (2005), Liquidity risk and contagion, Journal of the European Economic Association, 3, 556-566.
Elsinger, H, Lehar, A and M Summer (2006), Risk assessment for banking systems, Management Science, 52, 1301-1314.
Freixas, X, Parigi, B and J-C Rochet (2000), Systemic risk, interbank relations and liquidity provision by the central bank, Journal of Money, Credit and Banking, 32, 611-638.
Furfine, C (2003), Interbank exposures: quantifying the risk of contagion, Journal of Money, Credit and Banking, 35, 111-128.
Gai, P and A Haldane (2007), Public policy in an era of super-systemic risk, mimeo.
Gai, P and S Kapadia (2008), Contagion in financial networks, mimeo.
Galeotti, A and S Goyal (2007), A\ theory of strategic diffusion, University of Essex Department of Economics Discussion Paper \#635.
Gieve, J (2006), Financial System Risks in the UK -- Issues and Challenges, Speech at the Centre for the Study of Financial Innovation Roundtable, London, 25 July.
Greenspan, A (1999), The evolution of bank supervision, Remarks to American Bankers Association, Phoenix, 11 October.
Jackson, M and L Yariv (2007), Diffusion of behavior and equilibrium properties in network games, American Economic Review,97, 92-98.
James, C (1991), The losses realized in bank failures, Journal of Finance, 46, 1223-1242.
Leitner, Y (2005), Financial networks: contagion, commitment and private sector bailouts, Journal of Finance, 6, 2925-53.
May, R, Levin, S and G Sugihara (2008), Ecology for bankers, Nature, 451, 893-895.
Meyers, L A (2007), Contact network epidemiology: bond percolation applied to infectious disease prediction and control, Bulletin of the American Mathematical Society, 44, 63-86.
Mistrulli, P (2007), Assessing financial contagion in the interbank market: maximum entropy versus observed interbank lending patterns, Bank of Italy Working Paper \#641.
Morris, S (2000), Contagion, Review of Economic Studies, 67, 57-78.
Nier, E, Yang, J, Yorulmazer, T and A Alentorn (2007), Network models and financial stability, Journal of Economic Dynamics and Control, 31, 2033-2060.
Newman, M (2002), The spread of epidemic disease on networks, Physical Review E, 66, 016128.
Newman, M, Strogatz, S and D Watts (2001), Random graphs with arbitrary degree distributions and their applications, Physical Review E, 64, 026118.
Rajan, R (2005), Has financial development made the world riskier?, paper presented at the Federal Reserve Bank of Kansas City Economic Symposium on the Greenspan Era: Lessons for the Future, Jackson Hole, 25-27 August.
Schnabel, I and H S Shin (2004), Liquidity and contagion: the crisis of 1763, Journal of the European Economic Association, 2, 929-968.
Shin, H S (2008), Risk and liquidity in a system context, Journal of Financial Intermediation, 17, 315-329.
Strogatz, S (2001), Exploring complex networks, Nature,410, 268-276.
Upper, C (2007), Using counterfactual simulations to assess the danger of contagion in interbank markets, Bank for International Settlements Working Paper \#234, August.
Upper, C and A Worms (2004), Estimating bilateral exposures in the German interbank market: is there a danger of contagion? European Economic Review, 48, 827-849.
Van Lelyveld, I and F\ Liedorp (2006), Interbank contagion in the Dutch banking sector: a sensitivity analysis, International Journal of Central Banking, 2, 99-134.
Watts, D (2002), A simple model of global cascades on random networks, Proceedings of the National Academy of Sciences, 99, 5766-5771.
Wells, S (2004), Financial interlinkages in the United Kingdom's interbank market and the risk of contagion, Bank of England Working Paper \#230.
Figure 1: A Directed Network with five nodes
Figure 2: Contagion in the Benchmark Case
0 0.2 0.4 0.6 0.8 1 0 1 2 3 4 5 6 7 8 9 10
Average Degree (i.e. connectivity)
Extent of Contagion
Frequency of Contagion Contagion window
Figure 3: Contagion under different capital buffers 0 0.2 0.4 0.6 0.8 1 0 1 2 3 4 5 6 7 8 9 10 11 12 13 14
Average Degree (i.e. connectivity)
Frequency of Contagion (3% Capital Buffer) Extent of Contagion (3% Capital Buffer) Frequency of Contagion (4% Capital Buffer) Extent of Contagion (4% Capital Buffer) Frequency of Contagion (5% Capital Buffer) Extent of Contagion (5% Capital Buffer)
Figure 4: Contagion with Positive Recovery Rates
0 0.2 0.4 0.6 0.8 1 0 1 2 3 4 5 6 7 8 9 10
Average Degree (i.e. connectivity)
Frequency of Contagion (Benchmark Case) Extent of Contagion (Benchmark Case) Frequency of Contagion (Positive Recovery Rate) Extent of Contagion (Positive Recovery Rate)
Figure 5: Liquidity Effects and Contagion 0 0.2 0.4 0.6 0.8 1 0 1 2 3 4 5 6 7 8 9 10 11 12
Average Degree (i.e. connectivity)
Frequency of Contagion
Extent of Contagion
Frequency of Contagion (with liquidity effects)
Extent of Contagion (with liquidity effects)
Table 1: Credit Derivative Simulation
Average Degree (z) IBA (%) Retail Assets (%) No. of Banks Capital Buffer Frequency of Contagion Scale of Contagion
2 6.6% 93.4% 100 4.00% 7.8% 3.8% 5 10.9% 89.1% 105 3.82% 6.2% 5.4% 10 17.2% 82.8% 113 3.55% 2.1% 35.4% 15 23.0% 77.0% 121 3.30% 0.9% 67.8% 20 28.5% 71.5% 131 3.06% 0.9% 89.1% 25 33.9% 66.1% 141 2.83% 0.2% 100.0%
Documentos de Trabajo
Banco Central de Chile
Working Papers
Central Bank of Chile
NÚMEROS ANTERIORES PAST ISSUES
La serie de Documentos de Trabajo en versión PDF puede obtenerse gratis en la dirección electrónica:
www.bcentral.cl/esp/estpub/estudios/dtbc. Existe la posibilidad de solicitar una copia impresa con un costo de $500 si es dentro de Chile y US$12 si es para fuera de Chile. Las solicitudes se pueden hacer por fax: (56-2) 6702231 o a través de correo electrónico: [email protected].
Working Papers in PDF format can be downloaded free of charge from:
www.bcentral.cl/eng/stdpub/studies/workingpaper. Printed versions can be ordered individually for US$12 per copy (for orders inside Chile the charge is Ch$500.) Orders can be placed by fax: (56-2) 6702231 or e-mail: [email protected].
DTBC-541
New Framework for Measuring and Managing Macrofinancial Risk and Financial Stability
Dale F. Gray, Robert C. Merton y Zvi Bodie
Diciembre 2009
DTBC-540
Households’ Financial Vulnerability
Marcelo Fuenzalida y Jaime Ruiz-Tagle
Diciembre 2009
DTBC-539
Exchange Rate Volatility and Export Margins
Roberto Álvarez, Michael Doyle y Ricardo A. López
Diciembre 2009
DTBC-538
On The Role and Effects of IMF Seniority
Diego Saravia
Diciembre 2009
DTBC-537
The Balance Sheet Channel
Ethan Cohen-Cole y Enrique Martínez-García
Diciembre 2009
DTBC-536
Entry into Export Markets and Product Quality Differences
Roberto Álvarez y J. Rodrigo Fuentes
DTBC-535
Análisis de Derechos Contingentes: Aplicación a Casas Comerciales
Rodrigo Alfaro y Natalia Gallardo
Diciembre 2009
DTBC-534
Efectos del Calentamiento Global sobre la Industria Pesquera
Carlos Medel
Diciembre 2009
DTBC-533
Hybrid Inflation Targeting Regimes
Carlos García, Jorge Restrepo y Scott Roger
Diciembre 2009
DTBC-532
Bank Credit and the 2008 Financial Crisis: A Cross-Country Comparison
Ari Aisen y Michael Franken
Diciembre 2009
DTBC-531
La Curva De Rendimiento Bajo Nelson-Siegel
Rodrigo Alfaro
Octubre 2009
DTBC-530
The Long And The Short Of Emerging Market Debt
Luis Opazo, Claudio Raddatz y Sergio Schmukler
Octubre 2009
DTBC-529
A Simple Global Perspective on the US Slowdown, Boom-Bust Cycles and the Rise of Protectionism
Juan Pablo Medina y Pablo García
Octubre 2009
DTBC-528
The Effect Of The Number Of Lending Banks On The Liquidity Constraints Of Firms: Evidence From A Quasi-Experiment
Daniel Calvo, Alejandro Drexler, Carolina Flores y David Pacheco
Octubre 2009
DTBC-527
Monetary Policy And Key Unobservables: Evidence From Large Industrial And Selected Inflation-Targeting Countries
Klaus Schmidt-Hebbel y Carl E. Walsh