CEO Compensation and Company Performance
Evidence From Sweden
Hugo Hammar & Isak Djudja
June 13, 2019
Bachelor’s Thesis – 15 Credits Financial Economics
Spring 2019
Abstract
Compensation to CEOs has increased dramatically over the past decades. This increase over time raises the question of its justifiability. The direct costs of CEO compensation
shall be considered in light of the value added by reduced agency costs that originate from the principal-agent relationship between CEOs and shareholders. This thesis examines
the determinants of CEO compensation, focusing mainly on company performance. The study is conducted on 40 Swedish large and mid cap firms, and finally concludes that
per-formance is significant and can partly explain CEO compensation with ROE and EPS as performance proxies. These results largely support earlier research on the topic that has
been done on other time periods and regions. In addition to performance, the results of the thesis show that there are other important determinants of compensation, such as firm
size and CEO related characteristics. Ultimately and evidently, several factors are of im-portance in understanding how CEO compensation is set on the Swedish market.
Acknowledgements:
We would like to express our deep gratitude for valuable comments from our supervisor Charles Nadeau, as well as to the Centre of Finance at the University of Gothenburg for
supplying us with the resources necessary to conduct our research. We would also like to express our sincere appreciation to Aineas Mallios, for his continuous guidance and help
in all econometric and statistical issues that we have encountered.
Abbreviations:
ROE – Return on Equity
EPS – Earnings per Share NPV – Net Present Value
VIF – Variance Inflation Factor
JEL Classification:M12, J33
Keywords:CEO Compensation, Agency Theory, Compensation Plan, Variable Pay
Author Contact Details:
Isak Djudja: E-mail: gusdjudis@student.gu.se, Phone: +46721830625
Table of Contents
1 Introduction 1
1.1 Background . . . 1
1.2 Research Questions . . . 2
1.3 Contributions and Purpose . . . 3
1.4 Delimitations . . . 3
2 Theory Review 5 2.1 Principal Agent Theory . . . 5
2.2 CEO Compensation and Agency Costs . . . 6
2.3 Underinvestment . . . 7
2.4 Overinvestment . . . 8
2.5 Herzberg Motivation-Hygiene Theory . . . 9
3 Literature Review 10 4 Data 14 4.1 Sample Selection Procedure . . . 14
4.2 Chosen Variables . . . 15 4.2.1 CEO Compensation . . . 15 4.2.2 Company Performance . . . 16 4.2.3 Control Variables . . . 17 5 Methodology 18 5.1 Research Model . . . 18 5.2 Econometric Analysis . . . 19
6 Empirical Results 22
6.1 Hypothesis 1: Does ROE have an impact on CEO compensation? . . . 22
6.2 Hypothesis 2: Does EPS have an impact on CEO compensation? . . . 25
6.3 Further Implications . . . 27
6.4 Suggestions for Further Research . . . 31
7 Conclusion 32 8 References 34 9 Appendix 37
List of Tables
I ROE – Pooled OLS . . . 23II ROE – Fixed Effects . . . 23
III EPS – Pooled OLS . . . 26
1
Introduction
1.1
Background
CEO compensation has for long been a controversial topic, relating to social and economic inequalities. Overpayment to managers and board members has caused corporations to
implement internal corporate governance structures to face the external pressure from leg-islative authorities that act in the interest of shareholders to minimize agency problems.
The question at hand is if compensation to managers is economically motivated or if it merely erodes shareholder value.
Observing the period from 1980 until 2019, CEOs have seen a large increase in compensation exceeding both the development of the S&P 500 and the general public’s
wealth. While CEO compensation among the largest 350 firms in the US has increased by 1070 % between 1978 and 2017, the S&P 500 has increased by 637 % (Mishel & Schieder,
2018). The situation in Sweden has been similar with CEO compensation and the return of the stock market diverging over the last decades.
For companies to use variable pay in the form of bonuses and stock options as CEO compensation is an old concept that has been embraced during the entire 20th century.
However, the proportion of bonuses was rather modest up until the 1980s when it started becoming more common, and the trend of increasing variable income has continued ever
since. The proportion of Swedish CEO bonuses went from a fifth of total salaries in the 1990s to approximately a third in 2005. The increase of using bonus payments in
compensation plans appears to differ by country and region as well. While CEOs in the US, Australia and Germany only received a small proportion of their compensation in the
form of traditional salary, Nordic countries received a substantially larger proportion as fixed salary in 2006 (B˚ang & Waldenstr¨om, 2009).
The complexity of how to align interests of managers with those of the shareholders
has led companies to try plenty of different remuneration compositions over the years. The dilemma of whether short- or long-term structures are more beneficial for the company’s
performance is complicated and there is no consensus in the research community on how to structure a CEO’s compensation to maximize the efficiency of the firm. The existence
of agency problems has through vast research been established, and its persistency makes possible solutions to the problem important for all types of organizations around the globe.
1.2
Research Questions
Notwithstanding the vast research done on the subject, there is still no consensus on what core factor has the largest impact on CEO compensation. Previous studies performed in
the US suggest that the two major determinants of CEO compensation are firm size and company performance (Agarwal, 1981; Dyl, 1988). This study focuses primarily on firm
performance as a determinant of CEO compensation. Previously, studies on the subject have been conducted in different regions and during different time periods. This study
wishes to observe the situation on the Swedish market during the period 2013-2017, and aspires to contribute to the debate on CEO compensation determinants, specifically
regard-ing the impact of performance. Investigatregard-ing the performance measures ROE and EPS, the following null hypotheses are examined:
I) Return on Equity does not have an impact on CEO Compensation
II) Earnings per Share does not have an impact on CEO Compensation
The hypotheses aim to investigate the impact of company performance on CEO compen-sation using two different measures as proxies for true firm performance. Furthermore, the
effects of performance will also be examined on the components of compensation
indepen-dently, namely bonus and salary. The first hypothesis challenges ROE as a determinant, while the latter assesses the EPS measure. In the case of rejection of one or both
hypothe-ses, it is subsequently of interest to evaluate the results further, such as the magnitude of the impact of the variable. The analysis and discussion that follow also address the impact
of other variables included in the model that bear significant explanatory power.
1.3
Contributions and Purpose
This bachelor thesis investigates the relationship between company performance and CEO
compensation on Swedish large and mid cap firms in the context of agency theory. The purpose of this investigation is to evaluate the impact of company performance on CEO
compensation, with the aspiration of concluding whether compensation paid to CEOs is truly based on performance. The results of the study will add to previous research done on
the role of compensation as an incentive tool to address agency problems, and it will serve as a complement to work done on the topic of determinants of CEO compensation from a
Swedish perspective.
1.4
Delimitations
There is a number of delimitations of this thesis. Firstly, the term ‘compensation’ in the context of the thesis refers merely to aggregate cash payments of salary and bonus to
CEOs. Remuneration plans in the population commonly also include other components, such as stock option plans, pension plans and severance packages. Therefore, the term
‘compensation’ in this study does not reflect all compensation components paid to CEOs. Secondly, the study is delimited by its choice of performance proxies. Different
Both EPS and ROE rest on net income as the numerator, and one must in this
discus-sion raise the question concerning what proxies best reflect real performance. Previous research consider a vast array of performance proxies including sales, net profits, stock
returns and profitability measures, with some contrasting results. This study considers merely the ROE and EPS measures, and while it is argued that these are proper measures
for performance – this delimitation should be noted.
Thirdly, it is important to note that the study suffers from a delimitation in regard
to the data on CEO ownership. Due to restrictive access to ample databases, ownership is calculated as the percentage of equity that the CEO holds, without accounting for any
voting power. In addition, the data does not include shares that are held indirectly by the CEO through third party ventures.
Finally, the study focuses only on examining the relationship between firm perfor-mance and compensation to theCEO. The study does not in any way adjust for the fact
that the rest of top management and the board of directors have an impact on firm perfor-mance.
2
Theory Review
2.1
Principal Agent Theory
The main purpose of linking compensation to firm performance is to minimize the prob-lems that to some extent arise from the very nature of a fiduciary relationship in which the
interests of different parties diverge – agency costs. This stems from the Principal Agent Theory, and prominent writers on the subject are Jensen & Meckling (1976) who define
an agency relationship as “a contract under which one or more persons (the principal(s)) engage another person (the agent) to perform some service on their behalf which involves
delegating some decision making authority to the agent”. In the context of this study, the principal and the agent are throughout considered the shareholders and the CEO,
respec-tively. Jensen & Meckling continue to describe agency costs as the sum of three compo-nents – namely:
I) the monitoring expenditures by the principal,
II) the bonding expenditures by the agent, and III) the residual loss
Monitoring expenditure is the component of agency costs which contextually is of the
highest relevance. The category includes costs that the principal incurs to create appropri-ate incentives for the agent. This is done for the sole purpose of limiting divergences from
the principal’s interests, in an attempt to make the agent maximize firm value. As Jensen & Meckling (1976) also stipulate, the term ‘monitoring’ includes here not only costs in
terms of measuring or observing the agent, but also tools to control the agent, for example by compensation policies.
Bonding expenditures are, in contrast to monitoring expenditures, costs borne by the
agent in order to “... guarantee that he [the agent] will not take certain actions which would harm the principal or to ensure that the principal will be compensated if he does take such
actions” (Jensen & Meckling, 1976).
The residual loss is the third and final component of Jensen & Meckling’s definition
of agency costs. It is constituted by the real monetary costs borne by the principal due to the agency relationship, after accounting for the above mentioned proactive attempts to
minimize them through monitoring and bonding costs.
2.2
CEO Compensation and Agency Costs
Instated compensation for the purpose of aligning the interests of the principal and the
agent can take different forms. In many cases, total compensation is constituted by fixed salary, variable pay, other benefits, pension plans and long-term incentive plans. The
vari-able component of remuneration packages is included in an attempt to minimize agency costs. B˚ang & Waldenstr¨om (2009) explain that if a CEO’s compensation is the only thing
of her interest, and if that compensation is fixed, she will not, in contrast to the share-holders, be engaged in creating value for the firm. However if the CEO’s compensation is
made sensitive to changes in the firm’s value, the CEO’s interests will approach those of the shareholders, and the agency problems will to some extent be overcome. The same
pa-per continues to explain the theoretical support of pa-performance-tied pay. Firstly, variable compensation allegedly increases the CEO’s effort put in the company. The CEO will have
higher incentive to create value for the firm if she takes part of the profits. Alternatively, a CEO with a fixed pay will not work harder than what is demanded in order to keep her
job. Secondly, variable compensation limits the extent to which a CEO utilizes firm re-sources privately. Examples of such actions include flying first class and overspending on
company-paid dinners. Thirdly, B˚ang & Waldenstr¨om continue by explaining that variable
compensation can encourage risk-taking. Without an incentive pay, the CEO may defer from taking on risky projects because of fear of losing her position. Being offered a piece
of the winnings may however allow also for risky projects to be invested in. Not pursuing such risky, but profitable, projects, is often referred to as underinvestment.
2.3
Underinvestment
Another important agency cost is underinvestment. The phenomenon was theorized by Myers (1977), who explains that “a firm with risky debt outstanding, and which acts in
its stockholders’ interest, will follow a different decision rule than one which can issue risk-free debt or which issues no debt at all”. He states that there might be a risk of not
pursuing certain projects with positive NPV, when the costs of the project are fully borne by the shareholders, but the profits are distributed to both bondholders and shareholders.
There is indeed an economic significance of the agency cost of underinvestment, and pre-vious literature stipulates that there are different potential solutions to the problem (Mauer
& Ott, 2000). Kanagaretnam & Sarkar (2011) elaborate on the theory of underinvestment in the context of managerial compensation, by viewing the manager’s regular, fixed salary
payments as regular interest payments, both of which cease in case of a bankruptcy. As neither the manager nor the bondholders will risk losing these regular payments, their
interests align. This creates an incentive for managers not to pursue risky projects. On the contrary, an incentive pay component aligns the manager’s interests with those of the
shareholders, as the CEO has an opportunity to receive an additional amount beyond the regular salary payment. In other words, with only a fixed CEO salary, the threat of
underin-vestment increases. In contrast, adding a variable CEO compensation should theoretically reduce underinvestment, since it makes managerial and shareholders’ interests of
maxi-mizing firm value align. While Kanagaretnam & Sarkar consider equity ownership as the
incentive component, the same reasoning could be extended to other compensation pack-ages linked to performance. Indeed, Brander & Poitevin (1992) speak of the incentive
component in terms of a ‘bonus’, and come to a similar conclusion: managerial contracts can mitigate, and in some cases even eliminate, the agency costs of underinvestment.
2.4
Overinvestment
A problem closely related to that of underinvestment is what intuitively can be explained as its opposite – overinvestment. There are incentives for managers to grow and increase
the size of the firm to such an extent that it becomes suboptimal. The intuition behind this is that a larger firm naturally increases the resources under the managers’ control, and thus
their power (Jensen, 1986). Jensen continues this reasoning by explaining that, in the case of substantial free cash flow in the firm, there are especially severe conflicts of interest
between shareholders and managers over payout policy. A potential consequence in such situations is that cash may be spent on projects that erode rather than create value for the
firm. Managers can more readily accept a project when the firm keeps cash at hand, rather than scenarios in which additional debt (or equity) must be issued to pursue it. By the
same reasoning as in the case of underinvestment, a compensation linked to performance measures (and indirectly the value of the firm) should conflate the interests of shareholders
and managers also in the presence of overinvestment threats. Empire building is the term used to describe the willingness of managers to involve the firm in negative NPV projects
to increase its size, in order to gain – for example – prestige, publicity, and the potentially higher salary that large firms tend to pay their managers (Berk & Demarzo, 2014). Much
earlier research support this reasoning, showing that two effects are at work; (1) the re-lationship between firm performance and CEO compensation, which creates incentives to
maximize firm value, and (2) the relationship between firm size and CEO compensation,
which creates incentives to maximize firm size. The rationale for increasing firm size sub-optimally does not end with higher salaries, but can more thoroughly be understood in
light of motivation theory.
2.5
Herzberg Motivation-Hygiene Theory
While compensation commonly is referred to as one of the most incentivizing tools for
steering management, there are somewhat contradicting motivation theories which take a more psychological perspective. Herzberg’s Motivation-Hygiene Theory focuses on
de-terminants of job satisfaction and has had a major impact on the discussion, claiming that “...pay contributes little to job satisfaction, all employees need to grow
psychologi-cally, and interpersonal relations are more likely to lead to dissatisfaction than satisfaction” (Sachau, 2007). This theory, by extension, therefore suggests that a CEO should not
per-form considerably better only due to an increase in compensation, but that other motivating factors are of importance. The study of Herzberg et al. (1993) elaborates specifically on
’motivator factors’, and ’hygiene factors’, where the first of which corresponds to condi-tions that create job satisfaction. Herzberg et al. find that such motivators include, for
example, possibilities of professional growth, success in performance at work, and pres-tige. These are factors specifically related to an employee’s tasks. The latter, hygiene
factors, are on the other hand conditions that need to be met for workers not to be dissatis-fied at work. Hygiene factors include, among other components: salary, physical working
conditions and job safety. By the reasoning of this theory, other factors create job satisfac-tion to a larger degree than salary, such as the feeling of self-fulfillment. This should have
3
Literature Review
The correlation between CEO compensation and company performance is a heavily
re-searched and well documented subject. Economists have long tried to conclude whether there is a correlation between CEO compensation and the underlying performance of the
company or not, and if so, the causality of the matter. As discussed below, the statis-tical testing in previous research is commonly conducted by regression analyses, while
variables and proxies may differ.
Coughlan & Schmidt (1985) investigate mentioned relationship by examining how
boards of directors use compensation and structural changes to control management in corporations. The study focuses specifically on the relationship between the movement of
stock prices (as a proxy for firm performance) and managerial compensation. Coughlan & Schmidt note that an information asymmetry between management and compensation
committees may exist. It is plausible that relevant information may be kept from the com-mittee if said information would attribute a poor performance to top management.
Further-more, the study argues that “boards are captives of top management and make compensa-tion decisions based only on the informacompensa-tion supplied to them by that management”. This
information asymmetry entails an inherent risk that decisions on compensation are sub-optimal, and that agency problems remain unsolved due to this captivation of the board.
Using a sample of 249 corporations and conducting regressions primarily on abnormal returns, their research finds evidence that corporate boards can successfully relate
man-agerial compensation to the movement of the stock price in order to incentivize executive officers. The study finally concludes that there is empirical evidence suggesting that
deci-sions on executive compensation plans tend to align the interests of shareholders and top management.
that Coughlan & Schmidt (1985) only are able to explain 5.4 % of the variation in
man-agerial compensation. Kerr & Bettis also find the method of including both bonus and salary in the same category instead of treating them as two separate elements troublesome,
reasoning that the bonus a CEO receives in a given year is based on the performance in that year, while a CEO’s salary is based on the board’s perception of the performance in the
preceding year. Altering the assumptions used in previous scientific articles investigating the subject, Kerr & Bettis conclude that an abnormal return is not an important
determi-nant of CEO compensation and that the board of directors do not consider the performance of the stock when allocating compensation to managers.
In 2000, Attaway conducted a similar study to that of Coughlan & Schmidt (1985), on the computer and electronics industry in the US. Attaway’s study includes some changes
to Coughlan & Schmidt’s model. By including CEO age, job tenure, stock owned and education as control variables in the regression model, Attaway aims to achieve a more
reliable model by reducing potential endogeneity problems. The modification, however, does not lead to any substantial changes in the results – the relationship between
per-formance and compensation is deemed small but significant. Attaway also discusses the limitation of excluding stock options and other long-term incentive plans in the model, and
the possible implications it could have on the outcome of the study. While the problem may cause concern, he also notes that Lewellen & Huntsman (1970) conclude that using
salary and bonus cash payments works as a substitute for using total compensation. It is necessary, however, to keep in mind that this conclusion is made in the context of Lewellen
& Huntsman’s study, and does not necessarily hold true for other samples. Furthermore, in contrast to many other studies, Attaway uses ROE, rather than stock returns, as a proxy for
firm performance. The findings of Coughlan & Schmidt (1985) and Attaway (2000) – that company performance is a small, but statistically significant explanatory variable for CEO
Mur-phy (2010) discover in their study a similar small but significant relationship by examining
market value of firms as a proxy for firm performance together with total compensation. The study concludes that “a $1,000 change in corporate value corresponds to a change in
CEO compensation of just $2.59”. Veliyath & Bishop (1995) who, like Attaway, use ROE as performance measure on a specific industry, reach a similar conclusion concerning the
relationship. Lewellen & Huntsman (1970) do a comparable regression analysis but focus also on reported profits as an explanatory variable, and report a result that is in line with
above mentioned research.
Contrary to the majority of studies conducted on managerial compensation and
com-pany performance, Madura et al. (1996) and Akhigbe et al. (1995) do not find conclusive evidence of a correlation between the variables. Madura et al. study small publicly traded
companies from 1987 to 1991 in the US and use both the ROE of the previous year as well as a five-year ROE average as proxies for firm performance. One possible explanation
mentioned by Madura et al. for their contradicting results is that institutional investors have a lower ownership in small publicly listed companies compared to larger listed firms.
Therefore, the costs related to monitoring smaller firms are larger relative to the benefits received, allowing smaller firms to set CEO compensations that may not be economically
justifiable.
Akhigbe et al. (1995) observe 350 firms over the same five-year period (1987-1991),
but instead of ROE, abnormal returns calculated using both the one factor model and the three factor model are used as performance proxies. As previously stated, the empirical
results of Akhigbe et al. indicate a statistically insignificant relationship between CEO compensation and firm performance. However, they further discuss the complexity of
choosing proxies for performance and state that “results obtained using alternative perfor-mance measures were mixed, indicating that this empirical issue is highly sensitive to how
While the relationship between firm performance and managerial compensation has
been widely discussed, there is other research that focuses on other specific explanatory variables for compensation. In particular, much research revolve around assessing the
impact of company size rather than performance on managerial compensation. Agarwal (1981) describes a theory which explains that “the modern corporation tends to maximize
its size rather than profitability...”. The reason for this is to a large extent managers’ self-interests, as the significant relationship between company size and compensation would
incentivize managers to increase firm size instead of maximizing firm value in order to increase their compensation. Meeks & Whittington (1975) state that, notwithstanding
previous studies suggesting that the incentive effect of increasing firm size is stronger than that of maximizing firm value, “when just the consequences of the limited range of policies
open to the firm in any one year are considered, it emerges that growth pays no better than profitability”. The study sets this conclusion into perspective by stressing an issue with the
inference; while payments related to performance for the manager arrive in the subsequent year only if the performance level is kept, growth payments have, as Meeks & Whittington
put it, a “ratchet effect”. They explain that “...on just the weak assumption that the current year’s closing size is maintained [...], the growth premium is paid not just in the year in
which any growth is achieved, but for ever after”. Thus, there are difficulties in assessing the relative incentive effects. The study merely concludes that there is evidence for a
4
Data
4.1
Sample Selection Procedure
The population in this study is large and mid cap companies listed on Nasdaq Stockholm at the 1st of January 2019, totalling 96 large cap companies and 137 mid cap companies,
before any added restrictions. The first constraint limits the sample to only include com-panies that have had the same CEO during the five-year period 2013-2017, respectively
2012/2013-2016/2017 if the company’s fiscal year does not coincide with the calendar year. The reasoning behind the exclusion of companies with multiple CEOs during the
pe-riod is that it is mandatory that the same CEO has been in charge during the relevant pepe-riod in order to measure whether performance is truly linked to CEO remuneration (Madura et
al., 1996). Including values from years where one CEO left and another was appointed would also impose problems regarding severance pay and signing bonuses.
The second constraint requires that a bonus system exists within the companies. Since salaries commonly do not vary greatly over time, it is mainly the variable
com-pensation that is affected by the company’s performance. If a company does not have a system in place that links the performance of the company to the CEO remuneration, it
suggests that no action is taken to align the CEO’s and company’s interests and that the agency problem is prevalent.
In accordance with earlier research, the restrictions placed on the sample make the values gathered in a manner not regarded as random (Attaway 2000), however this is
consistent with the sampling methods used in earlier research (Miller 1995).
The ROE and EPS measurements and the values of total assets are gathered from
the Bloomberg Terminal, while CEO specific information is gathered mainly from annual reports complemented by data from S&P’s database CapitalIQ. Miller (1995) states that
research on CEO compensation and company performance mostly use data from reliable
secondary sources. All ratios and values are on an annual basis for the given year1. The sample has been drawn randomly from the population until a total of 20 large cap
companies and 20 mid cap companies met all previously mentioned criteria to be included in the sample, resulting in a total of 40 companies observed over a five year period.
4.2
Chosen Variables
4.2.1 CEO Compensation
The main dependent variable of the model is CEO compensation. The remuneration of
executives in corporations can take many forms. Regularly compensation plans include both a base salary and a variable component, but often they also include longer term
in-centive plans such as pension and stock option plans. CEO compensation in the context of this study, however, consists of cash payments to the CEO in the form of salary and bonus
only. The fundamental difference between the two is that bonus, in contrast to base salary, should exclusively be based on performance. The main reason for excluding long-term
income is, as Kerr & Bettis (1987) note, that there are practical and methodological issues with such measures, especially considering stock options. Continuing, previous research
indicates that salary and bonus can be used as a substitute for total compensation, which include, for example, stock options (Lewellen & Huntsman, 1970). Furthermore, using
cash salary and bonus is common in previous research (Agarwal, 1981) and has the ad-vantage of making the results of the study comparable to those of previous research. The
data on CEO compensation is gathered from annual reports of the firms in the sample for the years 2013 through 2017.
1Bonuses are reported for the year that the bonus was based on even if the payment was made in the
4.2.2 Company Performance
Measures of company performance are part of the independent variables of interest in the model; the regressors to be discussed in terms of having a direct impact on the dependent
variable – CEO compensation. The measures this study explores are, as established, ROE and EPS. Using ROE over a five year period ensures that the true performance from a
shareholder perspective is captured; how well shareholders’ equity is employed in order to create value. ROE is in this thesis calculated as
ROE = Net Income
Average Shareholders’ Equity
This study also includes EPS as a performance proxy for true performance. While there are several variations of the EPS measure, this study calculates an adjusted diluted EPS
measure that includes convertible securities and excludes one-time events that bring along extraordinary gains and losses for the firm. These changes are illustrated in the following
formula:
EPS= Net Income excl. Extraordinary Gains and Losses
Average Shares Outstanding incl. Convertible Securities
These adjustments arguably make the measure a better proxy for true performance, making it more focused on a firm’s true core businesses and all its potential outstanding stock. The
reason for including EPS alongside ROE in this study is threefold. Firstly, as Ittner et al. (1997) find, EPS is the financial metric most commonly used in annual bonus contracts.
Secondly, the measure has the advantage of being a very concrete and straightforward measure in the context of agency problems – the actual amount of company earnings
at-tributable to each held share. Lastly, as previous research to a large extent focus on stock price and ROE, it is of interest to investigate the effect of other performance measures with
4.2.3 Control Variables
In order to create a viable statistical model with limited endogeneity issues, a number of control variables are included in the regression models. By adding antecedents which may
have an impact on CEO compensation to the regression models, the relationship between CEO compensation and firm performance is clearer. Firstly, tenure of the CEOs is
con-trolled for. Data is gathered on the entrance year of the CEO, and for simplicity, it is assumed that the starting date for all CEOs was consistently the 1st of January. Secondly,
the model controls for the age of the CEOs. Thirdly, to control for CEO equity stakes, data on CEO ownership is collected from respective company’s annual reports. CEO ownership
is treated as the equity ownership without consideration of voting power2. Finally, firm size is controlled for in the model. Much prior research consider not only performance as
a determinant of managerial pay – but also firm size (Lewellen & Huntsman, 1970; Agar-wal, 1981; Cubbin & Hall, 1983; Dyl, 1988). This study uses total assets as proxy for firm
size, as it is a straightforward and concrete measure. All data on total assets is gathered from the Bloomberg Terminal for all five years.
2CEO ownership is calculated by dividing the total shares held by the CEO the current year with the total
5
Methodology
5.1
Research Model
For the purpose of investigating the relationship between CEO compensation and company performance, this study to a large extent rely upon methodology previously established in
other publications and research discussions on the subject. In particular, this thesis largely follows the outline of that of Attaway’s “A Study of the Relationship Between Company
Performance and CEO Compensation” (2000), with some modifications. While Attaway’s focus is on American companies, this study uses the same approach, but on Swedish large
and mid cap firms. In addition, a few alterations are made to the regression models in terms of the independent variables included. The study is quantitatively conducted, and
the linear model is made up of dependent, independent and control variables.
The main dependent variable in this thesis is CEO compensation, which is constituted
by aggregate cash payments of salary and bonus. Moreover, for the purpose of deepening the discussion regarding the relationship, regressions are run on CEO salary and bonus
independently. Continuing, the regressors affecting these dependent variables are divided into variables of interest, and control variables. Aiming at capturing the relationship
be-tween CEO compensation and company performance, the variables of interest are the per-formance measures ROE and EPS. The models furthermore control for other regressors
which possibly have an impact on CEO compensation, to circumvent econometric issues. Such variables include CEO tenure, age and ownership, as well as total assets of the firms.
5.2
Econometric Analysis
After the sampling procedure, the data consists of 40 companies over a five-year period. Due to the data being both cross-sectional and over multiple time periods, panel data
re-gressions are run to investigate the effects of performance on CEO compensation. Because the study is conducted on both large and mid cap companies on Nasdaq Stockholm, the
nominal values of salaries, bonuses and total assets of the companies differ substantially. Natural logarithms are therefore used in the regressions for CEO compensation and
as-sets, to examine the relative rather than the nominal effects. Additionally, the performance variable EPS is logarithmically transformed to facilitate its interpretation and to accurately
identify its relationship with compensation. Adjustment for outliers is done by winsorizing the data, decreasing the variability for all variables by substituting the one percent most
extreme values with the values of the 99th percentile.
Firstly, pooled OLS regressions are conducted on CEO cash compensation which in
this thesis amounts to the sum of salary and bonus, as well as on CEO salary and bonus separately. Holding the control variables constant in all models while substituting the
per-formance measure allows for the correlation between compensation and the perper-formance variables to be examined separately and more thoroughly. It is important to note that the
results a pooled OLS regression generate are reliable only if there are no differences be-tween companies in what factors affect the compensation given to the CEO, and will
there-fore only produce both efficient and consistent parameter estimates if an individual effect
does not exist. Since it is plausible that the model has omitted time-invariant variables relating to individual effects between firms, the pooled OLS model may not be sufficient
alone. Therefore, the study includes an additional model that is able to account for such effects. To decide whether a fixed or random effects regression model is preferable for this
effects estimators with the null hypothesis that individual effects are uncorrelated with the
other regressors. If this is true, a random effects regression model gives a more efficient result than its fixed effects counterpart.
The outputs of the Hausman specification tests reject the null hypotheses as presented in Table II, Appendix. A fixed effects model is proven to outperform the random effects
model. Consequently, regressions using a fixed effects model are carried out on both ROE and EPS as performance proxies on the dependent variables. Tenure and age must
how-ever be dropped from the models using fixed effects as these variables are perfectly corre-lated with each other over time which causes issues of serial correlation. By including a
fixed effects model, this study accomplishes to account for firm-specific effects, something much previous work that merely use pooled OLS regressions, lack (Kerr & Bettis, 1987;
Akhigbe et al., 1995; Attaway, 2000). However, the pooled OLS regression is still useful in complementing the fixed effects model as it does not omit tenure and age as experience
proxies, causing the probability of endogeneity to be lower.
5.3
Statistical Tests and Robustness
Numerous tests are performed to certify that appropriate models are used to obtain
trust-worthy results. To ensure avoidance of multicollinearity, correlation between regressors and VIF ratios are observed. Correlation between tenure and ownership is present but is
relatively low and does not pose any significant econometric problems. Low VIF values in the regression models using EPS and ROE suggest that the models do not suffer from
multicollinearity and no variables need to be dropped. Controlling for serial correlation is done using a Wooldridge test. The test provides evidence of first-order autocorrelation
being present in both the fixed effects and pooled OLS models using ROE and EPS as per-formance measures. The presence of heteroskedasticity is examined by running a modified
Wald test for groupwise heteroskedasticity on the fixed effects model, which rejects the
null hypothesis. White’s test for heteroskedasticity gives similar results indicating that the variance of the error term increases as the values of the independent variables grow.
Test-ing for cross-sectional dependence is not possible for the dataset this thesis is based upon as there is an insufficient amount of observations. As the data is heteroskedastic and
auto-correlation is prevalent, Huber-White estimators are not adequate in generating unbiased standard errors. Instead, as cross-sectional dependence could be present, Driscoll-Kraay
6
Empirical Results
The empirical results of this study bring forward interesting inferences regarding CEO
compensation on the Swedish market. The results presented draw attention to primar-ily the study’s performance variables of interest – ROE and EPS. However, in line with
previous research, the report also notes firm size as an important explanatory variable of compensation, together with some contrasting results regarding other control variables.
6.1
Hypothesis 1: Does ROE have an impact on CEO compensation?
Table I and II present the regression outputs of the two statistical models that include ROE as the explanatory performance proxy. First, by observing Table I it is apparent
that ROE is significant on the one percent level with an approximate coefficient of 0.009 when running a pooled OLS regression. Table II presents the corresponding fixed effects
model and too concludes strong significance, and a similar rounded figure of 0.009 as the coefficient. The basic interpretation of these results is that a one percentage unit increase
in ROE relates to an approximate 0.9 % positive change in CEO compensation. In light of agency theory, the implication of this relationship is that compensation plans of CEOs
on the Swedish market successfully help to reduce agency costs. With this statistically supported relationship at hand, the conclusion can be made that CEOs on the Swedish
market benefit financially from maximizing firm value by increasing performance. This supports the notion that compensation plans are set to align the interests of the principal
and the agent. This should theoretically limit unwanted behavior by the CEO in the form of over- and underinvestment, as well as other value eroding activities such as excessive
utilization of firm resources. On the basis of these regression outputs, it is thus clear that performance is significantly related to CEO cash compensation when considering ROE as
Table I: ROE – Pooled OLS
lCompensation lSalary lBonus
Variable Regression Coefficient P.Value Regression Coefficient P.Value Regression Coefficient P.Value ROE .0086515 .001 .0042272 .014 .0181594 .001 lAssets .3053408 .000 .2764959 .000 .4686533 .000 Ownership -.0436963 .000 -.0353524 .000 -.0209884 .002 Tenure .0261583 .006 .0270565 .002 .0234600 .139 Age -.0090142 .002 -.0112683 .000 -.0240350 .049
Table II: ROE – Fixed Effects
lCompensation lSalary lBonus
Variable Regression Coefficient P.Value Regression Coefficient P.Value Regression Coefficient P.Value ROE .0090308 .005 .0029170 .005 .0138242 .009 lAssets .4475452 .001 .3536459 .001 .6179014 .001 Ownership .0055186 .250 -.0037277 .321 .0400210 .010
Continuing, the results regarding ROE in above tables are in line with previous research by Veliyath & Bishop (1995) and Attaway (2000), who find a similar relationship
be-tween ROE and CEO compensation. Considering Attaway’s approximate ROE coefficient of 0.006, it should be noted that the models in this study yield a relatively stronger
re-lationship between the variables. Conversely, the rere-lationship established in this thesis contradicts conclusions made in the work of Madura et al. (1996), who do not find a
It is of interest to reflect upon the underlying reasons for the different results. It is
important to note in this discussion that Madura et al., in contrast to the other studies men-tioned, focus on a sample of small firms. Conversely, this thesis adopts a more general
approach, with a sample consisting of firms with various sizes. The lacking empirical evi-dence for a significant relationship in the study of Madura et al. may therefore stem from
structural differences between firms of different sizes. As Madura et al. also note, smaller firms’ stock tend to be lesser held by institutional investors, resulting in weaker
corpo-rate governance. This can give rise to unjustified compensation packages, which would explain the lacking evidence for a relationship between compensation and performance
in their study, but which is prominent in this thesis. Furthermore, it should be noted that Veliyath & Bishop and Attaway who concur with the results of this thesis, focus on specific
industries. In contrast, this study is delimited by its lacking acknowledgment of industry-specific effects. When considering studies on the same topic but with other performance
proxies than ROE, it is apparent that the results regarding performance and compensation in this thesis are heavily supported by previous work by for example Lewellen &
Hunts-man (1970), Coughlan & Schmidt (1985) and Jensen & Murphy (2010).
Further examining the relationship between CEO compensation and performance,
Table I and II also present the outputs of regressions that include CEO salary and bonus separately as dependent variables. Observing these results, some remarks can be made.
Firstly, it is evident that ROE is deemed significant in explaining both salary and bonus separately in both statistical models, on at least the five percent significance level. In effect,
this means that a change in ROE is reflected in both salary and bonus payments to CEOs. Thus, it appears that performance is considered when setting both salary and bonus
pay-ments to CEOs on the Swedish market. Secondly, while a relationship does exist between ROE and salary, it is weak in comparison to the performance variable’s corresponding
considerably stronger than that of ROE and salary across the different models. These
re-sults are expected, as bonus is the main variable compensation component. The regression outputs show that the coefficients of ROE in the model with CEO salary range between
0.003 and 0.004 approximately. Simultaneously, the model with CEO bonus as depen-dent variable obtains positive ROE coefficients between 0.014 and 0.018. Accordingly,
compensation plans on the Swedish market are designed to incentivize CEOs to improve company performance, with both salary, and more importantly bonus, varying with ROE.
6.2
Hypothesis 2: Does EPS have an impact on CEO compensation?
Table III and IV present regression outputs that include EPS as proxy for true performance. Examining these results, it is evident that the models yield results concordant with those of
the models using ROE as the variable of interest. The empirical evidence is indicative of a significant, yet weak positive relationship between EPS and CEO compensation. While
there is lacking research precedence on EPS and compensation, the results of this thesis can be considered somewhat in line with above conclusions. EPS seem to be an important
financial metric in setting compensation also on the Swedish market, on the basis of its statistically significant explanatory power in this study.
As with ROE, the relationship between EPS and bonus is substantially stronger than that with salary, as expected since bonuses are set based on performance while salaries
tend to be more consistent over time. The positive EPS coefficients of 0.054 and 0.078 for the pooled and fixed models on CEO salary respectively imply that salary is also affected
by a firm’s accomplishments. However, these are not significant on a five percent level and more research is required for definitive conclusions to be drawn.
Interestingly the coefficients of the logged EPS variable are systematically higher than ROE’s counterpart suggesting that the correlation with compensation is stronger for
Table III: EPS – Pooled OLS
lCompensation lSalary lBonus
Variable Regression Coefficient P.Value Regression Coefficient P.Value Regression Coefficient P.Value lEPS .1116375 .010 .0543889 .077 .2212450 .009 lAssets .2647085 .000 .2563831 .000 .3853846 .000 Ownership -.0451185 .001 -.0379588 .001 -.0168159 .009 Tenure .0250877 .014 .0283787 .004 .0161155 .277 Age -.0087272 .100 -.0111184 .027 -.0271436 .007
Table IV: EPS – Fixed Effects
lCompensation lSalary lBonus
Variable Regression Coefficient P.Value Regression Coefficient P.Value Regression Coefficient P.Value lEPS .1797789 .039 .0780830 .091 .2726947 .008 lAssets .3484194 .023 .3115442 .008 .4524665 .008 Ownership .0076385 .192 -.0029433 .385 .0429771 .001
EPS (Table IX, Appendix). Since previous studies focus mainly on other performance
measures such as abnormal returns (Coughlan & Schmidt, 1985; Kerr & Bettis, 1987; Akhibe et al., 1996) or a company’s market value (Madura et al., 1995; Jensen & Murphy,
2010), it is peculiar why more research has not been done on the topic, considering EPS as a measure of true firm performance. A possibility is that EPS is generally seen as easily
manipulated by managers, which hurts its reliability and trustworthiness. Nevertheless, the results in this study show that EPS is an important determinant of CEO compensation.
6.3
Further Implications
Investigating the overall results of the regressions displayed in Table I through IV, it is evi-dent that there are other significant determinants of CEO compensation than performance.
The meaningful impact of total assets on CEO compensation supported by the statistical models presented allows for an interesting discussion regarding to what extent firm size
affects the compensation paid out to CEOs. Several previous studies address, in addition to performance, firm size as an important explanatory variable for compensation (Meeks
& Whittington, 1975; Agarwal, 1981). The results of this study show that total assets consistently appear significant as an explanatory variable for CEO compensation with
re-gression coefficients ranging from approximately 0.265 to 0.448 in the different models. Considering the logarithmic transformation of the total assets variable, the interpretation
of these results is that a one percent increase in total assets is followed by an increase in compensation of between 0.265 and 0.448 %. Previous studies by Meeks & Whittington
(1975) and Agarwal (1981) concur with the conclusion that firm size is linked to compen-sation. Continuing, it becomes evident that there are two different organizational factors
affecting CEO compensation: firm performance and firm size. The very fact that both these variables’ coefficients are significant and positive means that CEOs on the Swedish
market hypothetically have two options to increase compensation; either by increasing the size of the firm or by improving performance. The tradeoff apparent from these
re-sults puts the goal of reducing agency costs at risk, as CEOs may still engage in empire
building and undertake projects that increase the size of the company, but conversely and simultaneously, may negatively impact the performance of the firm. Under the assumption
that the only goal for CEOs is to maximize their own compensation, CEOs will focus on the variable that makes this possible. Even though the regression coefficients for ROE and
comparisons meaningless, leaving conclusions of the relative strengths of the variables for
further research. Continuing, when relaxing the assumption that compensation is the only thing of interest, other incentive forces can influence the decisions made by CEOs. In
this case, notwithstanding a statistically explained performance-tied compensation, CEOs may still engage in activities to increase firm size at the cost of performance.
Accord-ing to Herzberg’s et al. (1993) Motivation-Hygiene Theory, many factors influence job satisfaction. Intuitively, CEOs should engage in activities that not merely increase
com-pensation, but also satisfaction at work. This reasoning is relevant in order to understand and nuance the results in an agency theory context. The empirical evidence shows that
performance-tied compensation should help reduce agency costs, however complemen-tary theory suggests that it is inadequate in removing agency costs completely. Despite
this reasoning, the statistical models generate values indicative of a statisically significant relationship between compensation and firm size.
In addition to above discussed variables, several control variables in the models are proven to hold significant explanatory power. Some of these results, however, are
ambigu-ous across the models. First, the regression output of the ownership variable deserves a closer examination. Tending first exclusively to the pooled OLS regressions presented in
Table I & III, the variable exhibits significance on the one percent level. As presented, the coefficients of ownership in the ROE and EPS pooled OLS models on total CEO cash
compensation are approximately - 0.044 and - 0.045, respectively. The interpretation of these coefficients is as follows: a one percentage unit increase in ownership results in a
change in compensation of - 4.4 % (- 4.5 %). In other words, the pooled OLS models alone indicate that as CEO ownership increases, compensation, in terms of salary and
bonus, decreases. The regressions run on salary and bonus separately show similar results. This is in line with Attaway (2000), who also finds a significant, negative relationship
a negative relationship between CEO ownership and compensation. First and foremost,
holding company stock generates a separate source of income for CEOs, in addition to regular compensation. The CEO is entitled to dividends as well as any capital gains that
the stock yields. This has an incentivizing effect for improving firm performance. By this reasoning, the negative ownership coefficient can be partly theoretically explained; a CEO
may, when possible, use her voting power and influence to decline a certain level of com-pensation, in favor of keeping the funds in the firm to pursue value adding activities. By
doing this, the CEO also benefits from the additional trust instilled in her management of the firm due to such a prioritization. Another possible reason for the negative relationship
that this study finds, can potentially be explained in terms of tax laws. In general, taxes on capital gains are lower than income taxes in Sweden. With this information at hand, there
may be reasons for CEOs to use their voting power to increase firm dividend payments. From a tax perspective, it can be advantageous for a CEO to decline a higher
compensa-tion while simultaneously increasing the dividend payout. While the results presented in Table I and III show that the variable is significant, it is important to recall the important
delimitation regarding CEO ownership – ownership has been calculated as the percentage of equity, and not voting power, that the CEO holds. The data also excludes shares that are
held indirectly by the CEO through third party ventures.
When instead investigating the ownership variable in the fixed effects regression
out-puts in Table II & IV, it is evident that the results to some extent contradict those of the pooled OLS models. In contrast to these models, the fixed effects models cannot generally
conclude that the ownership variable is significant. In addition, the signs of the coefficients are conversely positive in some outputs of these models. One must investigate these results
on an econometric level. Firstly, the exclusion of the control variables tenure and age has a direct impact on the regression outputs. Secondly, and perhaps more importantly, the
approx-imately 48.7 % after adjusting for outliers (Table I, Appendix). This variation is directly
reflected in the pooled OLS model. However, the fixed effects models, acknowledging the existence of firm-specific effects, account more specifically for the variations in ownership
withinfirms. A closer examination of the data shows that these within-firm variations are low. Specifically, CEO ownership does not change more than one percent unit across the
time periods, with the exception of merely two firms. The insignificance of the ownership variable in these models ultimately makes drawing any conclusion on the change of signs
difficult on any meaningful level.
Finally, the control variables CEO tenure and age show varying significance in the
two pooled OLS models. In the ROE and EPS models, tenure is significant on a one percent and five percent level, respectively. The signs of the coefficients are consistently
positive, with coefficient values of 0.026 and 0.025. This positive relationship is intuitive, with a higher compensation following a higher number of years within the company as
the human capital of the CEO increases. Interpreting these values, a one year increase in tenure results in an approximate 2.5-2.6 % increase in compensation. Also these results
are in line with those of Attaway’s (2000), who similarly conclude a positive, weak re-lationship between tenure and compensation. Continuing, the variable age is significant
on the one percent level in the ROE pooled OLS regression, but turns insignificant with a p-value of 0.100 in the EPS model. The models yield similar small coefficients with
an approximate value of 0.009 in both models, with negative signs. The negative signs of these coefficients, notwithstanding its weakness, may seem counterintuitive. Indeed
previ-ous studies hypothesize that CEO age should be positively correlated with compensation, for example by Madura et al. (1996). It is plausible, however, that the negative
relation-ship found in this thesis may be an issue of non-linearity of the variable. Considering that age in this thesis is handled as a strictly linear variable, it fails to capture the true effect
explanation is if there indeed are regional differences regarding how CEO compensation
changes as age increases. This would be the case if the age of the CEO is for any reason less important when making compensation decisions in Sweden than in the US.
6.4
Suggestions for Further Research
While this study can conclude general relationships between the independent variables and CEO compensation on the Swedish market, the broadness of the topic in question
allows for a more thorough analysis of the relationship to be made. As established, this study does not account for any industry specific factors. It is plausible that the structures
of compensation plans differ across industries, making this investigation interesting for further research. Another aspect worth examining more thoroughly is the differences in
compensation determinants across countries. The majority of the studies done on the subject focus on the US. While this study is done on Swedish firms, the countries are
similar in terms of the level of corporate governance. Further research deserves to be made in countries with different levels of corporate governance in order to understand whether
this factor has an impact on how firms set compensation. Finally, this study focuses strictly on compensation to the CEO. It is reasonable that also other senior managers have an
impact on firm performance. Therefore, the scope of the research on the topic could be extended to include compensation to all senior managers, and not merely the CEO.
7
Conclusion
With an increasing compensation level for CEOs around the globe, it is of utmost
impor-tance to understand its rationale and justifiability. By investigating firms on the Swedish market, this study concludes a number of noteworthy results. Firstly, the study reports a
positive, significant relationship between CEO compensation and company performance. Thus, the null hypotheses of the thesis are rejected. While the correlations are weak, the
significant relationships indicate that performance is an explanatory variable for compen-sation using both ROE and EPS as proxies. Secondly, the same conclusion holds when
investigating the compensation components salary and bonus independently, where the strongest relationship is found between bonus and performance. As the results are to a
large extent in line with previous research, it is not evidently so that differences over time and region exist, in regard to compensation plans. Finally, these results also support the
notion that compensation is used as an incentivizing tool in order to reduce agency costs. From this study, it can thus be deduced that compensation packages on the Swedish market
are designed to align the interests of shareholders and CEOs.
In addition to the performance variables, the study finds significant relationships with
several other variables. Firm size, proxied by total assets, is positively correlated with CEO compensation, which supports previous studies claiming that firm size is a significant
determinant. The results indicate that a tradeoff exists for CEOs on the Swedish market, regarding whether to increase the size of the firm, or improve its profitability in order
to maximize compensation. With these results at hand, it appears that firms bear a risk of suboptimal CEO behavior. A relative comparison between the incentivizing effects of
increasing firm size and improving performance is not in the scope of this thesis, but left for further research.
Another finding of this study includes the role of CEO ownership as a compensation
determinant. While the models yield somewhat different results regarding this variable, the study indicates an overall negative relationship between the variable and compensation.
The variables tenure and age, serving as experience proxies, give some conflicting results. The results show that tenure is positively related to remuneration while age has a negative
coefficient, indicating that compensation increases with work place experience rather than with age.
This study contributes to the overall discussion on the topic of CEO compensation. The concordance of these and previous results supports the claim that CEO compensation
is, at least to some extent, justified. The study is thus able to draw the final conclusion that compensation plans do help in reducing agency costs – an inherently existing problem in
8
References
LiteratureAgarwal, N. (1981). Determinants of Executive Compensation.Industrial Relations: A Journal of Economy and Society, 20(1), pp.36-46.
Akhigbe, A., Madura, J. and Tucker, A. (1995). Reexamining the Link Between Executive Compensation and Corporate Performance: A Note.American Business Review, 13(2).
Attaway, M.C. (2000). A study of the relationship between company performance and CEO compensation.
American business review, 18(1), pp.77–85.
Brander, J. and Poitevin, M. (1992). Managerial compensation and the agency costs of debt finance. Man-agerial and Decision Economics, 13(1), pp.55-64.
B˚ang, J. and Waldenstr¨om, D. (2009). R¨orlig ers¨attning till vd – vad s¨ager forskningen?.IFN Policy Paper nr 27 and Ekonomisk Debatt, yr. 37, nr 5, 41–56.
Coughlan, A. and Schmidt, R. (1985). Executive compensation, management turnover, and firm perfor-mance.Journal of Accounting and Economics, 7(1-3), pp.43-66.
Cubbin, J. and Hall, G. (1983). Directors’ remuneration in the theory of the firm: Specification and testing of the null hypothesis.European Economic Review, 20(1-3), pp.333-348.
DeMarzo, P. and Berk, J. (2014).Corporate Finance. 3rd ed. Boston: Pearson, p.560.
Dyl, E. (1988). Corporate Control and Management Compensation: Evidence on the Agency Problem.
Managerial and Decision Economics, 9(1), pp.21-25.
Herzberg, F., Mausner, B. and Snyderman, B. (1993).The Motivation to Work. New Brunswick: Transaction Publishers.
Ittner, C., Larcker, D. and Rajan, M. (1997). The Choice of Performance Measures in Annual Bonus Con-tracts.The Accounting Review, 72(2), pp.231-255.
Jensen, M. (1986). Agency Costs of Free Cash Flow, Corporate Finance, and Takeovers. The American Economic Review, 76(2), pp.323-329.
Jensen, M. and Meckling, W. (1976). Theory of the firm: Managerial behavior, agency costs and ownership structure.Journal of Financial Economics, 3(4), pp.305-360.
Jensen, M. and Murphy, K. (2010). CEO Incentives - It’s Not How Much You Pay, But How. Journal of Applied Corporate Finance, 22(1), pp.64-76.
Kanagaretnam, K. and Sarkar, S. (2011). Managerial compensation and the underinvestment problem. Eco-nomic Modelling, 28(1-2), pp.308-315.
Kerr, J. and Bettis, R. (1987). Boards of Directors, Top Management Compensation, and Shareholder Re-turns.Academy of Management Journal, 30(4), pp.645-664.
Lewellen, W. and Huntsman, B. (1970). Managerial Pay and Corporate Performance. The American Eco-nomic Review, 60(4), pp.710-720.
Madura, J., Martin, A. and Jessell, K. (1996). Determinants of CEO compensation in small publicly-traded business.American Business Review, 14, pp.80-88.
Mauer, D. and Ott, S. (2000). “Agency Costs, Under-investment, and Optimal Capital Structure: The Effect of Growth Options to Expand” in Brennan, M. and Trigeorgis, L. (Eds.). Project Flexibility, Agency, and Competition. Oxford University Press, New York (2000), pp. 151-180.
Meeks, G. and Whittington, G. (1975). Directors’ Pay, Growth and Profitability. The Journal of Industrial Economics, 24(1).
Miller, D. (1995). CEO Salary Increases May Be Rational after All: Referents and Contracts in CEO Pay.
The Academy of Management Journal, 38(5), pp.1361-1385.
Mishel, L. and Schieder, J. (2018). CEO compensation surged in 2017.Economic Policy Institute.
Myers, S. (1977). Determinants of corporate borrowing.Journal of Financial Economics, 5(2), pp.147-175. Sachau, D. (2007). Resurrecting the Motivation-Hygiene Theory: Herzberg and the Positive Psychology Movement.Human Resource Development Review, 6(4), pp.377-393.
Veliyath, R. and Bishop, J. (1995). Relationship Between CEO Compensation and Firm Performance: Empirical Evidence of Labor Market Norms. The International Journal of Organizational Analysis, 3(3), pp.268-283.
Databases
Bloomberg. (2019). Bloomberg Terminal. [Online]. Available at: Subscription Service (Accessed: April 2019)
S&P Capital IQ. (2019). S&P Capital IQ. [Online]. Available at: Subscription Service. http://www.capitaliq.com/ (Accessed: April 2019)
9
Appendix
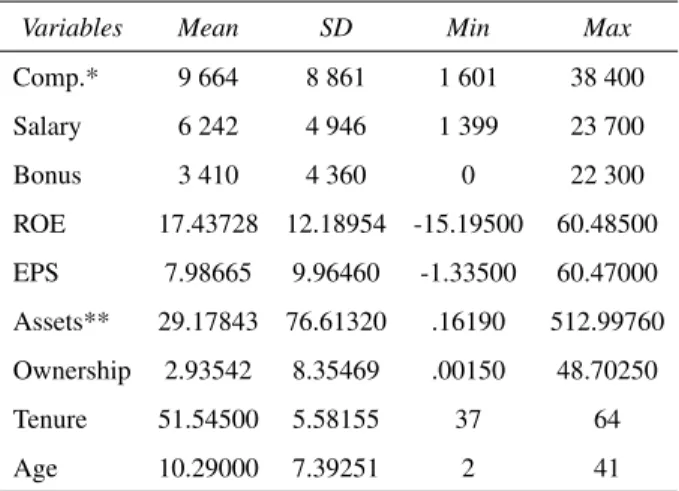
Table I: Descriptive Statistics
Variables Mean SD Min Max Comp.* 9 664 8 861 1 601 38 400 Salary 6 242 4 946 1 399 23 700 Bonus 3 410 4 360 0 22 300 ROE 17.43728 12.18954 -15.19500 60.48500 EPS 7.98665 9.96460 -1.33500 60.47000 Assets** 29.17843 76.61320 .16190 512.99760 Ownership 2.93542 8.35469 .00150 48.70250 Tenure 51.54500 5.58155 37 64 Age 10.29000 7.39251 2 41
*Compensation in thousands (SEK) **Assets in billions (SEK)
Table II: Hausman Specification Tests
Model Chi-square Significance ROE 9.44 .0240 EPS 8.48 .0379
Table III: Correlation Matrix
lComp. lSalary lBonus ROE lEPS lAssets Ownership Age Tenure lComp. 1.0000 lSalary .9565 1.0000 lBonus .8770 .7247 1.0000 ROE -.1226 -.1495 -.0423 1.0000 lEPS .5490 .5096 .5249 .0811 1.0000 lAssets .8210 .8122 .6856 -.2192 .5369 1.0000 Ownership -.2201 -.1787 -.2858 .0270 -.1966 -.3715 1.0000 Age .2657 .2815 .1391 .0269 .1475 .3392 -.0411 1.0000 Tenure .1153 .1671 -.0250 -.0532 .0413 -.0770 .5254 .2713 1.0000
Table IV: VIF - ROE
Compensation Salary Bonus
Variable VIF VIF VIF
ROE 1.14 1.14 1.10 Assets 1.34 1.34 1.42 Ownership 2.46 2.46 1.65 Tenure 2.73 2.73 1.57 Age 1.60 1.61 1.31 Mean 1.86 1.86 1.41
Table V: VIF - EPS
Compensation Salary Bonus
Variable VIF VIF VIF
EPS 1.42 1.42 1.43 Assets 1.63 1.64 1.75 Ownership 2.57 2.57 1.65 Tenure 2.88 2.89 1.60 Age 1.49 1.50 1.28 Mean 2.00 2.00 1.54
Table VI: Wooldrige Tests for Serial Correlation
Model F.Value Significance
ROE - Pooled 19.113 .0001 ROE - FE 28.349 .0000 EPS - Pooled 14.318 .0005 EPS - FE 21.436 .0000
Table VII: Modified Wald Tests for Heteroskedasticity in Fixed Effects Models
Compensation Salary Bonus
Model Chi-square Significance Chi-square Significance Chi-square Significance ROE 93 410.65 .0000 15 938.19 .0000 1.2e+05 .0000 EPS 5.0e+05 .0000 27 369.67 .0000 2.2e+05 .0000
Table VIII: White Tests for Heteroskedasticity in Pooled OLS Models
Compensation Salary Bonus
Model Chi-square Significance Chi-square Significance Chi-square Significance ROE 124.59 .0000 125.11 .0000 51.88 .0001 EPS 123.04 .0000 124.08 .0000 48.53 .0004
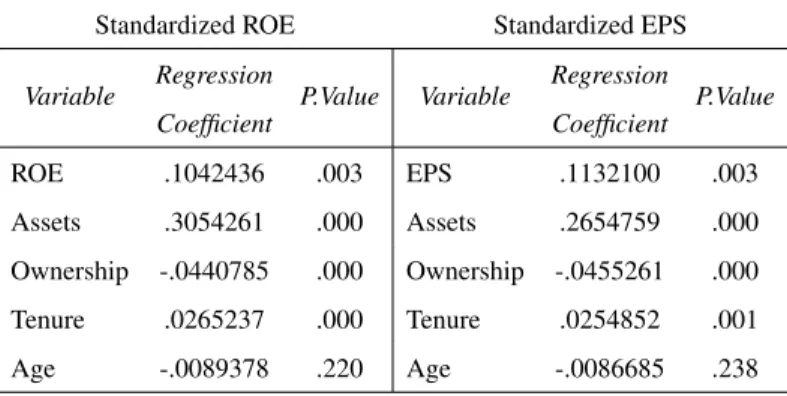
Table IX: Standardized Comparison of Variables
Standardized ROE Standardized EPS Variable Regression
Coefficient
P.Value Variable Regression Coefficient P.Value ROE .1042436 .003 EPS .1132100 .003 Assets .3054261 .000 Assets .2654759 .000 Ownership -.0440785 .000 Ownership -.0455261 .000 Tenure .0265237 .000 Tenure .0254852 .001 Age -.0089378 .220 Age -.0086685 .238
Table X: List of Companies in Sample
Large cap Mid cap
Addtech Acando
Ahlstrom-Munksj¨o Besqab
Assa Abloy Bilia
AstraZeneca BTS Group Autoliv Concentric Boliden Elanders Hexagon Enea JM Fagerhult Latour G5 Entertainment Lifco Gr¨anges
Lundbergf¨oretagen HiQ International
Modern Times Group HMS Networks
NetEnt Inwido
Oriflame Knowit
SSAB Midsona
Securitas Nederman Holdings
Sweco RaySearch Laboratories
Tieto SkiStar
Trelleborg Tobii