KA TIIOLIEKE UNNERSITEIT LEUVEN
DEPARTEMENT TOEGEPASTE
ECONOMISCHE WETENSCHAPPEN
RESEARCH REPORT 0133PRICING AND SUPPLIER CONCENTRATION IN THE PRIVATE CLIENT SEGMENT
OF THE AUDIT MARKET: MARKET POWER OR COMPETITION?
by
M. WILLE KENS C. ACHMADI
Pricing and Supplier Concentration
in the
Privat~
Client Segment of the Audit Market:
Market Power or Competition?
by
Marleen Willekens and Christina Achmadi
August 200t
Marleen Willekens is associate professor of Accounting and Christina Achmadi is research assistant, both at the Catholic University of Leuven. The authors wish to thank participants at the annual congress of the European Accounting Association in Athens (2001), and especially Robert Knechel and Marc Jegers for comments on an earlier versions of this paper. The usual disclaimer applies. Marleen Willekens thanks the the FWO-Vlaanderen and the PwC Chair "Value and Risk" for financial support.
Correspondence:
Marleen Willekens, Katholieke Universiteit Leuven, Naamsestraat 69, B-3000 Leuven, Belgium, Email: [email protected], Tel: 32-16-326932.
Pricing and Supplier Concentration in the Private Client Segment of the
Audit Market: Market Power or Competition?
ABSTRACT
This study differs from prior audit pricing-studies as 1) it focuses on the issue of price competition in the (small) private client segment of the audit market, and 2) addresses the question whether and how the aUdit-pricing model changed in that market between 1989-1997. Given the significant increases in market concentration and two big audit-fIrm mergers in that period, we try to assess whether price competition (market power) has increased (decreased) or decreased (increased). We use Belgian data on privately owned companies from 1989 and 1997 for our analyses. We fmd that audit fees are significantly associated with the incumbent auditor's market share both in 1989 and 1997. Our results are in line with prior studies on public client samples and hence do not support prior assumptions (see, for example, Simunic 1980) that there are no price premia charged by large auditors in the small-client segment of the audit market. It is however not clear whether the reported price premium is due to market power or differentiated audit quality. As to the evolution of audit pricing in the private client segment of the Belgian audit market between 1989 and 1997, we fmd that the impact of various audit-fee determinants changed signifIcantly and report evidence supportive of increased price competition.
1. INTRODUCTION
Many studies have addressed aUdit-pricing issues in the past. Early aUdit-pricing research was inspired by concerns about price competition in the audit market as a result of the high levels of supplier concentration. The question whether audit markets are price competitive remained valid in the nineties, especially as the consolidation trend between the big international accounting fIrms had continued. The vast majority of audit-pricing studies focuses on the public-client segment of the audit market and reports evidence consistent with price competition in that market. Price premia are reported for big 8/6 fIrms, but these are explained as evidence supportive of quality-differentiated services, rather than arguments against price competition.
This study differs from prior studies and contributes to audit pricing research in at least two respects. First, we focus on the question of price competition in the (smaIl) private client segment
of the audit market. In prior studies, one often assumes that price competition prevails in the smaIl client segment of the audit market because of its low concentration (see, for example, Simunic 1980). However, to our knowledge this assumption has never been directly tested. Second, given the significant increases in market concentration and two big audit-finn mergersi in the late
eighties, we address the question whether and how the audit-pricing model changed in that market during the last decade of the fonner millennium. The mergers and the increase in concentration may have changed the market position and power of the players in the audit market, and there is a general concern that the degree of competition may have dropped. However, audit practitioners typically claim that the increased concentration has increased rather than decreased price competition. Prior aUdit-pricing studies based on samples of public clients indeed report evidence that is supportive of increased price competition. Menon and Williams (2001) report flat (and not increased) audit fees during the nineties. Pearson and Trompeter (1994) report a negative association between audit fees and the level of supplier concentration. The validity of the latter study is, however, limited as only the insurance industry was included in the sample. Furthennore, the sample only covered a relatively short time period in which concentration ratios exhibited only limited variablity. In our study we report a signifIcant increase in concentration in the Belgian audit
market between 1989 and 1997. We then assess whether the audit pricing model changed over that time period and whether detected changes are consistent with increased price competition or increased market power.
We use Belgian data from 1989 and 1997 for our analyses, as the vast majority of the clients in the Belgian audit market are privately owned companies with an average size (namely about 2 billion Belgian Francs or 50 million Euro) that is small compared to other industrialized countries. We chose to adopt these two years because 1989 data are still unaffected by the two megamergers that took place in that year, and 1997 data should already fully incorporate their effect. We propose a new surrogate to assess market concentration based on persounel cost data per audit firm. To this end, we collected all financial statements submitted by Belgian audit firms to the Belgian National Bank in those two years. We adopt a measure proposed in the literature of industrial organization (see Parker, 1991) to assess whether supplier concentration is significant in the Belgian audit market and fmd that this is not the case, both in 1989 and 1997. We do however fmd that the increase in concentration between 1989 and 1997 is significant.
To address our research questions, namely whether 1) audit pricing is competitive in the private client segment of the Belgian audit market and 2) the audit-pricing model changed between 1989 and 1997, we had to collect audit-fee information through surveys as fees are not publicly disclosed in Belgium. We fmd that audit fees are significanlty associated with the incumbent auditor's market share both in 1989 and 1997. Our results are in line with prior studies on public client samples and hence do not support prior assumptions that there are no price premia charged in the small (non-concentrated) client segment of the audit market. We also find evidence supportive of an increase in price competition in 1997 compared to 1989. In particular, we tested whether the impact of various audit fee determinants changed significantly between 1989 and 1997. To that end we used Chow tests.
The remainder of this paper is organized as follows. In the next section we provide a literature review. In Section 3, we describe those characteristics of the Belgian audit environment that are relevant to this study. We also provide evidence on supplier concentration in the Belgian
audit market and assess its significance. We then specify our research questions in Section 4. In
Section 5 we define the audit-fee model that we will adopt and describe our research design. We then discuss our sample selection procedures and the main results of our analysis in Section 6.
Finally, we present our conclusions L1! Se-etion 7.
2. LITERATURE REVIEW Audit market concentration studies
Ample empirical evidence has been published on audit market concentration2• These studies were inspired by concerns about the possible anti-competitive effect of the presence of a few dominant players (Le. the big 8/6 accounting firms) in the audit market and the mergers between some of the big 8 firms. Early studies stem from the public client segment of the U.S. audit market, and include Zeff and Fossum (1967), Rhode et al. (1974), Schiff and Fried (1976), and Dopuch and Simunic (1980). Concentration ratios reported in these studies range (depending on the surrogate used for fees) from abont 65-70% for the CR4 to as high as 95-98% for the CR8. Several studies questioned the contention that high market concentration was the result of lack of competition, and report (sometimes weak) evidence supportive of price competition (see, for example, Dopuch and Simunic, 1980; Campbell and McNiel, 1985; Danos and Eichenseher, 1986).
The megamergers between some of the largest big 8 firms in 1989 were a reason why audit market concentration studies have continued in the nineties. Again, there was a great concern of possible monopoly power and/or loss of objectivity and independence as ouly a few firms dominated the audit market. Minyard and Tabor (1991) and Tonge and Wootton (1991) examined the proforma impact of the big 8 mergers of 1989. Both studies predicted that the mergers would have little impact on competition and could actually increase competition in the audit industry. Wootton et al. (1994) even indicate that although those mergers resulted in increased concentration ratios, the analysis suggests that the industry is becoming better balanced in competition within the
group of big audit firms. An important consequence is also the much bigger gap between the rust tier audit firms and the other (smaller) audit firms in the market.
As to European evidence, audit market concentration studies were performed in various national audit markets (see, for example, Moizer and Turley, 1987; Christiansen and Loft, 1992; Buijink and Maijoor, 1993; Loft and Sjiifors, 1993; Beattie and Fearnley, 1994; Corona Romero et al., 1995; Marten, 1996; Weets and Jegers, 1997; Pong, 1999). Although the level of market concentration differs between European countries, an increase in the eighties and nineties is apparant in most countries. Interesting is that some studies report a significant difference in big 6 market shares depending on the client segment. For example, Pong (1999) reports for the U.K. market that the big 6 market share ranged from about 50% in the small size client segment to 98% in the largest client segment of the UK audit market. As to Belgium, Weets and Jegers (1997) report that concentration ratios are lower than in most other industrialized countries, but also that there is an increasing trend in big 8/6 market shares in the Belgian audit market during the 80s and 90s. A further discussion of audit market concentration in Belgium as compared to other countries follows in the next section (See also Tables 1 and 2 which are discussed later on).
Audit fee studies
Based on the empirical evidence of high supplier concentration in the audit market, early audit fee research was mainly inspired by concerns about price competition in the audit market. In his seminal paper, Simunic (1980) proposed a model of audit pricing to test for competition in the US audit industry. He assumed that price competition prevails in the small auditee market segment because of the lower supplier concentration in this segment, but that the large auditee market may not be competitive because of big 8 concentration. By comparing pricing in the two market segments, Simunic draws conclusions about competition in the audit market. From the results of his study the hypothesis that the audit market is competitive could not be rejected, as no significant premia were found for big 8 rrrms in the large client segment of the market. Many subsequent studies adopted a similar approach to study audit pricing (see, for example, Francis, 1984;
Palmrose, 1986a and 1986b; Francis and Simon, 1987; Ettredge and Greenberg, 1990; Pong and Whittington, 1994; Lee, 1996 and DeFond et al., 2000). Unlike Simunic, most studies report a significant big 8/6 audit fee premium and explain this finding by product differentiation by the big
explained by size differences in the client samples under investigation.
Later audit fee studies (see, for example, Pearson et al., 1994; Craswell et al., 1995; Deis et al., 1996; and DeFond et al., 2000) were mainly concerned with specific determinants of audit fees, such as the effect of auditor switching, auditor concentration and auditor industry specialization.
Fees studies have also been done outside the U.S. For example, Francis (1984), Francis and Stokes (1986), Craswell et al. (1995) report evidence on the Australian market; Chan et al. (1993), Pong and Whittington (1994), Taffler and Rarnalinggam (1982) on the UK market; Firth (1985) on the New Zealand market; Anderson and Zeghal (1994) on the Canadian market; and Chung and Lindsay (1988), Dominica Suk-yee Lee (1996), Gul (1999) and DeFond et al. (2000) on the Hong Kong market. Overall, we can conclude that: 1) a fairly robust audit fee model seems to explain 50%-70% of audit fee variations across the world, including auditee size, client complexity and riskiness as explanatory variables, and 2) significant price premia for big 5/6 finns are observed worldwide. Note that almost all prior audit fee studies used samples of public clients.
Long-Term trends in audit fees
In a recent study, Menon and Williams (2001) report evidence on long-term trends in audit fees in the US audit market. They find that fees increased in the 1980s but stayed flat in the 1990s. In
particular, a significant increase in fees is noted in 1988, which the authors attribute to an expansion of audit effort as a response to the issuance of the expectations gap standards. The evidence also indicates a short-term but not a long-term effect of the big 8 mergers in 1989 on audit pricing. Some changes in the audit fee model over the sample period (1980-1997) are also documented. For example, the magnitude of the coefficients for accounts receivable and inventory
have declined which can be atributed to audit productivity improvements. Important to note is that the sample in the study was restricted to clients of big 6 firms that voluntarily disclosed audit fees in the period 1980-1997. This implies that no evidence is obtained on the non-big 6 client segment of the market, nor on the privately held firm segment of the audit market.
Audit pricing and supp6er concentration
Although both audit fee and supplier concentration studies were inspired by concerns about competition in the audit market as a result from increased supplier concentration, both literatures have developed quite separately and the relationship between supplier concentration and audit pricing has hardly been tested directly. An exception is the study by Pearson and Trompeter (1994). They investigate the effect of supplier concentration on audit fees for the life and health insurance and property and casualty insurance industries in the U.S over a four-year period (namely, 1983-1986). They found that concentration is negatively associated with fees, suggesting that higher levels of concentration be related to higher levels of price competition. This finding is interesting as it does not confirm prior concerns that supplier concentration may increase market power of big 8/6 firms and hence affect audit pricing in a positive way. There are however two limitations to this study. First, as only two U.S. industries are examined, the external Validity of the study may be limited. Second, the sample period covers a relatively short time period during which the concentration ratios exhibited only limited variability in each industry. In our study, we
try to address some of these limitations, and investigate (for the private client segment of the audit market) whether the audit pricing model changed over a period (i.e. 1989 and 1997) in which two mergers between big 8 firms occurred and concentration in the audit market increased significantly.
3. THE BELGIAN AUDIT MARKET Audit Demand, Supply and Production Regulations in Belgium
Audit demand, supply and production is heavily regulated in Belgium. In this subsection we discuss regulations that may affect the competitiveness of the Belgian audit market. Unlike the situation in the U.S., demand for audit services is not voluntary for many privately held companies in Belgium. The Act of 21 February 1985 prescribes that both public and private limited liability companies of a certain size are required to have their annual financial statements audited by a licensed statutory auditor. These size criteria3 are not all that large which implies that many relatively small companies are legally required to appoint a statutory auditor. We believe that one consequence is that actual demand is larger than what it would be if it were free and solely based on economic motivations. Demand regulation for privately held firms probably also has an impact on auditor choice decisions. As there may be little or no need for auditing based on economic grounds, relatively small private companies with few agency problems may opt for the cheapest audit possible in order to fulfill legal requirements. This may explain why the seller concentration ratios are smaller in Belgium than in other legal environments (see next subsection). As large audit fmns tend to be more expensive, smaIl companies will not acquire services from these audit firms.
Audit supply is also regulated in Belgium. Meeuwissen and Maijoor (1997) reviewed and compared audit supply regulations that can be expected to have a direct impact on competition in three national audit markets, namely Belgium, the Netherlands and Germany. They conclude that Belgium and Germany are less liberal than the Netherlands in terms of audit market regulations, and that therefore the Belgian and German audit markets can be expected to be less competitive than the Dutch. We will give a short overview of various aspects of audit supply that are regulated in Belgium and which may affect competition in the Belgian audit market. First, there is a limitation as to who can offer the statutory audit service4. Since the Act of 21 February 1985, only members of the IRElIBR are entitled to conduct statutory audits. This implies that the amount of potential suppliers of statutory audits is much smaller in Belgium compared to countries where
such a restriction does not exisr. Second, the admission to the audit profession is regulated through the Royal Decree of 13 October 19876• Third, there are some regulations with respect to the auditor's appointment. These include prohibition of sollicition and restrictions on advertising. Note that advertising roles have become less stringent in the nineties, but sollicitation is still forbidden. Only factual and objective advertising on a local scale is permitted. Furthermore, statutory auditors are formally appointed by the general assemby of shareholders for a period of
three years. Fourth, the code of professional ethics is incorporated in the law by the Royal Decree of 10 January 1994. The most important part in the code of ethics concerns auditor independence. Interesting to note is that the Belgian independence rules prohibit auditors to be employed outside the auditing profession7• Finally, it is relevant to note that only since the early nineties big
international accounting firms began to operate under their own brandname in Belgium. Before they operated through local partnerships because the use of international brandnames was forbidden.
As to audit production, there are also regulations that may affect the Belgian audit market. Auditing standards obviously affect the production of audit services and in Belgium they are set by the Belgian Institute of Auditors (mRlIRE). Of further relevance is that the Institute of Auditors also has a legal role in monitoring the competitive structure of the Belgian audit market by monitoring the pricing practices of its members. It is believed that fierce price competition would have a negative impact on auditor performance and audit quality, and therefore every auditor who is a member of the Institute is required to report to the Institute the number of hours spent on all engagements and the corresponding audit fees charged. The Institute then reviews the adequacy of the audit fees charged and the audit hours worked by Belgian auditors to safeguard audit quality.
Evidence on Supplier Concentration in the Belgian Audit Market: 1989-1997
Supplier concentration in the Belgian audit market is best measured using audit fee data. As in many other countries, however, audit fee data are not publicly available in Belgium and we therefore report audit market concentration data based on various surrogates8• Table 1 includes
CR4, CR6, CR8 ratios and the Herfindahl index for the Belgian audit market, and is based on the results from a study by Weets and Jegers (1997)9 for the years 1989 through 1994/1995, and our own assessments for the years 1989 and 1997 as these years are relevant to the empirical analysis further L.'1 our study. We believe that our own assessments are pa...rtJcular!y relevant as they are based on auditor data instead of client data. The surrogates we used are: 1) the number of qualified professionals per audit firm (as in Weets and Jegers, 1997), and 2) the personnel cost per audit firm as reported in the fmancial statements of the audit firm. To assess the concentration ratios based on the second surrogate, we had to collect all financial statements submitted by Belgian audit firms to
the Belgian National Bank for the years 1989 and 1997. From those fmancial statements we obtained the personnel cost and used it to compute the respective concentration ratios (CR4, CR6, CR8 and HHI). Since only limited liability companies that hit certain size thresholds have to submit fmancial statements to the Belgian National Bank, our sample did not include the smallest audit suppliers in BelgiumlO• From inspection of Table 1 it is clear that market concentration gradually increased between 1989 and 1997.
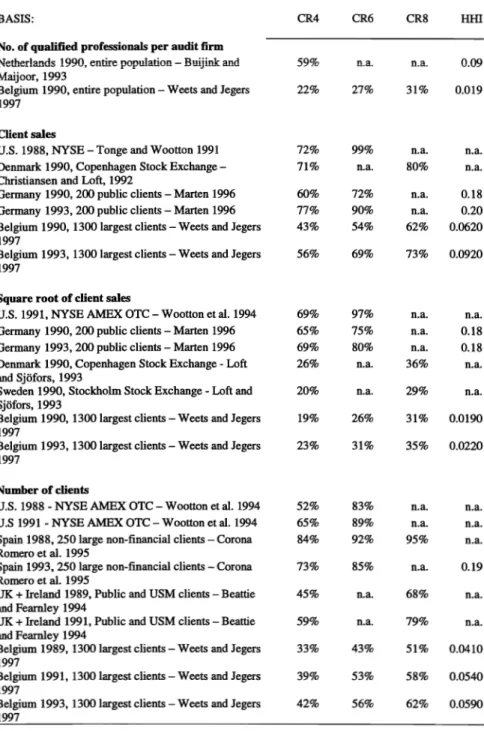
[Insert Table I and Table 2 about here]
Table 2 provides an overview of concentration ratios in several European countries and the U.S., based on various surrogates. From inspection of Table 2, it looks like supplier concentration is much smaller in Belgium than in many other countries, such as the Netherlands, the U.K., the U.S., Germany and Spain. Only Denmark and Sweden have concentration ratios comparable to the low levels reported for Belgium. One needs to keep in mind, though, that most measures in other countries were based on samples of public firms, whereas the Belgian measures were based on the 1300 largest (also non-public) firmsll. Another interesting feature from both Tables I and 2 is that supplier concentration tends to increase in all countries during the nineties (including Belgium).
A qualitative interpretation of the size of concentration ratios per se does not provide strong evidence. Therefore we execute some further tests to assess an anwer to the following two questions: First, was supplier concentration in the Belgian audit market significant, both in 1989
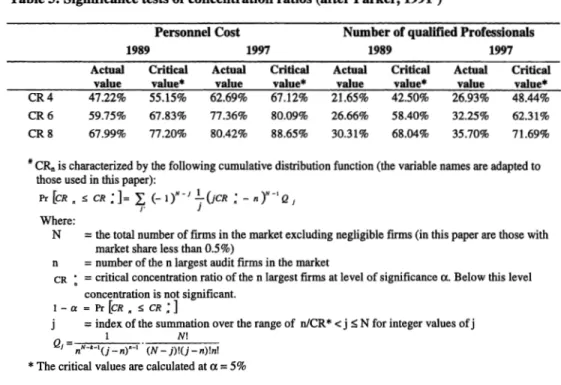
and 1997? And second, is the increase in supplier concentration between 1989 and 1997 significant? To answer the fIrst question, we use a method suggested in the Industrial Organization literature by Parker (1991) to interpret how severely concentrated a market is. The basic idea of the method is to test whether a particular concentration ratio is significantly larger than a benchmark ratio that is being generated by a purely random allocation of market shares12• We computed such benchmark ratios based on the 'personnel cost' and 'number of qualified professionals' surrogates, both for 1989 and 1997. The results of our application of the Parker method are reported in Table 3 and indicate that the CR4, CR6 and CR8 in our study are individually not signifIcant (at p < 5%) both for 1989 and 1997, as they are below the computed critical values. This evidence is consistent with our prior conclusion that the Belgian audit market is not very concentrated compared to other national audit markets.
[Insert Table 3 about here]
As to the change in the respective concentration ratio numbers (CR4, CR6 and CR8) between 1989 and 1997, we considered the change in the average aggregate market share of the biggest audit fIrms: that is, the big 8 in 1989 and the big 6 in 1997. We then tested whether this change is significant by the t-test of mean differences (where the null hypothesis is that there is no change in the average market share, and the alternative hypothesis is that there is signifIcant increase). As there may be a concern about the normality of the data, we also executed a Wilcoxon rank sum test. We fonnd that the t-tests on both types of concentration ratios were signifIcant with p-values less than 5%, as were the Wilcoxon testsl3 • Overall, we can conclude that although the concentration ratios per se were not significant both in 1989 and 1997, we have evidence that the increase in supplier concentration in the Belgian audit market between 1989 and 1997 was significant.
Conclusions
ill this section we demonstrated that demand, supply and production of audit services is heavily regulated in Belgium and then provided evidence of supplier concentration and its evolution between 1989 and 1997. We interpret the findings as follows. The mandatory audit requirement since 1985 resulted in ample audit demand by (relatively small) privately held firms, especially to the benefit of local (small) audit suppliers. ill addition, audit supply regulations also seem to benefit small audit suppliers. Consequently, small suppliers of the audit services held a powerful market position relative to the larger suppliers, which explains the insignificant supplier concentration ratio in 1989. However, some things changed between 1989 and 1997. ill 1989, the Big 8 had not yet merged into the big 6(5) and they were operating under local brandnames in the Belgian audit market. By 1997 two big 8 mergers had taken place, the big 6 tmns were operating under their own brandname and advertising regulations were less stringent. The result was a gain of market power by the big 6 in the market for privately held tmns and a significant increase in supplier concentration between 1989 and 1997. Supplier concentration per se, however, was still insignificant in 1997.
4. REsEARCH QUESTIONS
The evidence on supplier concentration presented above raises at least two interesting research questions about audit pricing in the private client segment of the Belgian audit market. First, given the lower concentration ratios in that market segment, do large audit suppliers (in terms of market share) charge audit-fee premia as is the case in the market segment for publicly held firms? Second, given the significant increase in supplier concentration and two mega-mergers between big 8 tmns, did the audit pricing model change between 1989 and 1997?
To answer the first question, we will test whether market power (proxied by auditor market share) has an impact on audit pricing, both in 1989 and 1997 (that is before and after the mega-mergers that happened in 1989). Most oligopoly theories predict a positive relationship between market price and seller concentration (see, for example, Weiss (1989». It is argued that in
a market with a few dominant players, the likelihood of collusion and price leadership is larger. However, the evidence from prior audit fee research suggests that [1] high concentration may allow market leaders to develop expertise-related economies of scale that allow them to maintain relatively low fees (Danos and Eichenseher, 1982, 1986; DeFond et al., 2000), and [2] fee premia charged by big 8/6 firms are a result from product differentiation rather than market power (Francis, 1984; Palmrose, 1986; Francis and Simon, 1987; Lee, 1996). In the context of our study of the private client segment of the audit market, it is reasonable to expect that large audit firms experience more competition from local and national auditors than they do in the public client segment. Hence, given the relatively low concentration ratios in the Belgian audit market, we only expect a signifIcant price premium should there be product differentiation by large audit firms. Our first research question is stated below:
RQ 1: Is there a significant positive association between auditor market share and audit pricing in the private client segment of the audit market, ceteris paribus? And is this the case in both 1989 and 1997?
The second question we try to address is whether the significant increase in seller concentration from 1989 until 1997, which are partially due to the mergers of the big 8 into the big 6, had any impact on the audit-pricing model. We chose 1989 as our first observation year, as it was the last year before the two mergers could start to have an effect on pricing practices. We opted for 1997 as our second observation year as it left enough time after the mergers so that a new 'equilibrium' pricing model could be established. Note that the time interval between our 2 observation years has to be sufficiently long as there is a fixed auditor tenure period of three years in Belgium. Also pricing evidence in Menon and Williams (2001) for the public client segment of the U.S. audit market, indicates that mergers first have an increasing effect on pricing which disappears (into a status quo) after a few years.
To the extent that the increase in market concentration led to an increase in market power of the largest audit firms, we may expect an increase in audit fees charged by these firms, ceteris
paribus. However, the mergers may not necessarily have led to less competition and higher prices. Tonge and Wootton (1991), for example, state that the merger of the smaller big 8 fInns may have had the effect that they have become more competitive with the larger big 8 fIrms. Further, the
sa..wne rnay hold for mergers of non=big 6 fmns \vith big 6 f.LI.~. Hence two opposite hypotheses
with respect to audit pricing before and after the mergers are likely: an "increased market power hypothesis" and an "increased competition hypothesis". According to the market power hypothesis the increase in individual market shares of large auditors and the related increase in audit market concentration between 1989 and 1997 is associated with signifIcant audit price increases between 1989 and 1997. According to the increased competition hypothesis, the increase in individual market shares of large auditors and the related increase in audit market concentration between 1989 and 1997 has no impact on audit pricing between 1989 and 1997, or would be associated with signifIcant price decreases between 1989 and 1997. To find out which of these two hypotheses is empirically supported, we will to address the following research questions:
RQ 2A: Did the audit-pricing model change between 1989 and 1997?
RQ 2B: Did the impact of auditor market share and other significant determinants in the
audit-pricing model change between 1989 and 1997?
5. AUDIT FEE MODEL AND RESEARCH METHOD The Audit Fee Model
To examine the effect of the market power of audit firms on audit pricing, we adopt an audit-fee model (see eq. 1) that is consistent with prior audit fee research (see, for example, Simunic, 1980 and subsequent studies) and that has proven to be robust over time and countries.
LNFEE= a. + ~1 POWER + ~2 LNASSET + ~3 SUB + ~4 QUICK + ~5 LTD + ~6 LOSS +~7
RECINV + ~8 SWITCH + ~9IAUD + ~9 MANUF + ~ 10 TRADE (1) where:
Dependent variable:
LNFEE = natural log of audit fee Independent variables:
POWER LNASSET SUBS QUICK LTD LOSS RECINV SwTICH lAUD MANUF TRADE
auditor market share proxy natural log of total assets (client)
square root of the number of operating locations quick ratio
long term debt divided by equity
indicator variable (1 = experienced loss in the last 2 years, 0 otherwise) (account receivables + inventory)/total assets
indicator variabie (i = engage in auditor switch within the iast 2 years,
o
otherwise)indicator variable (1 = there exist internal auditor in the company, 0 otherwise) indicator variable (1
=
industrial sector, 0 otherwise)indicator variable (1
=
trade sector, 0 otherwise)As in other studies, we define the dependent variable as the natural log of the audit fee. As to the independent variables, we include POWER, the auditor's market share, as our test variable, and a number of independent variables to control for cross-sectional differences in factors that affect audit fees. Consistent with prior research, these control variables contain an auditee-size variable, a complexity variable, risk variables and some other variables that have proven to be significant fee determinants in prior studies. In particular, LNASSET, the natural log of total assets, is the client-size variable, and SUBS, the square root of the number of company operating locations, is our complexity variable. Our risk variables include: QUICK, the quick ratio, LTD, the ratio of long term debt to equity, LOSS, an indicator variable to assess whether the client reported a loss during the last two years or not, and RECINV, the ratio of the sum of receivables and inventory to total assets. Other control variables that we included are: SWITCH to control for a possible low-balling effect on audit fees in case of a frrst audit engagement; lAUD to control for existence of internal audit, and two industry variables MANUF and TRADE to capture possible industry effects on the audit fee. For an overview of the predicted signs on coefficients of all independent variables we refer to Table 5. These signs are consistent with expectations and findings in prior studies.
Research Method
To address RQ 1, whether market power affected audit pricing in the private client segment of the audit market in resp. 1989 and 1997, we ran the regression model in eq. 1 separately for our respective samples of 1989 and 1997 data. For each period we then assessed the sign of the
coefficient on our test variable 'POWER'. We defined POWER as the incumbent auditor's market share, measured by a proxy based on that auditor's personnel cost relative to the whole audit market, that is:
POWER
Incumbent audit firm's personnel cost as reported in its financial statements Sum of personnel cost reported by all audit fInns in the audit market
Audit fInn personnel cost data were collected both for 1989 and 1997. Note that, unlike prior studies, we did not defme market power by the BIG8/6 variable to capture the impact of auditor size on audit fees, but include an assessment of the incumbent auditor's market share as it enables us to assess the impact of an individual auditor's market power on fees instead of the impact of (the market power of) a group of auditors (i.e. Big8/6). However, our sensitivity tests include an audit fee model that contains the BIG8/6 variable instead of the POWER variable, as well a model that contains an alternative market share proxy based on the number of qualifIed professionals per audit firms (see the section on 'sensitivity checks').
To answer RQ 2A and RQ 2B, resp. whether the audit pricing model in 1997 is different from that in 1989 and whether the impact of market power and other fee detenninants on pricing has changed, we adopt the approach developed in Chow (1960). The Chow paper is devoted to a systematic treatment of tests of equality between sets of coefficients in two linear regressions. By adopting the approach in Chow one is able to assess whether 1) a linear relationship, andlor 2) parts of that relationship remain stable over time. Statistically, this implies testing respectively whether 1) two sets of observations can be regarded as belonging to the same regression model (that is, the full set of coefficients is the same) andlor 2) subsets of coefficients in two regressions are equal (that is, only a subset of coefficients is the same).
6. SAMPLE SELECTION AND REsULTS
Sample selection and descriptive statistics
As audit fee data are not publicly available in Belgium, we needed to collect our 1989 and 1997 data by sending questionnaires to audit clients. In 1991 we constructed a data base of audit fee data based on a questionnaire sent to a random sample of 300 privately owned Belgian finDS. The aim was to gain information for the year 1989 on the statutory auditor that had been appointed, the audit fee that had been paid and other non-publicly available information that is necessary to estimate the the audit fee model specifIed in eq. 1 (such as the number of operating locations, the number of subsidiaries, number of years of auditor tenure, and the presence of an internal audit function). In 1999 we collected more fee data for the year 1997 and randomly selected 600 privately held Belgian finns, asking the same (and some additional) questions. We received respectively 81 and 128 responses of the 1989 and 1997 questionnaires. We completed our data set with financial statement infonnation from the Cd-Rom of the Belgian National Bank. Finally, we deleted observations with missing values and extreme outliers from both samples, and retained resp. 59 and 93 useful observation sets for 1989 and 1997.
Since we are comparing data from two different time periods, we needed to make price-level adjustments in order to exclude price-price-level effects from our analysis. Therefore, we express all continuous variables in our 1997 data set in 1989-prices. To that end, we used the production price index as reported by the 'Financieel Economische Tijd', 'the' leading Belgian economic journal.
Table 4 provides descriptive statistics for both samples (n1989
=
59; nl997=
93) and the popUlation (N1997 = 8344)14 from which the samples are drawn. The average audit fee (in 1989 prices) was 636 thousands Belgian Franks (BEF)15 in 1989 and 351 thousands BEF in 1997 (adjusted to 1989 prices). In our 1989 data set, only 33.3% were big 8 clients, whereas 48.5% of 1997 clients were audited by a big 6 auditor. This increase is consistent with the increase in seller concentration in the Belgian audit market reported above. The average sizes of the clientcompanies in both samples are resp. 4.7 billion BEF and 0.77 billion BEF for 1989 and 1997. The 1997 sample thus includes smaller fIrms. As to the fmancial health of the companies in our sample, the differences between the two sample years are not large as the mean values for LOSS, QUICK
and LTD are within the S3-1!le order of rn~gnitude. The percentage of companies wit..lt an L"lternal
audit department is also similar bewteen the two samples. As to RECINV there is a difference between the two samples. Comparison between the sample and population averages for 1997 shows that companies in the sample are smaller, less levered and have less inventories and receivables. The quick ratio in the sample and for the population are within the same order of magnitude.
[Insert Table 4 about here]
Results of the audit fee regression model for 1989 and 1997 (RQ 1)
To answer the question whether there is a significant positive association between auditor market share and audit pricing in the Belgian market for audit services, and whether this is the case both in 1989 and 1997, we discuss the results of the regressions we ran both on our 1989 and 1997 samples. These results are reported in Table 5.
[Insert Table 5 about here]
The audit fee model as specifIed in eq. 1 was highly signifIcant both in 1989 and 1997 (p < 0.0001 for both years); it explained 67 % of variation in audit fees in 1989 but only 39 % in 1997. This decrease in explanatory power of the audit fee model indicates that other determinants may have become relevant and this the pricing model may have changed between 1989 and 199i6• No multicollinearity nor heteroscedasticity problems were identified (a correlation matrix of independent variables for both years is provided in Appendix 1).
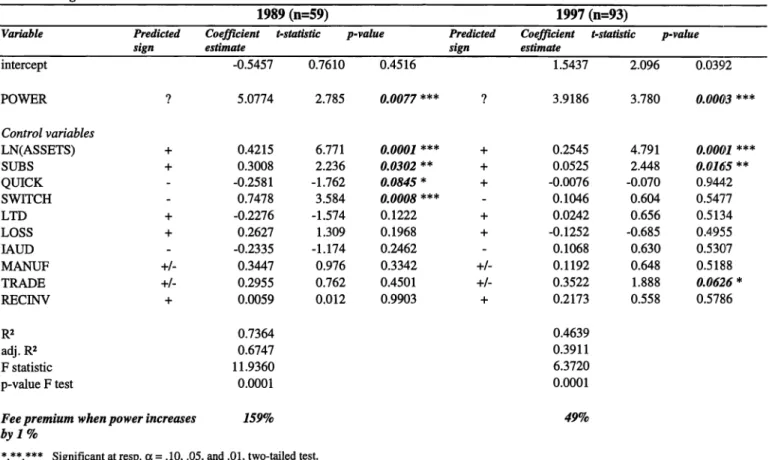
From Table 5 it is also clear that our test variable, POWER, is positive and highly signifIcant both in 1989 and 1997 (p = 0.0077 and p = 0.0001 resp.). This implies that audit firms were able to charge higher audit fees the larger their market share, ceteris paribus. Our test does not
indicate whether this is due to market power or product differentiation. Since we are analyzing the private client segment of the audit market, which is characterized by relatively small concentration ratios, one would expect that competition would pre-empt audit firms from charging price premia, unless for differentiated products. Somehow remarkable, however, is that the impact of POWER on the audit fee decreased between 1989 and 1997, a period in which supplier concentration increased significantly in Belgium. The coefficient on POWER dropped from 5.0774 to 3.9186. This implies that an increase in POWER by 1 % resulted in a audit fee increase of 159% in 1989 but only 49 % in 1997. Apparently the increase in seller concentration did not lead to an increased impact of POWER on fees which indicates that competition between audit firms rather increased than decreased between 1989 and 1997. This result is consistent with prior research fmdings in the public client segment (see, for example, Wootton et al., 1994) that increased market concentration increases rather than decreases competition between audit firms.
As to the control variables in the model, in 1989 LNASSETS and SWITCH were significant at p < 0.01, SUBS at p < 0.05 and QUICK at p < 0.10. All the other variables were not significant. In 1997 only LNASSETS remained significant at p <
om
and SUBS at p < 0.05. Both QUICK and SWITCH lost significance, but TRADE became weakly significant (p < 0.10).Prior studies in the public client segment of the audit market have reported evidence supportive of low balling, with a significant negative coefficient on auditor switching variables. Competition among audit suppliers has been put forward as the explanation for the low-balling phenomenon. An interesting result of this study is that we find a positive sign of the coefficient on SWITCH (both in 1989 and 1997, however only significant in 1989). This result remains robust across alternative fee models that we ran (see further under 'senstivity checks'), and may indicate a lack of competition in the Belgian audit market, especially in 1989. Obviously initial audit engagements require more effort and hence are more costly to perform. With little competition, audit firms are able to price the additional initial engagement costs through to their new clients, which explains the positive coefficient on the SWITCH variable. The fact that the positive coefficient drops from 0.7478 to 0.1046 between 1989 and 1997, and loses its significance, adds
also more evidence to our fmding that competition in the audit market increased by 1997, and that the ability to price initial engagement costs through disappeared.
Changes in the audit fee model between 1989 and 1997: Results of the Chow tests (RQ 2A and
2B)
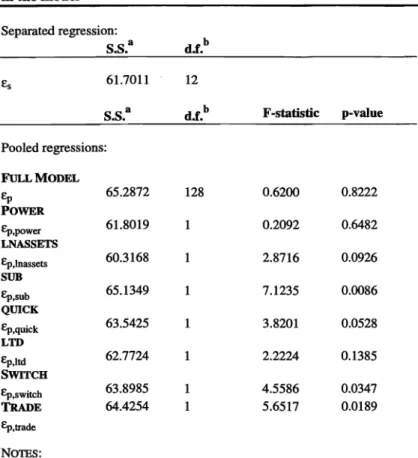
Table 617 presents the results of the Chow tests we ran on the entire linear fee regression model as represented in eq. 1, and on the separate fee parameters. Our main question is whether the audit pricing model has changed between 1989 and 1997, both as a whole and its individual components. The Chow test on the 'full model' does not yield a signifcant F-ratio (p = 0.8222), which means that the null hypothesis that the model did not change cannot be rejected. Note that this null hypothesis was tested against the alternative hypothesis that all parameters together do not stem from the same regression model.
From inspection of Table 5 (see also the above subsection), it is clear that the individual impact of the separate fee determinants did change between 1989 and 1997. We therefore also performed Chow tests on those individual fee parameters that were significant in either 1989 or 1997. Although the coefficient on POWER decreased from 5.0774 to 3.9186 between 1989 and 1997, our Chow test indicates that this change was not significant (p = 0.6482). This is not
unexpected, as we learn from Table 5 that the impact of POWER on audit pricing remains very significant (p
<
0.01) in both years.As to the change of impact of the other audit fee determinants between 1989 and 1997, we found significant results at p < 0.01 for SUB, at p < 0.05 for SWITCH and TRADE and at p < 0.10 for LNASSETS and QUICK. The results are in line with what we already learned from Table 5. The significant changes in the impact of SUB and LNASSETS can be explained by changes in audit technology and productivity between 1989 and 1997. As the coefficients for LNASSETS and SUB dropped from resp. 0.4215 and 0.3008 in 1989 to 0.25 and 0.0525 in 1997, we could conclude that the audit process has become less labor intensive and hence productivity increased. The coefficient on QUICK significantly increased from -0.2581 to -0.0076 and lost its significant impact on fees in 1997. This can be interpreted as an indication that audit firms have become more
risk taking in the sense that risk is no longer priced through. A very interesting result for our study is the significant change in the coefficient on SWITCH, namely from 0.7478 to 0.1046. Given also that the impact was significant in 1989 and no longer significant in 1997, we can conclude that at least pricing on initial audit engagements became more competitive in 1997 than in 1989.
Sensitivity tests
We performed the following sensitivity checks to test the robustness of our results: 1. We re-ran our fee models both for 1989 and 1997 using different proxies for POWER; and 2. accordingly we reperformed all the Chow tests. As to the alternative proxies for POWER we tested two alternatives: an individual auditor market share based on the surrogate of the number of qualified professionals per audit firm, and the traditional big 8/6 variabale. We find robust results both for the 1989 and 1997 pricing models, as significance of the coefficients of the various fee determinants was not affected. Also for corresponding Chow tests we f'md similar (robust) results.
7. CONCLUSIONS
In this paper we analysed supplier concentration and pricing in the private client segment of the Belgian audit market in the period 1989-1997. We assessed that the Belgian audit market is heavily regulated, with a mandatory audit requirement for relatively small private firms and a broad set of regulations that affect audit supply and production. We also documented non-siguificant audit market concentration for Belgium in 1989 and 1997 which looks lower than audit market concentration in most other industrialized countries. We do however report a significant increase in market concentration between 1989 and 1997, and explain this by the mergers that took place between two of the big 8 firms and by the abolition of some regulations that mainly protected small audit suppliers (for example, the big 6 were allowed to use their own brandname).
Given our assessments of market concentration for 1989 and 1997 and the changes that took place in the audit environment during that period, we then investigated audit pricing in the
private client segment of the Belgian audit market. Prior studies mainly focused on the large (public) client segment of the audit market and report evidence supportive of price competition
with differentiated products. In such as study, Simunic (1980), assumed that pricing is competitive in the smaller (public) client segment of the audit market. We tried to assess whether: 1) indeed, pricing is competitive in the smaller-(and private) client segment of the audit market both in 1989 3...nd 1997, and use Belgian data for this assessment and 2) whether the increase in market concentration between 1989 and 1997 resulted in more or less price competition. We found that audit pricing is significantly associated with the incumbent auditor's market share (and thus to some extent his market power). This result is similar to prior results on pricing in the public client segment of the market, and differs from the general expectation (assumption) that no price premium would be associated with auditor size in the small auditee client segment of the market. However, it is not clear whether this finding implies that there is a lack of price competition in the market or whether the price premium is due to product differentiation, as assumed in many studies in the public client segment. Only if auditor size is associated with quality-differentiated audit services, price competition prevails in private client segment of the audit market.
We also report some interesting results as to the change in the pricing model between 1989 and 1997. We fmd that the impact of various individual components of the audit fee model changed between 1989 and 1997. Interesting is that the evidence points in the direction of an increase in price competition. First, we frod that the impact of POWER (the auditor's market share) on pricing decreased between 1989 and 1997, even though this decrease was not significant. Second, we frod a significant change of the impact of the SWITCH variable on pricing consistent with an increase in price competition in the audit market for initial engagements. Unlike prior studies we fmd a positive significant coefficient for the SWITCH variable in 1989, which is a clear indication that the audit market was not very competitive at that time. This can be explained by the monitoring legal role attributed to the Belgian Institute of Auditors that checks whether audit firms charge price that are high enough to guarantee sufficient quality. By 1997, the results show a non-significant and much smaller positive coefficient on SWITCH. Third, non-significant changes in coefficients on LNASSETS and SUB indicate that audit firms have become more productive. An implication could be that increased productivity enables them to become more price competitive or that competition has forced them to become more productive. Overall, our results are consistent
with prior findings in the public client segment of the audit market that increased concentration does not necessarily lead to decreased price competition, but rather to increased price competition (see, for example, Pearson and Trompeter, 1994).
REFERENCES
Anderson, Teresa and Daniel Zeghal. 1994. "The pricing of audit services: Further Evidence from the Canadian Market." Accounting and Business Research, (Summer): 195-207
Beattie, Vivien and Stella Fearnley. 1994. "The Changing Structure of the Market for Audit Services in the UK - a Descriptive Study." British Accounting Review. (December): 301-322 Buijink, Willem F. J., and Steven J. Maijoor. 1993. "Entry, Exit and Market Share Mobility in an
Audit Market: Evidence from the Netherlands." Maastricht Accounting and Auditing Research Centre University of Limburg The Netherlands, Research Memorandum, (March):
10
Campbell, Terry L. and Douglas W. McNiel. 1985. "Stochastic and Nonstochastic Determinants of Changes in Client-Industry Concentrations for Large Public-Accounting Firms." Journal of Accounting and Public Policy, (Winter): 317-328
Chan, Philip, Mahmoud Ezzamel and David Gwilliam. 1993. "Determinants of Audit Fees for Quoted UK Companies." Journal of Business Finance and Accounting, (November): 765-786
Chow, Gregory C .. 1960. ''Tests of Equality Between Sets of Coefficients in Two Linear Regressions." Econometrica, (July): 591-605
Christiansen, Merete and Aune Loft. 1992. "Big Players and Small Players: A Study of Increasing Concentration in the Danish Market for Auditing Services." European Accounting Review, (December): 277-301
Chung, Dennis Y. and W. Daryl Lindsay. 1988. ''The Pricing of Audit Services: The Canadian Perspective." Contemporary Accounting Research, (Fall): 19-46
Corona Romero, E., M. A. Garcia Benau, E. Ruiz Barbadillo and A. Vico Martinez. 1995. "The Audit Market in Spain." Working Paper University of Valencia.
Craswell, Allen T., Jere R. Francis and Stephen L. Taylor, 1995. "Auditor Brand Name Reputations and Industry Specialization." Journal of Accounting and Economics, (December): 297-322
Daniels, Peter W., A. Leyshon and Nigel J. Thrift. 1988. "Large Accountancy Firms in The UK: Operational Adaptation and Spatial Development." Service Industries Journal, (July): 317-346
Danos, Paul and John W. Eichenseher. 1982. "Audit Industry Dynamics: Factors Affecting Changes in Client-Industry Market Shares." Journal of Accounting Research, (Autumn): 604-616
Danos, Paul and John W. Eichenseher. 1986. "Long-Term Trends Toward Seller Concentration in The U.S. Audit Market." The Accounting Review, (October): 633-650
Defond, Mark L., Jere R. Francis, and TJ. Wong. 2000. "Auditor Industry Specialization and Market Segmentation: Evidence From Hong Kong." Auditing: A Journal of Practice & Theory, (Spring): 49-66.
Deis, Donal R. Jr. and Gary A. Giroux. 1996. "The Effect of Auditor Changes On Audit Fees, Audit Hours, and Audit Quality." Journal of Accounting and Public Policy, (Spring): 55-76
Dopuch, Nicholas and Dan A. Simunic. 1980. "The Nature of Competition in The Auditing Profession: A Descriptive and Nonnative View." Regulation and The Accounting Profession. Edited By J.W. Buckley and J.G. Weston. Belmont, CA: Lifetime Learning Publication.
Ettredge, Mike and Robert Greenberg. 1990. "Determinants of Fee Cutting On Initial Audit Engagements." Journal of Accounting Research, (Spring): 198-210
Firth, Michael. 1985. "An Analysis of Audit Fees and Their Determinants." Auditing: A Journal of Practice & Theory, (Spring): 23-37
Francis, Jere R.. 1984. ''The Effect of Audit Firm Size On Audit Prices: A Study of The Australian Market." Journal of Accounting and Economics, (August): 133-151
Francis, Jere R. and Daniel T. Simon. 1987. "A Test of Audit Pricing in The Small-Client Segment of The US Audit Market." The Accounting Review, (January): 145-157
Francis, Jere R. and Donald J. Stokes. 1986. "Audit Prices, Product Differentiation and Scale Economies: Further Evidence From The Australian Market." Journal of Accounting Research, (Autumn): 383-393
Gul, Ferdinant A.. 1999. "Audit Prices, Product Differentiation and Economic Equilibrium." Auditing: A Journal of Practice & Theory, (Spring): 90-100
Lee, Dominica S .. 1996. "Auditor Market Share, Product Differentiation and Audit Fees. Accounting and Business Research", (Autumn): 315-324
Loft, Anne and Anna Sjofors. 1993. "Audit Concentration in Sweden and Denmark: A Comparative Analysis." In Accounting Research in Lund, K. Artsberg, A. Loft, S. Yard, (eds). Lund University Press: 155-175
Marten, Kau-Uwe. 1996. "The Development of the Audit Market in Germany." Paper presented at the 19th Annual Congress of the Europen Accounting Association Bergen, Norway.
Menon, Krishnagopal and David D. Williams. 2ool. "Long-Term Trends In Audit Fees." Auditing: A Journal of Practice & Theory, (March): 115-136
Meuwissen, Roger and Steven J. Maijoor. 1997. "Audit Market in the European Union: Regulation in Belgium, Germany and the Netherlands." Current Issues in Auditing, Michael Sherer and Stuart Turley, (eds). Third edition: 146-162. London: Paul Chapman.
Minyard, Donald H. and Richard H. Tabor. 1991. ''The Effect of Big 8 Mergers On Auditor Concentration." Accounting Horizons, (December): 79-90
Moizer, Peter and Stuart Turley. 1987. "Surrogates for Audit Fees in Concentration Studies." Auditing: A Journal of Practice & Theory, (Fall): 118-123
Palmrose, Zoe-Vonna. 1986. "Audit Fees and Auditor Size: Further Evidence". Journal of Accounting Research, (Spring): 405-411
Palmrose, Zoe-Vonna. 1986. "The Effect of Nonaudit Services on the Pricing of Audit Services: Further Evidence". Journal of Accounting Research, (Autumn): 405-411
Parker, S. C .. 1991. "Significantly Concentrated Markets Theory and Evidence for the U.K."
International Journal of Industrial Organization, (December): 585-590
Pearson, Tim and Grey Trompeter. 1994. "Competition in The Market for Audit Services: The Effect of Supplier Concentration On Audit Fees." Contemporary Accounting Research,
(Summer): 115-135
Pong, Christopher KM .. 1999. "Auditor Concentration: A Replication and Extension for The {JK Audit Market 1991-1995." Journal of Business Finance and Accounting, (ApriIJMay): 451-475
Pong, Christopher KM. and Geoffrey Whittington. 1994. "The Determinants of Audit Fees; Some Empirical Models." Journal of Business Finance and Accounting, (December): 1071-1095 Rhode, John G., Gary M. Whitsell and Richard L. Kelsey. 1974. "An Analysis of Client-Industry
Concentrations for Large Public Accounting Firms." The Accounting Review, (October): 772-787
Schiff, A. and H. D. Fried. 1976. "Large Companies and The Big Eight: An Overview." Abacus,
(December): 116-124
Simunic, Dan A.. 1980. "The Pricing of Audit Service: Theory and Evidence." Journal of Accounting Research, (Spring): 161-190
Tafller, R. J. and K S. Rarnalinggam. 1982. ''The Determinants of Audit Fees in The UK: An Exploratory Studies." Working Paper, City University Business School: London, England. Tonge, Stanley D. and Charles W. Wootton. 1991. "Auditor Concentration and Competition
Among The Large Public Accounting Firms: Post-Merger Status and Future Implication."
Journal of Accounting and Public Policy, (Summer): 157-172
Weets, Veronique and Marc Jegers. 1997. "Are The 'Big Six' 'Big' in Belgium?" The European Accounting Review, (Vol.6/4): 773-789
Weiss Leonard W. 1989. Concentration and Price. Cambridge, MA USA: The MIT Press.
Wootton, Charles W., Stanley D. Tonge and Carel M. Wolk. 1994. "Pre and Post Big Eight Mergers: Comparison of Auditor Concentration." Accounting Horizons, (September): 58-74 Zeff, Stephen A. and R. L. Fossum, 1967. "An Analysis of Large Audit Clients." The Accounting
1989 1990 1991 1992 1993 1994 1995 1997
• Personnel cost per audit fmn 47% 63%
b No. of qualified professionals per audit firm 22% 27%
b No. of qualified professionals per audit fmn (WI 1997) 21% 22% 31% 28% 28% 26% 26% D.a.
C Client sales (WI 1997) 41% 43% 52% 53% 56% 56% n.a. n.a.
C Square root of client sales (WI 1997) 19% 19% 23% 21% 23% 24% n.a. n.a.
C Total assets (WI 1997) 45% 48% 57% 58% 60% 61% n.a. D.a.
C Number of clients (WI 1997) 33% 34% 39% 40% 42% 42% n.a. D.a.
1989 1990 1991 1992 1993 1994
• Personnel cost per audit firm 60% 77%
b No. of qualified professionals per audit firm 27% 32%
b No. of qualified professionals per audit firm (WI 1997) 25% 27% 35% 33% 33% 31% 31% n.a.
C Client sales (WI 1997) 53% 54% 64% 66% 69% 70% n.a. n.a.
C Square root of client sales (WI 1997) 25% 26% 30% 29% 31% 31% D.a. n.a.
C Total assets (WI 1997) 56% 61% 69% 71% 74% 74% D.a. D.a.
C Number of clients (WI 1997) 43% 45% 53% 54% 56% 56% D.a. D.a .
.
-1989 1990 1991 1992 1993 1994 1995 1997
• Personnel cost per audit firm 68% 80%
b No. of qualified professionals per audit firm 30% 36%
b No. of qualified professionals per audit firm (WI 1997) 29% 31% 38% 36% 36% 35% 34% n.a ..
C Client sales (WI 1997) 59% 62% 69% 70% 73% 75% D.a. n.a.
C Square root of client sales (WI 1997) 30% 31% 34% 33% 35% 36% n.a. n.a.
C Total assets (WI 1997) 65% 71% 76% 77% 80% 81% n.a. n.a.
C Number of clients (WI 1997) 51% 53% 58% 60% 62% 62% n.a. n.a.
1989 1990 1991 1992 1993 1994 1995 1997
a Personnel cost per audit fIrm 0.0768 0.1184
b No. of qualifIed professionals per audit fum 0.0175 0.0228
b No. of qualifIed professionals per audit fum (WI 1997) 0.0170 0.0190 0.3000 0.0250 0.0250 0.0230 0.0210 n.a.
C Client sales (WI 1997) 0.0590 0.0620 0.0840 0.0860 0.0920 0.0940 n.a. n.a.
C Square root of client sales (WI 1997) 0.0180 0.0190 0.0220 0.0210 0.0220 0.0230 n.a. n.a.
C Total assets (WI 1997) 0.0710 0.0800 0.1080 0.1140 0.1160 0.1180 n.a. n.a.
C Number of clients (WI 1997) 0.0410 0.0430 0.0540 0.0560 0.0590 0.0600 n.a. n.a. Notes
a The concentration ratios based on personnel cost are based on all financial statements submitted by audit firms to the Belgian National Bank.
b The concentration ratios based on the number of qualified professionals are based on the membership lists of the Belgian Institute of auditors (lBRlIRE). Per audit finn we traced the number of members that are associated with it. Note that the total population is included.
C The concentration ratios in Weets and Jegers C'NJ 1997) were calculated using the financial statements of the 1300 largest Belgian companies that were publicly available over the
period 1989 -1994.
TABLE 2: Evidence on concentration ratios in Euro~ean countries
BASIS: CR4 CR6 CR8 HIll
No. of qualified professionals per audit firm
Net..1terlands 1990, entire population - Buiji.nk a..lld 59% n.a. n.a. 0.09 Maijoor, 1993
Belgium 1990, entire population - Weets and Jegers 22% 27% 31% 0.019 1997
Client sales
U.S. 1988, NYSE - Tonge and Wootton 1991 72% 99% n.a. n.a. Denmark 1990, Copenhagen Stock Exchange- 71% n.a. 80% n.a. Christiansen and Loft, 1992
Germany 1990, 200 public clients - Marten 1996 60% 72% n.a. 0.18 Germany 1993,200 public clients - Marten 1996 77% 90% n.a. 0.20 Belgium 1990, 1300 largest clients - Woots and Jegers 43% 54% 62% 0.0620 1997
Belgium 1993, 1300 largest clients - Woots and Jegers 56% 69% 73% 0.0920 1997
Square root of client sales
U.S. 1991, NYSE AMEX OTC - Wootton et al. 1994 69% 97% n.a. n.a. Germany 1990, 200 public clients - Marten 1996 65% 75% n.a. 0.18 Germany 1993,200 public clients - Marten 1996 69% 80% n.a. 0.18 Denmark 1990, Copenhagen Stock Exchange - Loft 26% n.a. 36% n.a. and SjOfors, 1993
Sweden 1990, Stockholm Stock Exchange - Loft and 20% n.a. 29% n.a. Sjiifors, 1993
Belgium 1990, 1300 largest clients - Woots and Jegers 19% 26% 31% 0.0190 1997
Belgium 1993, 1300 largest clients - Woots and Jegers 23% 31% 35% 0.0220 1997
Number of clients
U.S. 1988 - NYSE AMEX OTC - Wootton et al. 1994 52% 83% n.a. n.a. U.S 1991 - NYSE AMEX OTC - Wootton et al. 1994 65% 89% n.a. n.a. Spain 1988, 250 large non-financial clients - Corona 84% 92% 95% n.a. Romero et al. 1995
Spain 1993, 250 large non-financial clients - Corona 73% 85% n.a. 0.19 Romero et aI. 1995
UK + Ireland 1989, Public and USM clients - Beattie 45% n.a. 68% n.a. and Fearnley 1994
UK + Ireland 1991, Public and USM clients - Beattie 59% n.a. 79% n.a. and Fearnley 1994
Belgium 1989, 1300 largest clients - Woots and Jegers 33% 43% 51% 0.0410 1997
Belgium 1991, 1300 largest clients - Woots and Jegers 39% 53% 58% 0.0540 1997
Belgium 1993, 1300 largest clients - Woots and Jegers 42% 56% 62% 0.0590 1997
Table 3: Significance tests of concentration ratios (after Parker, 1991#)
Personnel Cost Number of qualified Professionals
1989 1997 1989 1997
Actual Critical Actual Critical Actual Critical Actual Critical value value* value value* value value* value value* CR4 47.22% 55.15% 62.69% 67.12% 21.65% 42.50% 26.93% 48.44% CR6 59.75% 67.83% 77.36% 80.09% 26.66% 58.40% 32.25% 62.31% CR8 67.99% 77.20% 80.42% 88.65% 30.31% 68.04% 35.70% 71.69%
H CRn is characterized by the following cumulative distribution function (the variable names are adapted to those used in this paper):
Pr [CR, :s; CR
:]=
L
(_1)"-' ~(jCR : - n)"-'Q, j' J Where: N n CR ,=
the total number of fIrms in the market excluding negligible fIrms (in this paper are those with market share less than 0.5%)= number of the n largest audit fIrms in the market
= critical concentration ratio of the n largest fIrms at level of signifIcance 0;. Below this level
concentration is not signifIcant.
I - a =Pr[CR, :S;CR:]
j = index of the summation over the range of nlCR
*
< j :::; N for integer values of j1 N!
Q, -nN-'-'(j - n),-' . (N - j)!(j - n)!n!
*
The critical values are calculated at 0; = 5%TABLE 4
Descriptive statistics on the test and control variables for the regression analysis
Panel A ]989 n/989
=
59Categorical variables (proportion of dummy=])
SWITCH 0.2203 LOSS 0.2203 lAUD 0.3390 MANUF 0.7458 TRADE 0.2034 BIG8 0.3729 Continuous variables
Mean st.dev. min median Max
POWER 0.0430 0.0478 0.0003 0.0175 0.1725 FEE (1000) 635 870 41 400 6,096 In(FEE) 5.9351 1.0152 3.7197 5.9915 8.7154 ASSETS (1000) 4,685,427 17,556,147 100,315 680,605 128,250,604 In(ASSETS) 13.5750 1.5105 11.5161 13.4307 18.6695 sqr(SUBS) 1.4214 0.6669 1.0000 1.0000 3.4641 QUICK 1.0717 0.5673 0.3800 0.9200 3.1000 LTD 0.3253 0.5871 -2.6349 0.2173 2.0729 RECINV 0.5755 0.1933 0.1484 0.5517 0.9537 PanelB ]991' n/997 = 93
Categorical variables (proportion of dummy=])
SWITCH 0.3333 LOSS 0.2581 lAUD 0.3226 MANUF 0.3441 TRADE 0.3333 BIG 6 0.5269 Continuous variables
Mean st.dev. min median Max Population
Mean POWER 0.0815 0.0807 0.0000 0.0720 0.2043 FEE (1000) 351 349 18 208 1,668 N1997 = 8344 In(FEE) 5.4428 0.9301 2.9096 5.3401 7.4195 ASSETS (1000) 766,607 1,863,932 2,413 260,369 15,560,740 1,666,775 In(ASSETS) 12.3288 1.5930 7.7888 12.4699 16.5603 12.7457 Sqr(SUBS) 3.1634 3.9278 1.0000 1.4142 14.1421 QUICK 1.1744 0.8206 0.0200 1.0100 4.6600 1.2641 LTD 0.3760 2.1607 -10.6733 0.0289 14.8431 1.0025 RECINV 0.3675 0.2150 0.0000 0.3573 0.8411 0.6212
Table 5: Regression of audit fee on test and control variables in 1989 and 1997
1989 (0=59) 1997 (0=93)
Variable Predicted Coefficient t-stlltistic p-llalue Predicted Coefficient t-stlltistic p-llalue
sign estimate sign estimate
intercept -0.5457 0.7610 0.4516 1.5437 2.096 0.0392 POWER ? 5.0774 2.785 0.0077
***
? 3.9186 3.780 0.0003***
Control variables LN(ASSETS) + 0.4215 6.771 0.0001***
+ 0.2545 4.791 0.0001***
SUBS + 0.3008 2.236 0.0302**
+ 0.0525 2.448 0.01fJ~5**
QUICK -0.2581 -1.762 0.0845 * + -0.0076 -0.070 0.9442 SWITCH 0.7478 3.584 0.0008***
0.1046 0.604 0.5477 LTD + -0.2276 -1.574 0.1222 + 0.0242 0.656 0.5134 LOSS + 0.2627 1.309 0.1968 + -0.1252 -0.685 0.4955 lAUD -0.2335 -1.174 0.2462 0.1068 0.630 0.5307 MANUF +/- 0.3447 0.976 0.3342 +/- 0.1192 0.648 0.5188 TRADE +/- 0.2955 0.762 0.4501 +/- 0.3522 1.888 0.0626* RECINV + 0.0059 0.012 0.9903 + 0.2173 0.558 0.5786 R2 0.7364 0.4639 adj. R2 0.6747 0.3911 F statistic 11.9360 6.3720 p-value F test 0.0001 0.0001Fee premium when power increases
159%
49%
by1%