Visualization and Analytical Support of
Questionnaire Free-Texts Data based on HK Graph
with Concepts of Words
Daisuke Kobayashi, Tomohiro Yoshikawa and Takashi Furuhashi
Nagoya University, JapanFuro-cho, Chikusa-ku, Nagoya 464-8601 JAPAN Email: [email protected]
[email protected] [email protected]
Abstract—A lot of companies carry out questionnaires. These questionnaires often have questions which need respondents to answer by free description. It is, however, inefficient for an analyzer to read whole texts to get outlines or classify them, or it is difficult to correctly analyze them without subjective biases. The authors have proposed “HK Graph” (Hierarchical Keyword Graph) which is a support tool for text mining. HK Graph can visualize the relationships among attributes and words with hierarchical graph structure based on frequency of co-occurrence. However, the result of HK Graph is not enough helpful for the analyzer to grasp the outlines of the texts and extract opinions from them, because it regards divided words as different ones unless they perfectly match and that makes the visualized result complicated. This paper presents a new visualization method for the HK Graph incorporating an aggregating words method based on concepts of words. An experiment is carried out by applying the proposed method to actual questionnaire data on disasters and studies the effectiveness of the proposed method.
I. INTRODUCTION
Recently, a lot of companies often carry out questionnaires to plan marketing strategies. There are a lot of objectives in questionnaires, e.g., finding needs of products or services, predicting demand or market scale, investigating levels of customer satisfaction or images of brands, and so on. Thus, questionnaires are important information sources for compa-nies, and effective analysis methods for them are strongly needed.
There are two types of formats in questionnaire. One is to answer from some choices or directly answer using a numerical value for a question, the other is to answer by free description. In the former case, it is easy to quantify the responses, and to apply multivariate analysis methods. It is, however, difficult to extract real opinions or impressions of respondents unless good setting of questions is done, because the respondents can respond only to the prepared questions. On the other hand, in the latter case, it is expected to extract real opinions of respondents because they can write their responses freely. However the analysis of free text data becomes difficult because numerical analysis methods can not be applied and it takes long time to aggregate and analyze them, or an analyst might be subjectively biased by same strong opinions. In many
analyses of questionnaires, the analysts have to read whole text data to get outlines or manually classify them. Therefore, the demand for the support system by text mining methods for the analysis of free texts in questionnaire has been growing.
A lot of text mining methods to support the analysis of texts have been reported [1], [2], [3]. This study focuses on the approach by visualization. Analysis of free texts in questionnaires needs interactivity because a lot of grammar or syntax errors are contained in responses, and the visualization is expected to be effective for interactive analyses. There are some conventional systems to support the analysis of texts with visualization such as Key Graph [4], ACCENT [5],𝐾𝑂𝑇 𝑂𝐵𝐴 network [6], and so on. Key Graph can show the relationships among words in texts based on their frequencies of co-occurrence; however, Key Graph is not designed for interactive word search. The displayed result is fixed. ACCENT and 𝐾𝑂𝑇 𝑂𝐵𝐴 network shows relationships of words in a form of graph structure. However, the interactivity of these methods is low because the graph has to be restructured every time a user needs to analyze further into the details.
The authors have developed Hierarchical Keyword Graph (HK Graph) [7], [8] as the support system for the analysis of texts with visualization of relationships among words. HK Graph can extract relevant words based on their co-occurrence for the words input by a user or for the groups, e.g., men and women, and visualize them as a graph structure. In addition, HK Graph can show the words as a hierarchical structure, and then a user can analyze the focused word in depth by seeing the lower layer of the word.
In HK Graph, divided words are regarded as different words except for the perfect matching ones. Therefore, synonyms such as different representation and different expression are regarded as different words even if they were used as the same meaning. Then these words are shown separately or often not presented because the frequency of appearance becomes low. In free texts of questionnaires, the representation and the expression of words (Hiragana/Kanji etc.) are often different in individuals. Consequently, aggregating these synonyms has been an important issue. In addition, it is difficult to grasp
the outlines of the texts and extract the opinions in them when many words are presented on HK Graph, because the visualization result becomes complicated.
The aim of this paper is to consider the similarities of words in HK Graph and make it easy to grasp the outlines of texts. This paper proposes “concept” of words defined by the thesaurus, and the words are grouped based on their concepts, and then the concept and the grouped words are visualized in HK Graph. The proposed method can aggregate the words which were separately shown in the conventional HK Graph, and it is expected that the visualization of aggregated words makes it easier to grasp the outlines of the texts and extract proper features of them. This paper applies the proposed method to actual questionnaire data on disasters and studies the effectiveness of the proposed method.
II. HK GRAPH
In HK Graph, users can interactively analyze text data by starting to analyze the text related to the items they are interested in, and proceeding into deeper layers of words of interest shown as a keyword graph. The algorithm of HK Graph is as follows.
A. Division into Words
The first step in the algorithm of HK Graph is to divide the target texts into words by applying Cabocha[5]. Cabocha is a Japanese language morphological and paragraphic analysis tool. Unlike English, in which each word is separated by a space, it is difficult to divide Japanese text without tools like Cabocha. Applying Cabocha to the target texts, particles, symbols (punctuation, parentheses), pronouns, conjunctions and adnouns given by morphological information are regarded as noise words which are not needed for analysis, and they are deleted.
B. Selection of Base
The second step is for users to select contents to be analyzed, e.g., sex, income, age, the texts containing a certain word or sentence, the target group, and so on. If they want to grasp the outlines or the tendency of texts, they can select all texts. The selected group is called “Base.” It is one of the features of HK Graph to let users give the start nodes of their interest which create the graph structure.
C. Extraction of Main-node
High co-occurrence words in the texts with the selected Base are extracted. The extracted words are called “Main-nodes.” 𝐽𝑎𝑐𝑐𝑎𝑟𝑑′𝑠 coefficient is used as the co-occurrence value. The equation of co-occurrence is shown below.
𝐽𝑎𝑐𝑐𝑎𝑟𝑑(𝐵𝑖, 𝑊𝑗) = 𝑁𝑁(𝑆(𝐵(𝑆(𝐵𝑖)∩𝑆(𝑊𝑗))
𝑖)∪𝑆(𝑊𝑗)) (1)
𝐵𝑖is the Base𝑖,𝑊𝑗is each word divided out in II.A.,𝑆(𝑋)is the texts including the Base/word𝑋, and𝑁(𝑆)is the number of texts of𝑆. Using eq.(1), the words with high co-occurrence to all Bases (All connected Main-node), those to plural Bases (Multi connected Main-node), and those to single Base (Single connected Main-node) are extracted.
D. Extraction of Sub-node
When a user wants to know more about a certain Main-node, HK Graph can extract the words which are closely related to the selected Main-node as a lower layer. The words, called “Sub-nodes,” are extracted using eq.(1) where the Base is replaced with the selected Main-node. Thus in HK Graph, the words which have high co-occurrence with the focused words can be expanded as the lower layer, then a user can analyze the texts by proceeding into deeper layers of words of his/her interest.
E. Presentation of Hierarchical Keyword Graph
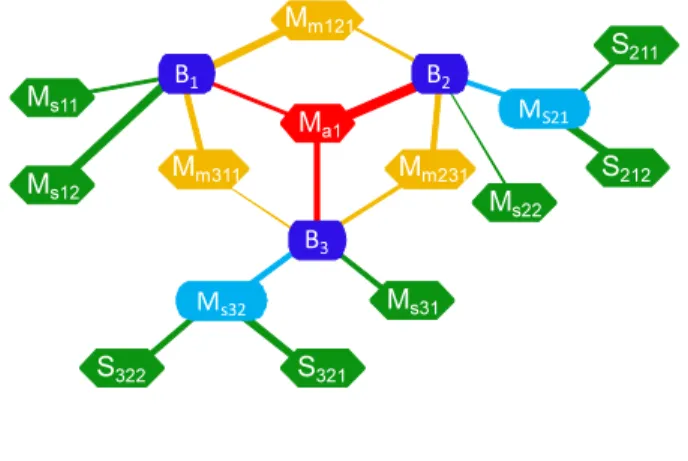
The image of output of HK Graph is shown in Fig.1. In this figure, B1-B3 are Bases, M𝑎1 is All connected Main-node, M𝑚121-M𝑚231 are Multi connected Main-nodes, M𝑠11-M𝑠32 are Single connected Main-nodes, and S211, S222, etc. are Sub-nodes. A Base and Main-nodes, a Main-node and Sub-nodes are connected with their links, and the value of co-occurrence is expressed in the thickness of each link.
In this way, the relationships of the words are hierarchically presented in HK Graph. In addition, HK Graph can show the new graph starting from the presented words, either Main-nodes or Sub-Main-nodes, as new Bases.
MS21 S322 S321 B2 Mm231 Mm311 Mm121 B3 B1 Ma1 Ms32 Ms31 Ms11 Ms12 M s22 S211 S212
Fig. 1. Image of HK Graph
III. PROPOSEDMETHOD
The objective of this study is to support the analysis of free texts in questionnaires using HK Graph. However, in HK Graph, synonyms are regarded as different words, and the visualized result becomes complicated when a lot of nodes are presented as described in I. This paper considers the similarities of words in HK Graph based on their “concept” of words which are defined by the thesaurus, and proposes a method to feed back them into the visualization result with HK Graph by grouping the words based on their concepts. Moreover, the concepts are expanded using N-gram in this paper. The details of the proposed method are as follows.
A. Definition of Concept
This paper uses “Nihongo Dai-Thesaurus [9]” to define “concept.” This thesaurus consists of 6 chapters. Each chapter
consists of 67 sections, and each section has 1044 categories. Each category has 1-30 groups of belonging words. The small word group is the minimum unit of synonyms to be grouped. Consequently in this paper, the small word groups are defined as “concepts.” Based on these concepts, the words in texts are grouped, which are called “concept groups.” Each concept group is described with the label of the small word group in the thesaurus.
B. Generation of Concept Group
After the division of texts into words, it gives the label(s) of concept to each word. Concretely, each word is searched in belonging words to small word groups in the thesaurus, and the label of corresponding concept are given to the word when the word is found. Plural concepts can be given to one word because a word often has some meanings and appears in some small word groups in the thesaurus. Concept groups, in which same belonging words are, are generated based on the concept labels of words. Each concept group is shown with the corresponding label in the thesaurus.
C. Expansion of Concept Group using N-gram
Only the words in the thesaurus belong to concept groups generated in III.B. However, there are a lot of synonyms which the thesaurus does not have but shown in the texts, e.g., ‘earth-quake’ and ‘earthquake disaster,’ these are originally written in Japanese, belong to the concept “earthquake,” but unique nouns such as ‘the Great Hanshin Earthquake’ or ‘a Tokai earthquake’ do not belong to it. This paper expands the concept groups using N-grams [10], [11] which have been often used in the area of full-text searching. An N-gram is consist of a subsequence of 𝑛 characters divided from a given sequence. In this paper, a given sequence is a word in texts (in Japanese) and a subsequence is the characters which are divided from the word. For example, in the case of 𝑁=2, from a word ‘ABCDE’ (each character A, B, C, D, E is a Kanji, Hiragana or Katakana), the N-grams ‘AB,’‘BC,’‘CD,’‘DE,’ are generated. N-grams are generated for all words presented in HK Graph, and the words which have the N-grams corresponding to those by the words in the original concept groups are put into the concept group. This expansion of concept groups can aggregate the synonyms of them which the thesaurus does not have.
D. Application to HK Graph
Words and concept groups generated in III.C. are presented in HK Graph. Concretely, as described in II.C., the high co-occurrence words in the texts with the selected Bases are extracted as Main-nodes. When 2 or more words in the extracted words belong to a same concept group, these words are aggregated into the concept group, and the label of the concept group is presented as a node in HK Graph, this paper calls these nodes “concept nodes.” Links to a concept node or to Sub-nodes from a concept node are connected based on the co-occurrence values of the words belonging to the concept group. Eq.(2) shows𝐽𝑎𝑐𝑐𝑎𝑟𝑑′𝑠coefficient to calculate the co-occurrence value. The difference from eq.(1) is 𝐺𝑖, which is
the words belonging to the concept group.
𝐽𝑎𝑐𝑐𝑎𝑟𝑑(𝐺𝑖, 𝑊𝑗) = 𝑁𝑁(𝑆(𝐺(𝑆(𝐺𝑖)∩𝑆(𝑊𝑗))
𝑖)∪𝑆(𝑊𝑗)) (2)
IV. EXPERIMENT
A. Questionnaire Data and Division into Words
In this experiment, the proposed method was applied to 500 free texts of a questionnaire on disasters. The question of the questionnaire was “Please write your opinions or thoughts on natural disasters over 50 characters (in Japanese).” Actually, including “I don’t have comments in particular” and so on, 125 respondents out of 500 wrote the responses less than 50 characters. Firstly, the text data were divided into words as described in II.A., and the words and concepts not to be needed for the analysis (‘thing,’ ‘is,’ ‘there,’ ‘that,’ and a concept “point” coming from a word ‘thing’) were excluded by hand. The number of N-gram 𝑁 was 2. The following figures and descriptions of the results are originally written in Japanese and translated into English.
B. Study of Grasping Outline of Text
First, the easiness to grasp the outlines of texts was studied comparing with the conventional HK Graph. The conventional HK Graph was applied to the above questionnaire data, and the visualization result is shown in Fig.2 when the extracted word class was noun and the number of the presented Main-nodes was set to 100. The number of Main Main-nodes employed here was set based on the visibility of the results. Appropriate number should be studied in the future work. Fig.3 shows the result of the proposed method with concept groups described in III.D. based on 100 words in Fig.2. Orange nodes in Fig.3 are the concept nodes.
It is slightly difficult to grasp the general outlines of the texts from Fig.2, because the number of presented words are many and the synonyms are not categorized and dispersed. On the other hand in Fig.3, main words in the texts are categorized and aggregated by the concepts, which makes it easier to grasp the outlines than Fig.2 by focusing on the concept nodes. According to the result of Fig.3, for “opinions on natural disasters,” there were “Earthquake,” “Flood,” “Heavy rain,” and they also mentioned “Environmental problem,” “Broadcast” and “Prediction.”
C. Study on Aggregation of Synonyms
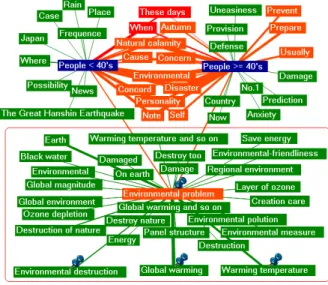
Next, the effect of the aggregation of synonyms based on the concepts was studied. Fig.4 shows the result of the conventional HK Graph when Bases were selected as the respondents less than 40’s and those more than or equal to 40’s, and Fig.5 shows the result of the proposed HK Graph generated based on Fig.4. In Fig.4, ‘Environmental destruction’ and ‘Warming temperature’ are connected to the Base of the respondents less than 40’s, and ‘Global warming’ is connected to those more than or equal to 40’s. These words could be used to describe “Environmental problem.” However, these words were dealt with different words in the conventional method, then we might grasp that respondents less than 40’s mentioned
Fig. 2. Conventional HK Graph
Fig. 3. Proposed method
‘Environmental destruction’ and ‘Warming temperature,’ and those of more than or equal to 40’ did ‘Global warming.’ On the other hand, in the proposed method, ‘Environmental de-struction,’ ‘Warming temperature’ and ‘Global warming’ were aggregated into the concept “Environmental problem,” and this concept node was presented as All connected Main-node from both Bases. Therefore, it is found that the respondents for the wide generations had interest in environmental problem. In addition, in the proposed method, as the synonyms such as ‘environmental pollution,’ ‘ozone depletion,’ and so on, which were not presented in the conventional method because the number of the words in the texts were small, were belonging and presented as the same concept group, we can analyze more detail of the opinions on the environmental problem.
Finally, the effect of the expansion of concept groups using
Fig. 4. Conventional HK Graph (Bases : People<40’s, People≥40’s)
Fig. 5. Proposed method (Bases : People<40’s, People≥40’s)
N-gram was studied. Fig.6(a) shows the belonging words to the concept “Earthquake” before the expansion, and Fig.6(b) shows after the expansion using N-gram as described in III.C. Extracted words in Fig.6(a) are only general words, e.g., ‘Earthquake,’ ‘Earthquake disaster,’ and so on. On the other hand, in Fig.6(b), the concept group have a lot of synonyms including the unique nouns, ‘The Great Hanshin Earthquake,’ ‘The Chuetsu earthquake,’ ‘Early news about the earthquake,’ and so on, by the expansion using N-gram. It gives us detail analysis on the opinions about earthquake.
V. CONCLUSION
This paper considered the similarities of words in HK Graph based on their “concept” of words which were defined by the thesaurus, and proposed a method to feed back them into the visualization result with HK Graph by grouping the words based on their concepts. This paper also proposed
(a) Before expansion (b) After expansion Fig. 6. Effect of expansion of concept group
the expansion of concept groups using N-gram. This paper applied the proposed method to actual questionnaire data on disasters and studied the easiness to grasp the outline of texts comparing with the conventional HK Graph. It also studied the effectiveness of the aggregation of synonyms by the concept groups and the expansion of them. Future work is more study on the expansion of concept groups and the extraction of the proper concept for the word belonging to some concepts considering the meaning in the texts.
ACKNOWLEDGMENT
This work was supported by the Grant-in-Aid for Scien-tific Research (C) from the Ministry of Education, Culture, Sports, Science and Technology (MEXT), Japan, Grant num-ber: 22500088.
REFERENCES
[1] B. Larsen and C. Aone, “Fast and effective text mining using linear-time document clustering,” in Proceedings of the fifth ACM SIGKDD international conference on Knowledge discovery and data mining. ACM, 1999, pp. 16–22.
[2] R. Feldman, M. Fresko, Y. Kinar, Y. Lindell, O. Liphstat, M. Rajman, Y. Schler, and O. Zamir, “Text mining at the term level,”Principles of Data Mining and Knowledge Discovery, pp. 65–73, 1998.
[3] Y. Ichimura, T. Hasegawa, I. Watanabe, and M. Sato, “Text mining : Case studies(special issue :,”Journal of Japanese Society for Artificial Intelligence, vol. 16, no. 2, pp. 192–200, 2001-03-01. [Online]. Available: http://ci.nii.ac.jp/naid/110002808468/en/
[4] Y. Ohsawa, N. Benson, and M. Yachida, “KeyGraph: Automatic indexing by co-occurrence graph based on building construction metaphor,” in
Proceedings of the Advances in Digital Libraries Conference. IEEE Computer Society, 1998, p. 12.
[5] K. Misue and I. Watanabe, “Visualization of keyword association for text mining,”IPSJ SIG Notes, vol. 99, no. 57, pp. 65–72, 1999. [6] M. Masaki, O. Shinobu, T. Yashuhiro, S. Masanari, I. Makoto, and
F. Miki,Jireidemanabu text mining (in Japanese). Kyoritsu Shuppan, Tokyo, 2008.
[7] T. Okabe, T. Yoshikawa, and T. Furuhashi, “A proposal of analysis system for medical incident reports using metadata and co-occurrence information,”Journal of Japan Society for Fuzzy Theory and Intelligent Informatics, vol. 18, no. 5, pp. 689–700, 2006.
[8] T. Yoshikawa, Y. Uchida, T. Furuhashi, E. Hirao, and H. Iguchi, “Extraction of evaluation keywords for analyzing product evaluation in user-reviews using hierarchical keyword graph,” Journal of Advanced Computational Intelligence and Intelligent Informatics, vol. 13, no. 4, pp. 457–462, 2009.
[9] T. Yamaguchi,Nihongo Dai-Thesaurus CD-ROM. Taishukan Shoten, Tokyo, 2006.
[10] M. Nagao and S. Mori, “A new method of N-gram statistics for large number of n and automatic extraction of words and phrases from large text data of Japanese,” inProceedings of the 15th conference on Computational linguistics-Volume 1. Association for Computational Linguistics, 1994, pp. 611–615.
[11] Y. Kokubu, “Full-text searching for managing a large number of doc-uments,”Journal of Information Processing and Management, vol. 42, pp. 380–389, 1999.