Comparing environmental impact of
conventional and high speed rail
Planning and Regulation
Route Planning
New Lines
Executive Summary
Introduction
The New Lines Programme is to test the hypothesis that in 2020, the existing rail lines from London to the North and West will be operating at full capacity and the conventional and the next generation tools for increasing capacity will be exhausted. There will be the need for additional intervention. The programme aims to develop and evaluate the options for building new lines; including in this is the need to evaluate the environmental impacts of such an intervention in terms of expected energy consumption of new rolling stock, understand any step change in energy consumption between new versus existing rolling stock including diesel versus electric and to assess localised environmental impact during and after construction.
As a result there is a need to better understand the environmental impact of building one or more new lines in terms of:
1) Performance (energy consumption) of rolling stock, both current high-speed (electric), conventional (diesel) rolling stock and future electric rolling stock;
2) Seating occupancy levels in high-speed versus conventional services;
3) Estimated direct and indirect greenhouse gas emissions from diesel and electric rolling stock (both in current and likely future electric mix);
4) Estimated emissions resulting from the construction, maintenance and decommissioning of rolling stock;
5) The potential energy consumption/emissions resulting from construction of new infrastructure in terms of materials used in the construction of infrastructure (and the energy consumption /emissions per kg of these materials) as well as the energy use/emissions resulting from infrastructure construction activities;
6) The role of energy consumption/emissions savings resulting from modal shift and factoring in demand generation in the overall comparison.
This environmental study was carried out to assess the relative environmental performance of
conventional and high speed electric rail services. The purpose of this work is to provide an objective comparison between the different options and the key assumptions that affect the outcome of the comparison. In doing this, the work also needs to take into account the long timeframes associated with planning and constructing large railway infrastructure projects including wholly new rail lines (e.g. around 20 years for both the Channel Tunnel Rail Link and Crossrail). Hence comparisons will need to be made on the anticipated performance of future high-speed and conventional rail rolling stock likely to be put into service in the 2025-2030 timeframe.
For the purposes of this study, high-speed rail (HSR) services are defined as services faster than typical UK intercity limit of 200 km/hour, typically over 250 km/hour and up to 350+ km/hour.
Comparisons in this report are made for similar types of electric rail services for HSR vs conventional rail – i.e. with conventional intercity service rolling stock (up to 200 km/hour), rather than rolling stock used in slower stop-start commuter services. The focus for the work for this project has been on energy consumption and greenhouse gas emissions. Other environmental impacts will be considered in more detail at a later phase and are not within the scope of this project.
In order to obtain as up to date and accurate information as possible the project team consulted widely with experts in industry and academia, as well as with the Department for Transport (DfT). This was carried out via a letter of introduction and accompanying questionnaire and follow-up by email and telephone interviews.
Summary of Analysis Results and Conclusions
The results of the comparative analysis of conventional versus high-speed rail have been presented split between three source areas:
1. GHG emissions resulting from to direct energy consumption by the trains;
2. GHG emissions resulting from the construction, maintenance, use and disposal of new electric rail infrastructure;
3. GHG emissions resulting from the production, disposal and maintenance of electric trains. These results have demonstrated the following points:
• Per seat-km conventional rail uses less energy and produces fewer GHG emissions than high-speed rail. High-high-speed rail would be expected to result in around 9.3% more GHG emissions on average (at 12.8 gCO2eq/seat-km) than equivalent conventional rail (at 11.7 gCO2eq/seat-km) in 2025, according to calculations using central scenario values. This difference drops to 4.4% more
over the 30-year lifetime of the trains, with HSR at 7.8 gCO2eq/seat-km and conventional rail at 7.5 gCO2eq/seat-km. This is because the importance of emissions from direct energy consumption decreases due to decarbonisation of electricity generation;
• Per passenger-km (pkm) HSR is anticipated to produce significantly lower GHG emissions than conventional rail. This is the case both when assuming typical differences in European occupancy levels between conventional and HSR and for the modelled differences in occupancy levels from the NLP Strategic Business Case. On average HSR (at 30.3 gCO2eq/pkm) is expected to result in around 15% less GHG emissions on average than conventional rail (at 35.7 gCO2eq/pkm) in 2025, according to the calculations using central values. This GHG emissions for HSR reduce further to 18.8% less (at 18.5 gCO2eq/pkm) than conventional rail (at 22.7 gCO2eq/pkm) when considering them over the 30-year lifetime of the trains. The differential increases further when modal shift and demand creation are factored in – to 17.4% less (26.4 gCO2eq /pkm and 32.0 gCO2eq/pkm respectively for HSR and conventional rail) in 2025, and 23.5% less (15.1 gCO2eq/pkm and 19.7 gCO2eq/pkm respectively) over the 30-year train lifetime;
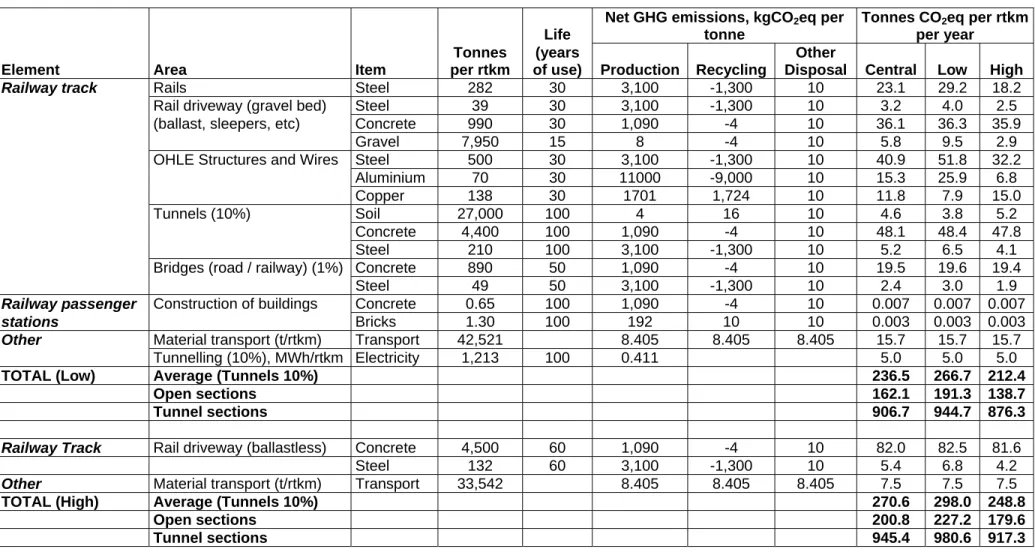
• Impact of electricity decarbonisation: When assuming current grid electricity emission factors and electric train models the GHG emissions due to direct energy use of the train accounted for over 80% of the total emissions (with 18% due to rail infrastructure and <1% due to indirect emissions due to trains). However, the direct train component drops to around 28% when assuming the use of new trains over 30 years from 2025 and the CCC’s proposed rapid decarbonisation of UK electricity generation. In this case the emissions resulting from new rail infrastructure dominate, accounting for around 70% of the total. The majority of the emissions from construction of new rail infrastructure result from the use of concrete and steel. Significant gains might therefore be achieved by focussing on reducing the emissions footprint of these materials.
• Comparison of conventional and high-speed rail under central assumptions: Conventional and high-speed rail were compared for the different reference routes for services proposed under the NLP Strategic Business Case. Under the central assumptions the total average GHG
emissions over the 30 year lifetime of the trains were calculated to be 18.5 gCO2eq/pkm for high-speed rail and 22.7 gCO2eq/pkm for conventional rail. When modal shift and demand creation effects are also included the average figures drop to 15.1 and 19.7 gCO2eq/pkm respectively for HSR and conventional rail. The benefits of modal switching therefore outweigh the counter-action of factoring in demand creation. Due to significantly lower modelled average occupancy levels, the equivalent modelled services direct from Birmingham to Glasgow and Edinburgh have average emission factors around double these figures.
• Sensitivity analysis on occupancy levels and passenger numbers: The ±20% sensitivities on occupancy levels and passenger numbers show that as the average percentage occupancy levels of conventional and high-speed rail become closer together, the advantage high-speed rail has in terms of direct emissions per passenger-km is eroded. Parity is reached in their relative
emissions when load factors for conventional rail are around 4% lower than those for high-speed rail. However, it is the total passenger numbers that are critical in the analysis, as this affects the allocation of emissions resulting from the rail infrastructure. Therefore a higher number of services with lower occupancy but high overall passenger numbers is strongly favoured over significantly less-frequent but high-occupancy services that potentially move fewer passengers.
• Sensitivity analysis on the carbon intensity of electricity generation: The sensitivity on the electricity decarbonisation rate shows that varying the assumption on future decarbonisation of electricity generation has a 30-40% impact on the total greenhouse gas emissions and over 60% on the component due to direct energy consumption by trains. Under central (rapid
decarbonisation) assumptions the range for the GHG emissions between 2025 and 2055 respectively was from 30.3 to 15.0 gCO2eq/pkm for respectively HSR and 35.7 to 19.0
gCO2eq/pkm for conventional rail (excluding the effects of modal shift and demand creation). • Sensitivity analysis on embedded greenhouse gas emissions: The percentage of recycling of
materials at the end of the life of infrastructure (and to much a lesser degree trains) has a very significant impact on the final results. Because of the dominating effect of embedded
infrastructure emissions in the overall assessment this puts a high level of importance to designing recyclability into the design of new infrastructure as far as possible. The sensitivities on % tunnels on new line infrastructure and on the type of track also underline the importance of these elements in the overall analysis. Using ballastless track results in significantly higher GHG emissions in its construction compared to conventional track, but no detailed information was available on GHG savings due to reduced maintenance. More detailed evaluation of the GHG savings potential through avoided maintenance would be beneficial to inform the comparison should this option become preferred over conventional track in the future. The sensitivity on the % tunnels on new lines suggests that the alternatives to tunnelling should be investigated where possible.
• Sensitivity analysis on modal shift and demand creation: The analysis using information from the NLP Business Case showed that the benefits of modal shift from car and air tranpsort
outweighed the counteracting demand creation element in the overall analysis. They also showed that the net benefits due to modal shift and demand creation for high-speed rail services are notably larger than those for conventional rail, further improving high-speed rail’s relative performance. Because of the complexity in changes to rail services and passenger numbers on existing lines it was not possible to quantitavily factor in the impact if abstraction from existing rail.
Overall Conclusions and Recommendations for Future Work
Overall, this work has provided a comprehensive review and evaluation of the elements that contribute to the overall energy consumption and net greenhouse gas emissions from electric rail. Through detailed analysis and sensitivities this study has also explored the impacts of key assumptions on these elements on the overall comparison of the relative performance of future conventional and high-speed rail on proposed new lines. The work has clearly demonstrated the significant net benefit of high-speed rail services over equivalent conventional services in terms of energy consumption and GHG emissions per passenger-km in the context of proposed new line development. Factoring in the net effects of modal shift and journey creation adds to this advantage. Also highlighted is the
overriding significance of the GHG emissions due to new rail infrastructure in the anticipated future where the electricity system is highly decarbonised. This in turn puts significant emphasis on the importance of minimising emissions from the construction of any new rail infrastructure, focussing on sourcing lower carbon materials and on the recyclability of end of life components. On the basis of the analysis for this study, the development of new lines to provide high-speed rail services appears to be highly desirable in reducing GHG emissions in the long-term. However, there will be very significant up front GHG emissions from the construction of new infrastructure in the short-term.
The results of the work also suggest a number of areas for further research to help better understand and minimise the environmental impact of rail.
• More detailed analysis of specific proposals including other environmental impacts: This work has provided a preliminary scoping level assessment of the potential impacts of the
development a high-speed rail service in terms of greenhouse gas emissions. However, a more detailed assessment would be beneficial once the preliminary proposals have been firmed up. At this stage an assessment of the other environmental impacts would be appropriate, such as emissions of air quality pollutants, noise and land-take.
• Research into ways to minimise the environmental impact of new rail infrastructure: The results on the relative importance of infrastructure emissions suggests a more detailed piece of research focussing on this element would be worthwhile to include other impacts such embedded emissions of air quality pollutants. Whilst a preliminary assessment of the impacts have been carried out here, a more in depth life cycle assessment is desirable. Research into the potential for minimisation of the GHG emissions footprint of new rail infrastructure through sourcing of less carbon intensively produced materials would also seem worthwhile.
Table of Contents
Executive Summary
ii
Glossary and Energy Unit Equivalencies
viii
1
Introduction 1
1.1 Scope of work 1
1.2 Information collection 2
1.3 Report structure 2
2
Factors Affecting Comparisons of Energy Consumption and GHG
Emissions 3
2.1 Direct energy consumption and emissions from trains 4
2.2 Indirect energy consumption and emissions from trains 15 2.3 Energy consumption and emissions resulting from rail infrastructure 20
2.4 Other factors affecting comparisons 24
3
Results of Comparative Analysis
32
3.1 Definition of scenarios 32
3.2 Breakdown of relative impacts 35
3.3 Sensitivity analysis on key parameters 40
4
Summary and Conclusions
45
5
References 50
Appendices
List of Figures
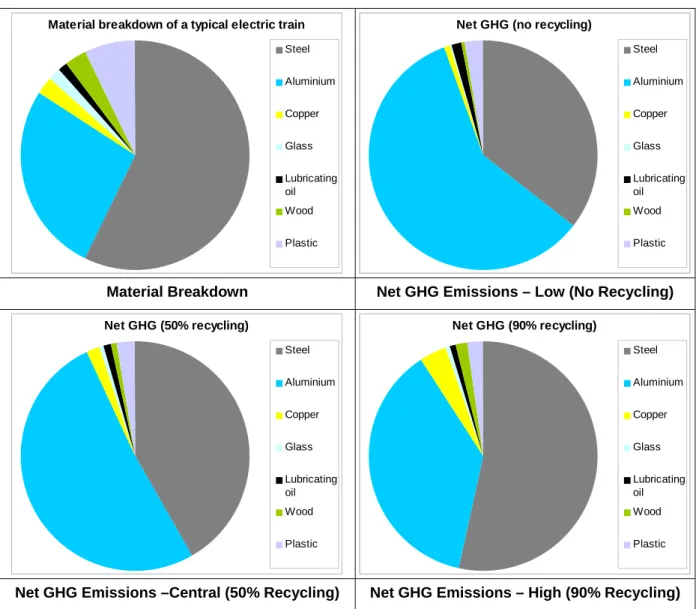
Figure 2.1: Typical composition of energy demand for high-speed and conventional rail services 4 Figure 2.2: Energy flow diagrams for passenger trains with and without regenerative braking 5 Figure 2.3: Energy conversion losses for a German ICE electric multiple unit 7 Figure 2.4: Comfort function demands for a train in UK winter (0°C) 7 Figure 2.5: Typical breakdown of components in electric multiple unit trains by weight 10 Figure 2.6: Typical breakdown of components contribution to drag in electric trains 10 Figure 2.7: Energy consumption of current and future rolling stock (kWh per seat-km) 13 Figure 2.8: Trend between energy use (kWh/seat-km) and speed (km/h) for European trains 13 Figure 2.9: Low and High Scenarios for Future Carbon Intensity of UK Grid Electricity 15 Figure 2.10: Proportional breakdown of materials used in electric rail rolling stock and corresponding
net emissions of greenhouse gases for production and disposal at different recycling
rates 18
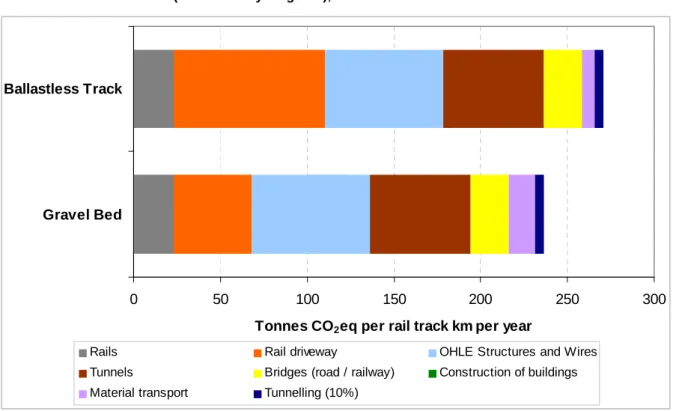
Figure 2.11: Breakdown by electric rail infrastructure element of the net embedded greenhouse gas emissions for (at a 50% recycling rate), annualised over the infrastructure lifetime 21 Figure 2.12: Proportional breakdown of materials used in electric rail infrastructure and
corresponding net emissions of greenhouse gases for production and disposal (at a
50% recycling rate) 23
Figure 2.13: The core New Line only options from London considered in the New Lines Programme
Strategic Business Case (NEW LINES PROGRAMME, 2009) 26
Figure 2.14: Speed Assumptions for the New Lines Programme Strategic Business Case (NEW
LINES PROGRAMME, 2009) 26
Figure 2.15: Detail on the full option (MB1.4.1) considered in the New Lines Programme Strategic
Business Case (NEW LINES PROGRAMME, 2009) 27
Figure 2.16: Train Service Specification for Full Option (MB1.4.1) considered in the New Lines Programme Strategic Business Case (NEW LINES PROGRAMME, 2009) 27 Figure 2.17: Modal share of high-speed rail services and flights by journey time 30 Figure 2.18: Assumptions on the projected improvement in the greenhouse gas emissions from cars
and domestic air transport 31
Figure 3.1: Breakdown of the total GHG emissions from conventional and high-speed rail per seat-km for different routes (assumes current trains and carbon intensity of electricity) 35 Figure 3.2: Breakdown of the total GHG emissions from conventional and high-speed rail per
seat-km for different routes (assumes future trains and carbon intensity of electricity) 36 Figure 3.3: Breakdown of the total GHG emissions from conventional and high-speed rail per
passenger-km for different routes (assumes future trains and carbon intensity of
electricity) 37
Figure 3.4: Breakdown of the total GHG emissions from conventional and high-speed rail per
passenger-km by impact area 38
Figure 3.5: Summary comparison of the relative performance of conventional and high-speed rail at
different timeframe assumptions (NLP-SBC Total) 39
Figure 3.6: Sensitivity analysis breakdown on the impact of varying occupancy levels and
passenger numbers on the comparison of total GHG emissions from conventional and
high-speed rail 40
Figure 3.7: Sensitivity analysis on the impact of the assumptions on the future decarbonisation electricity generation to the comparison of conventional and high-speed rail 41 Figure 3.8: Sensitivity analysis on the impact of the assumptions on the % recycling of end of life
infrastructure and trains to the comparison of conventional and high-speed rail 43 Figure 3.9: Sensitivity analysis on the impact of the infrastructure assumptions on the % tunnels
Figure 3.10: Sensitivity analysis on the impact of the assumptions on modal shift and demand creation to the comparison of conventional and high-speed rail 44
List of Tables
Table 2.1: Principal contributors and example values for the three Davis formula coefficients 6 Table 2.2 Elasticities for efficiency measures on total energy consumption for current electric
trains 8
Table 2.3 Modelled impacts of efficiency measures on energy consumption for Japanese
Shinkansen HSR 8
Table 2.4: Summary of measures to reduce energy consumption from trains 9 Table 2.5: Characteristics of current and future rolling stock used for conventional and high-speed
rail 12
Table 2.6: Total greenhouse gas emissions (in kgCO2eq per tonne material) resulting from
different stages of the material lifecycle (production, recycling, other disposal) 16 Table 2.7: Material breakdown for typical electric rail rolling stock and corresponding net emissions of greenhouse gases for production and disposal at different recycling rates 18 Table 2.8: Characteristics of current and future rolling stock used for conventional and high-speed
rail and the net greenhouse gas emissions under the central recycling scenario 19 Table 2.9: Estimated energy and water consumption per train-drive km for train maintenance and
refitting 19
Table 2.10: Estimated embedded emissions for electric rail infrastructure based on ballasted or
ballastless track, breakdown by element 22
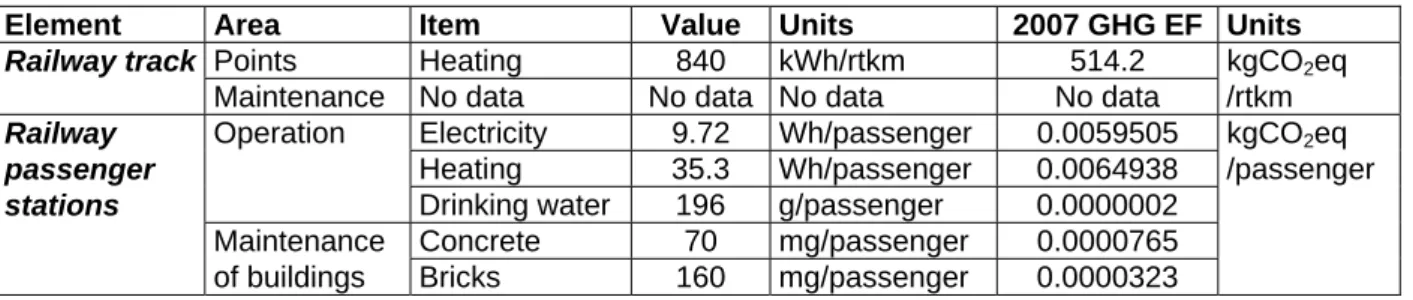
Table 2.11: Estimated annual in-use activity elements for electric rail infrastructure and equivalent
2007 emissions factors 23
Table 2.12: Typical load factors for European high-speed rail services 25 Table 2.13: Modelled average load factors for conventional and high-speed services from the New
Lines Programme Strategic Business Case (NEW LINES PROGRAMME, 2009) 28 Table 2.14: Modelled average modal switch and journey creation for conventional and high-speed
services from the New Lines Programme Strategic Business Case (NEW LINES
PROGRAMME, 2009) 30
Table 3.1: Summary definition of the Central, Low and High scenario assumptions used in the
analysis 32
Table 3.2: Assumtions for scenarios on the projected greenhouse gas emission factors for
electricity, passenger cars and domestic flights 32
Table 3.3: Detailed definition of the Central, Low and High scenario assumptions for passenger numbers, occupancy and the proportion of tunnels on new lines for different services 33 Table 3.4: Comparison of services in the New Lines Programme Strategic Business Case with
typical European high-speed rail services 34
Table 3.5: Definition of the Central, Low and High scenario assumptions for modal shift and
demand creation on new lines for different services 34
Table 3.6: Sensitivity analysis on the impact of the assumptions on modal shift and demand creation to the comparison of conventional and high-speed rail (NLP-SBC Total) 44
Glossary
Term/Abbreviation Definition/Explanation
Carbon footprint A measure of the impact human activities have on the environment in terms of the amount of greenhouse gases produced
Catenary The system of overhead wires suspended above the track that deliver power to electric trains.
CH4 Methane
CO2 Carbon dioxide
eq CO2 or CO2eq Carbon dioxide equivalent: a quantity that describes, for a given mixture and amount of greenhouse gas, the amount of CO2 that would have the same global warming potential (GWP), when measured over a specified timescale (usually 100 years).
EMUs Electric Multiple Units – a type of electric train that has powered vehicles across the train formation, rather than a single power vehicle/locomotive at either end with unpowered carriages.
GHG Greenhouse gas
GWP Global Warming Potential
IPCC Intergovernmental Panel on Climate Change
LCA Life cycle assessment
Load Factor The fractional or percentage occupancy of a train
N2O Nitrous oxide
Pantograph A pantograph is a device fitted to the roof of the train that collects current from the overhead wires.
passenger-km or pkm Passenger kilometre = Unit of measure representing the transport of one passenger over one kilometre.
RE Renewable energy
seat-km or skm Seat kilometre = Unit of measure representing the movement over one kilometre of one seat available in a train (or other mode of transport) Tare mass The technical term for the total unlaiden mass of a train
TOC Train Operating Company
Energy Unit Equivalencies
From /To - multiply by GJ kWh Toe
Gigajoule, GJ 1 277.78 0.023885 Kilowatthour, kWh 0.00360 1 8.5985E-05 Tonne oil equivalent, toe 41.868 11630 1
1 Introduction
The New Lines Programme is to test the hypothesis that in 2020, the existing rail lines from London to the North and West will be operating at full capacity and the conventional and the next generation tools for increasing capacity will be exhausted. There will be the need for additional intervention. The programme aims to develop and evaluate the options for building new lines; including in this is the need to evaluate the environmental impacts of such an intervention in terms of expected energy consumption of new rolling stock, understand any step change in energy consumption between new versus existing rolling stock including diesel versus electric and to assess localised environmental impact during and after construction.
As a result there is a need to better understand the environmental impact of building one or more new lines in terms of:
• Performance (energy consumption) of rolling stock, both current high-speed (electric), conventional (diesel) rolling stock and future electric rolling stock;
• Seating occupancy levels in high-speed versus conventional services;
• Estimated direct and indirect greenhouse gas emissions from diesel and electric rolling stock (both in current and likely future electric mix);
• Estimated emissions resulting from the construction, maintenance and decommissioning of rolling stock;
• The potential energy consumption/emissions resulting from construction of new infrastructure in terms of materials used in the construction of infrastructure (and the energy
consumption/emissions per kg of these materials) as well as the energy use/emissions resulting from infrastructure construction activities;
• The role of energy consumption/emissions savings resulting from modal shift and factoring in demand generation in the overall comparison.
This environmental study was carried out to assess the relative environmental performance of
conventional and high speed electric rail services. The purpose of this work is to provide an objective comparison between the different options and the key assumptions that affect the outcome of the comparison. In doing this, the work also needs to take into account the long timeframes associated with planning and constructing large railway infrastructure projects including wholly new rail lines (e.g. around 20 years for both the Channel Tunnel Rail Link and Crossrail). Hence comparisons will need to be made on the anticipated performance of future high-speed and conventional rail rolling stock likely to be put into service in the 2025-2030 timeframe.
1.1
Scope of work
1.1.1 Definition
of
High-Speed Rail and Evaluation of Environmental Impacts
For the purposes of this study, high-speed rail (HSR) services are defined as services faster than typical UK intercity limit of 200 km/hour, typically over 250 km/hour and up to 350+ km/hour.
Comparisons in this report are made for similar types of electric rail services for HSR and conventional rail – i.e. with conventional intercity service rolling stock (up to 200 km/hour), rather than rolling stock used in slower stop-start commuter services.
Although there are a wide range of environmental impacts resulting from rail, the focus for the work at this stage is primarily on energy consumption/ greenhouse gas emissions. Other environmental impacts (e.g. air quality, noise and land-take) will be considered in more detail at a later phase and are not within the scope of this project.
1.2 Information
collection
In order to obtain as up to date and accurate information as possible the project team needed to consult widely with experts in industry and academia. This was to enable the collection of more detailed information and develop of a more nuanced understanding of the issues than could be achieved from a simple review of the available literature. As part of this consultation an introductory letter was sent out in March 2009 requesting cooperation. A questionnaire (provided in Appendix 1) was also provided alongside this request to help identify key information for the analysis. The letter and questionnaire was subsequently followed up in email and telephone conversations and interviews. Advice and information was gratefully received by the project team from the following organisations and individuals which has informed the work:
• Alstom;
• Association of Train Operating Companies (ATOC);
• DeltaRail;
• Department for Transport (DfT); • Forum for the Future (FFF); • Greengauge 21;
• Hitachi;
• Professor Roger Kemp (University of Lancaster);
• Rail Industry Association (RIA); • Rail Industry Forum;
• Rail Research UK (RRUK);
• Rail Safety and Standards Board (RSSB); • Siemens;
• Steer Davies Gleave;
• International Union of Railways (UIC).
1.3 Report
structure
The aim of this report is to provide a preliminary assessement of the relative environmental impact of conventional and high-speed rail to help inform the wider business case being developed for the New Lines Programme. The report provides a summary of the results from this project, including the review of literature and consultation with stakeholders, results from comparative analyses, sensitivities and conclusions. This report is structured as follows:
• The theoretical background to train energy consumption, measures available to reduce this and, discussion of the different elements affecting the comparison of high-speed and conventional rail are provided in Section 2.
• A summary and discussion of the comparative analysis is presented in Section 3; • The summary and conclusions for the work are presented in Section 4, together with
recommendations for future work;
2
Factors Affecting Comparisons of Energy
Consumption and GHG Emissions
This chapter provides a discussion of the major elements that influence the overall energy consumption comparison of conventional and high-speed rail. For the purposes of this work, the comparison is restricted to energy use and greenhouse gas emissions. To properly consider the relative impacts a range of factors need to be evaluated. These can be loosely grouped into the following major categories:
1) Direct performance (energy consumption) of the rail rolling stock: In making comparisons it is important to understand both the current situation and the anticipated performance of trains that would be supplied to service new lines (i.e. most likely not going into service before 2025).
Comparisons between different trains are most usefully made in terms of the average energy used per seat-kilometre (i.e. total energy used per kilometre for the whole train divided by the total number of seats).
2) Seating occupancy levels and service frequency for high-speed versus conventional rail:
Seating occupancy levels (also known as the load factor) directly influence the net energy use / emissions per passenger. There are significant differences between different types of services, with high-speed services typically having higher occupancy levels. Together, average seating occupancy and service frequency provide a measure of the intensity of the use of the rail infrastructure. This is important to enable the embedded emissions from infrastructure to be allocated on a per passenger-km basis.
3) Direct and indirect greenhouse gas emissions from electricity production (current and likely future electricity mix): Assumptions on the projected carbon intensity of electricity in the future will significantly impact on the relative importance of the components of direct energy consumption by rail vehicles versus other elements such as the indirect/embedded energy consumption/emissions from rolling stock and infrastructure production and disposal;
4) Indirect emissions resulting from the construction, maintenance and decommissioning of rolling stock: A complete assessment of the impact or rail rolling stock needs to factor in the energy consumption and emissions resulting from the production, disposal and maintenance phases, as well as the direct energy consumption considered in earlier sections. There may be differences between the types or volumes of different materials used for conventional and HSR rolling stock that will affect their relative impacts;
5) Energy consumption/emissions resulting from construction and use of new rail
infrastructure: These can be very significant in size and could potentially significantly alter the picture if there are significant differences between conventional rail and HSR in the total passengers carried on rail new infrastructure. Elements include:
a) Materials used in the construction of infrastructure (and the energy consumption /emissions per tonne of these materials);
b) Energy use/emissions resulting from infrastructure construction activities; c) Annual variable energy use/emissions from infrastructure use and maintenance. 6) Energy consumption/emissions savings resulting from modal shift and factoring in
demand generation: Modal shift (e.g. from car and air transport to rail) and journey creation have effectively opposing impacts on the overall evaluation. Whilst modal shift from other modes of transport will provide additional benefits, demand creation effectively reduces the benefits of the higher occupancy rates (and total passenger numbers) typically achieved by high-speed rail. It is therefore important to provide a quantitative estimate of their respective impacts in the overall evaluation. Abstraction from existing rail services is much more complex to quantify due to changes in the type and frequency of service provision affecting the total energy consumption and passenger-km.
The primary focus of the project work was initially on the first three categories. However, it was important to consider the other areas where they may influence the relative comparison between HSR and conventional rail. The analysis presented in Section 3 has shown the importance of including the
other elements in the comparison, particularly the embedded emissions from construction of new rail infrastructure.
The following sub-sections provide a more detailed discussion of the different elements and a summary of the default and sensitivity data used for the analysis in Section 3.
2.1
Direct energy consumption and emissions from trains
2.1.1
Theoretical background to energy consumption
The direct energy consumption of electric train systems from electric substation to wheel-rail interface can be broken down into four main areas:
• Energy required to overcome the train’s resistance to movement;
• Energy lost due to inefficiencies in the traction system between pantograph and wheel; • Energy used for on-board passenger comfort functions; and
• Losses in the electrical supply system between the substation and pantograph.
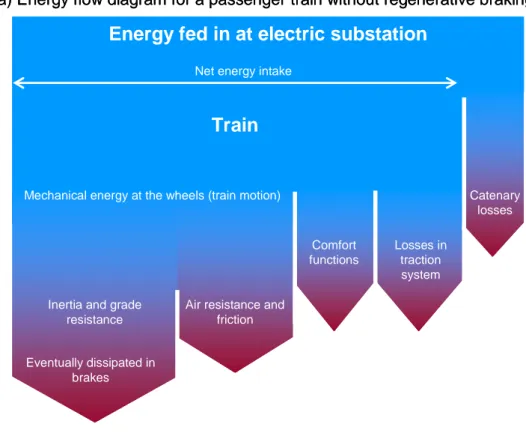
Figure 2.1 shows the breakdown of energy demand for power taken from the catenary for high-speed and conventional electric trains; it can be seen that the majority of demand for energy is to provide motive power to overcome running and inertial \ grade resistance. Figure 2.2 shows the energy flow for trains with and without regenerative braking (which feeds power back into the catenary that would otherwise be dissipated as heat in friction brakes).
Figure 2.1: Typical composition of energy demand for high-speed and conventional rail services
17% 9% 19% 10% 53% 35% 63% 69% 61% 68% 27% 37% 20% 22% 20% 22% 20% 28% 0% 20% 40% 60% 80% 100%
High Speed (without regeneration) High Speed (with
regeneration) Intercity (without regeneration) Intercity (with regeneration) Regional (without regeneration) Regional (with regeneration)
Inertia and grade resistance Running resistance Comfort functions
Figure 2.2: Energy flow diagrams for passenger trains with and without regenerative braking
Energy fed in at electric substation
Catenary losses Losses in traction system Comfort functions
Train
Mechanical energy at the wheels (train motion)
Inertia and grade resistance
Eventually dissipated in brakes
Air resistance and friction Net energy intake
Energy fed in at electric substation
Catenary losses Losses in traction system Comfort functions
Train
Mechanical energy at the wheels (train motion)
Inertia and grade resistance
Air resistance and friction
Net energy intake
Regenerative braking Di s s ip a te d i n bra k es Los s e s in tra c tio n sy ste m Ene rgy re tu rne d to ca te na ry
a) Energy flow diagram for a passenger train without regenerative braking
b) Energy flow diagram for a passenger train with regenerative braking
Energy fed in at electric substation
Catenary losses Losses in traction system Comfort functions
Train
Mechanical energy at the wheels (train motion)
Inertia and grade resistance
Eventually dissipated in brakes
Air resistance and friction Net energy intake
Energy fed in at electric substation
Catenary losses Losses in traction system Comfort functions
Train
Mechanical energy at the wheels (train motion)
Inertia and grade resistance
Air resistance and friction
Net energy intake
Regenerative braking Di s s ip a te d i n bra k es Los s e s in tra c tio n sy ste m Ene rgy re tu rne d to ca te na ry
a) Energy flow diagram for a passenger train without regenerative braking
b) Energy flow diagram for a passenger train with regenerative braking
2.1.1.1 Energy required to move the train
The energy required by the traction system accounts for around three-quarters of a train’s direct energy use in service (UIC EVENT 2003), as indicated earlier in Figure 2.1. Traction energy demand falls into two main categories: energy required to overcome inertial (ie accelerating the train) and grade resistance, and energy needed to overcome running resistance (friction and drag).
The energy needed to overcome inertial and grade resistance is caused by and hence directly proportional to train mass. Energy used is not dissipated but stored as kinetic and gravitational potential energy respectively, and thus is theoretically fully recoverable. Regenerative braking aims to recover as much of this energy as possible, but inefficiencies and operational restrictions mean that inevitably a proportion is lost. The acceleration profile of the train (eg number of stop/start cycles, driving style) affects the amount of energy needed to overcome inertia; topography of the line affects the energy input needed due to grade resistance.
All energy needed to overcome running resistance is due to friction and is disspiated, mostly as heat. An empirical expression for train resistance R on a straight level track is given by the Davis formula (UIC EVENT 2003, RSSB 2007a) as:
2
Cv
Bv
A
R
=
+
+
Where A, B and C are constants for a given train-track system:
• A is the rolling resistance component independent of train speed v; • B is the train resistance component dependant on train speed v;
• C is a coefficient dependent on train aerodynamic properties, proportional to the square of train speed.
Table 2.1: Principal contributors and example values for the three Davis formula coefficients
Principal contributors Example values1 A Journal resistance; rolling rotational resistance; track resistance 2240 B Flange friction; flange impact; wave action of rail; wheel to rail
rolling resistance 43.53
C Head end wind pressure; skin air friction on train sides; rear air
drag; air turbulence between vehicles; yaw angle of constant wind 4.41 Sources: Based on information from RSSB (2007a) and UIC EVENT (2003)
Notes: 1 Figures for the Swedish X2 high-speed train in a 6-car configuration running at 200km/h (v = 55.56m/s) calculated from p20 of the EVENT final report.
It can be seen from the example values given in Table 2.1 that for a train travelling at 200 km/h (55.56 m/s) the aerodynamic term (Cv2) is around an order of magnitude greater than the other two terms, which are similar to each other in magnitude. From this it can be concluded that:
• For modern high-speed rail travel, aerodynamic resistance dominates, and;
• For a given train, the resistance to motion increases approximately with the square of train speed.
2.1.1.2 Losses in traction systems
Inefficiencies in various electrical and mechanical components in the train traction system lead to energy being dissipated as heat, which in turn leads to a demand for ancillary energy for cooling. Modern electric trains draw power from overhead lines, transform to DC (if necessary) before using a traction inverter to provide 3-phase AC power to synchronous motors. State-of-the-art 16.7Hz 15kV AC systems are around 85% power efficient at full load, with 50Hz AC or DC systems reporting higher efficiencies (UIC EVENT, 2003). However it should be noted that overall power efficiency is lower at lower loads, meaning that energy efficiency over a typical load cycle will be much lower than at peak load. The inverse power train (used in regenerative braking) has approximately the same efficiency as the forward power train (Kemp 2009, Hitachi 2009).
In some cases (e.g. transformers), the most efficient components are also the heaviest, and so there is a trade-off between reducing weight and reducing traction system losses when optimising traction components.
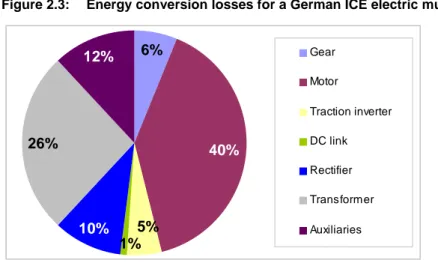
Figure 2.3: Energy conversion losses for a German ICE electric multiple unit
6% 26% 1% 5% 12% 10% 40% Gear Motor Traction inverter DC link Rectifier Transformer Auxiliaries
Sources: Based on information from UIC EVENT (2003) Project report, p36
2.1.1.3 Comfort functions
Comfort functions include lighting, heating and ventilating coaches for passenger comfort. Whilst this is mainly required during operation there is demand during stabled hours for cleaning and
maintenance and to ensure a comfortable temperature when the train begins operation. Comfort function energy demand depends strongly on ambient temperature. The UIC EVENT (2003) study estimated that comfort functions account for around 20% of the energy consumption of a train on average. Since comfort function energy use is independent of train speed, a train that travels at higher speeds or spends less time idling between stations will have a lower comfort function energy use per seat-km than the same train taking more time to cover a given distance.
Figure 2.4: Comfort function demands for a train in UK winter (0°C)
10% 8% 26% 56% Passenger area climate control Heating of secondary spaces Coach ventilation Lighting etc
Sources: Based on information from UIC EVENT (2003) Project report, p43
2.1.1.4 Losses in supply system
Losses occur in the electrical supply system due to resistance in catenary lines and inefficiencies at substations. However, such losses will be constant for an electrical system supplying power at a given voltage, regardless of the characteristics of the trains in the system. For this reason supply system losses are not discussed further in this section.
2.1.2
Principal measures to reduce energy consumption in electric rail
Measures to reduce energy consumption in electric rail can be grouped into two categories: technical measures where hardware is modified to reduce its consumption in given operating conditions, and operational measures where the operating conditions are modified to reduce the energy consumption of hardware. These measures are summarised in Table 2.4, and the most significant are discussed in more detail below.
None of the studies reviewed or interviews conducted as part of this research pointed to any measures, technical or operational, which only applied to one of high-speed or conventional rail services. The rolling stock manufacturers interviewed affirmed that the main technical measures planned to reduce energy consumption in new rolling stock are common to both high-speed and conventional rail, and the magnitude of benefit achieved by each measure was broadly similar. Table 2.2 shows the elasticities1 for three key efficiency measures on overall train energy
consumption: improving the efficiency of the traction system, reducing train mass and reducing train running resistance (friction and drag). The effect of regenerative braking on the elasticities is also shown. It can be seen that the elasticities are very similar for high speed and intercity trains; the likely differences for elasticities with regard to train mass and running resistance are discussed in 2.1.2.1 and 2.1.2.2 respectively. Similar levels of significance for the different types of measure can also be seen in the simulated impacts for the Japanese high-speed Shinkansen trains in Table 2.3 (WCHSR, 2008). It is important to note that considering elasticities alone can be deceptive. In considering how to target effort, the relative ease (and cost) of making improvements and the total remaining potential for improvements also needs to be taken into account. For example, it may be that it is easier or more cost effective to make significant reductions in train mass than to improve traction efficiency.
Furthermore, it is important to also take account of potentially counter-balancing effects of different options. For example, high-efficiency transformers tend to be heavier, offsetting electrical efficiencies gained.
The consensus amongst the rolling stock manufacturers interviewed was that high-speed trains will always consume more energy per seat-km than conventional trains with the same technological refinements, and that the current proportional difference in direct energy consumption is unlikely to change significantly in the next 20-30 years.
Table 2.2 Elasticities for efficiency measures on total energy consumption for current electric trains
Elasticities with regard to: Train type Traction
Efficiency
Train Mass
Running Resistance High speed without regenerative braking 1.00 0.17 0.63 High speed with regenerative braking 1.11 0.12 0.66 Intercity without regenerative braking 1.00 0.19 0.61
Intercity with regenerative traking 1.12 0.14 0.65
Notes: Reproduced from UIC EVENT Project report, Table 2.
Table 2.3 Modelled impacts of efficiency measures on energy consumption for Japanese Shinkansen HSR
Measures Level of measure Impact on energy consumption
Impact for 1% change Reducing vehicle weight 1 ton/car decrease -1% -0.4%
Reducing air friction 10% decrease -6% -0.6%
Efficiency of main electrical circuit 1% increase -4.0% -4.0%
Notes: Based on figures on effects estimated by simulation for Shinkansen vehicles with regenerating brake, 515 km from Tokyo to Osaka (WCHSR, 2008)
1
Elasticity is defined as the level of influence an energy efficiency measure has on total energy consumption; for example, if for a certain train the elasticity with regard to reducing train mass is 0.17, reducing the train mass by 10% will reduce overall energy consumption by 0.1 x 0.17 = 1.7%.
Table 2.4: Summary of measures to reduce energy consumption from trains
Type of measure
Measure Typical effect on energy consumption Typical Elasticity Applicability for HSR vs CR Mass reduction
See elasticities in Table 2.2; WCHSR (2008) report a 1 ton/car decrease in weight on Shinkansen reduces energy consumption/CO2 emissions by 1% (Table 2.3).
0.12 - 0.14
Broadly similar effects to both types of train; slightly more benefit to services with more frequent stops.
Aerodynamics and friction
See elasticities in Table 2.2; WCHSR (2008) report a 10% reduction in air drag on Shinkansen reduces energy consumption/CO2 emissions by 6% (Table 2.3).
0.65 - 0.66
More significant at higher speeds as proportion of energy demand due to aerodynamic drag is greater. Reducing
traction system losses
See elasticities in Table 2.2; 1% reduction in energy use of a traction component reduces overall energy use by 1%, more if regenerative braking is employed as efficiency of both traction and regenerative braking systems are improved.
1.11 - 1.12
The potential for reducing energy consumption is the same for both train types.
Regenerative braking
Kemp (2009) has estimated 5-7% energy savings on intercity services; UIC EVENT (2003) implies trains that employ regenerative braking use 8-9% less energy than trains that do not.
N/A
A prerequesite on any modern electric train. More benefit to services with more frequent stops.
Improved space utilisation
TGV duplex achieves almost 30% reduction in energy per seat-km over
single-storey TGV. N/A
Equally applicable to both types of train; some
strategies (double-deck, wide body) incompatible with UK infrastructure. Techical Improved comfort function efficiency
Reducing passenger climate control energy consumption by 10% would reduce overall train energy use by around 1%2.
0.1
Trains that travel more km per day will have
proportionally lower comfort function energy demand per seat-km.
Increase load factor
UIC EVENT (2003) states increasing the load factor has the biggest potential of any measure to reduce energy on a passenger-km basis.
1
Equally applicable to both types of train; high-speed trains typically have higher load factors than intercity services.
Operational
Efficient driving strategies
RSSB (2007a) estimate a potential for up to 7.5% of overall traction energy use.
N/A
Equally applicable to both types of train. Not an issue for consideration in this study. Notes:
(a) Typical elasticities assume trains are fitted with regenerative braking systems. Estimates are derived from UIC EVENT (2003).
2.1.2.1 Mass reduction
All of the rolling stock manufacturers interviewed cited mass reduction as the most significant measure to reduce energy consumption of future models. Reducing train mass will reduce train energy use in several ways. Primarily it reduces the energy needed to overcome inertial and grade resistance; though theoretically recoverable by regenerative braking, inefficiencies in the traction system mean that in reality only a proportion can be returned to the catenery in this way. The total regenerative braking cycle, where energy is drawn from the catenary, put into train motion through the motors and then converted back through the inverse drive train, has a typical maximum efficiency of (0.85 x 0.85 = 0.72) (UIC EVENT 2003, Kemp 2009). In some cases (and more likely for heavier trains or trains travelling at higher speed) the braking force needed is greater than that available using regenerative
2
braking, meaning additional dissipative braking is used, further reducing the cycle efficiency. Reducing the train mass reduces the use of the comparitively inefficient regenerative braking cycle. Additionally, mass reduction will reduce frictional running resistance.
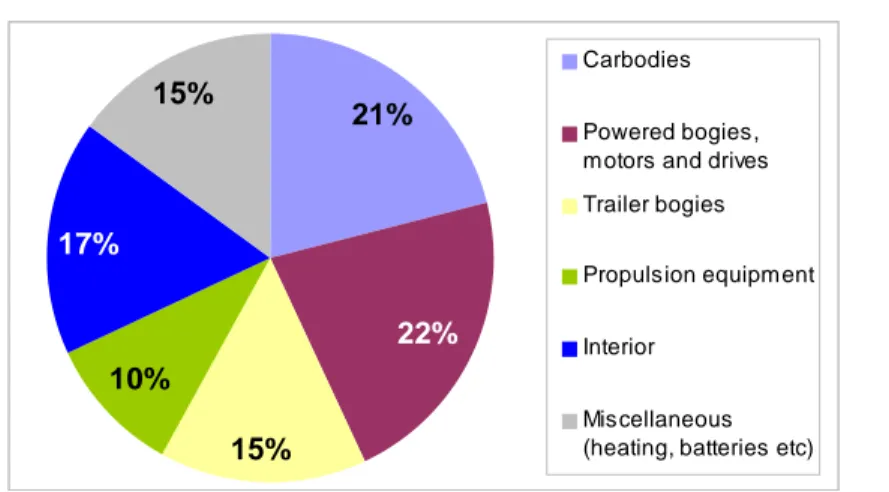
Mass reduction is typically achieved through reducing the weight of specific components (e.g. carbodies, bodies, bogies etc.) or through a system-based approach to lightweighting (e.g. the articulated train design favoured by Alstom, which reduced the number of bogies by around 20% by placing them between cars). Mass reduction will benefit services with less homogenous velocity profiles (more accellerating and decelerating) most (i.e. those that accelerate and decelerate more often).
Figure 2.5: Typical breakdown of components in electric multiple unit trains by weight
21% 15% 10% 15% 22% 17% Carbodies Powered bogies, motors and drives Trailer bogies Propulsion equipment Interior
Miscellaneous (heating, batteries etc)
Sources: Based on information from UIC EVENT (2003)
2.1.2.2 Aerodynamics and friction
As previously mentioned, at speeds above 200km/h aerodynamic drag dominates resistance to train motion. Figure 2.6 shows a breakdown of a train’s drag by component; it shows that for a long train (as high-speed and intercity train sets typically are), surface friction and drag around the bogies dominate aerodynamic drag. The main strategies to reduce drag are streamlining the nose and tail profile of the train, reducing flow separation around the bogies, pantograph and train body by streamlining, and reducing the skin friction on the train roof and sides. More effort has gone into reducing the drag of high-speed trains as at higher speeds aerodynamic drag is more significant, but the same principles apply to conventional trains. Interviewees suggested that improvements to medium and high speed train aerodynamics are incremental and that developments in the next 20-30 years are unlikely to radically alter the contribution of drag to energy demand, particularly in the UK where regulation prevents some radical aerodynamic train shapes (Hitachi 2009, Kemp 2009).
Figure 2.6: Typical breakdown of components contribution to drag in electric trains
45.5% 8.0% 7.5% 3.5% 4.5% 4.0% 27.0% Front Tail
Bogies and wheels Pantographs Ventilation etc Underfloor equipment Surface friction on side and roof
2.1.2.3 Reducing traction system losses
New model specifications from the major rolling stock manufacturers report improved efficiency in the traction system, both by improvements in the major components (for example permanent magnet motors, medium frequency transformers) and improvements in the energy management control software for the system as a whole. The fundamental technologies are the same for both high-speed and conventional rail rolling stock and consequently forecast percentage energy savings are also similar.
2.1.2.4 Reducing energy consumption for comfort functions
The principal component of comfort function energy use is air heating and cooling (UIC EVENT 2003). Energy demand in air temperature control can be reduced either by reducing heat transmission through improved coach insulation, or reducing fresh air intake through CO2 monitoring (fresh air intake dependant on number of passengers rather than number of seats). In addition, energy can be supplied from waste heat rejected from traction equipment (particularly in electric multiple units, EMUs) if the requirement is for heat. It is thought that there is significant scope for energy savings in this area (Kemp, 2009), but there is no anticipated difference in reduction of comfort function energy use between high-speed and conventional trains.
2.1.3
Energy consumption of current and future rolling stock
In making comparisons between conventional and high-speed rail the previous sections have discussed the theoretical background to energy consumption and the potential impacts of different energy saving measures that might be applied. However, it is important not only to factor in these considerations, but also the more practical market limitations on what new train types will actually be available to be put into service at the 2025 timeframe. Compared to the road transport sector, the rail industry is relatively small and trains have much longer service lives. As such, there are relatively few train manufacturing companies and train model platforms available. Also as a result of this there are relatively much longer development cycles for new platforms and much lower frequencies of platform replacement. This makes it easier to foresee with greater certainty the likely characteristics and performance of different types of electric trains in the timeframe we are interested in. The train manufacturers consulted as part of this work have confirmed that the conventional and high-speed rail platforms they are currently marketing will essentially be the ones that would be supplied for the 2025 timeframe. Although it is likely there will be some smaller incremental improvements in the efficiency of the currently available platforms, major improvements are unlikely.
The following Table 2.5 provides a summary of the characteristics of different conventional and high-speed rail rolling stock, based on information from ATOC (2009) and DfT (2009a). The data on energy consumption presented in this table and in Figure 2.7 are approximate figures based on a combination of in-service measurements and modelled data. In real applications the actual achieved energy consumption will vary significantly depending on the particular characteristics of a given service. Factors that can significantly affect the actual performance will include elements such as:
• Service distance and number of intermediate stops; • Line gradients;
• Service speeds;
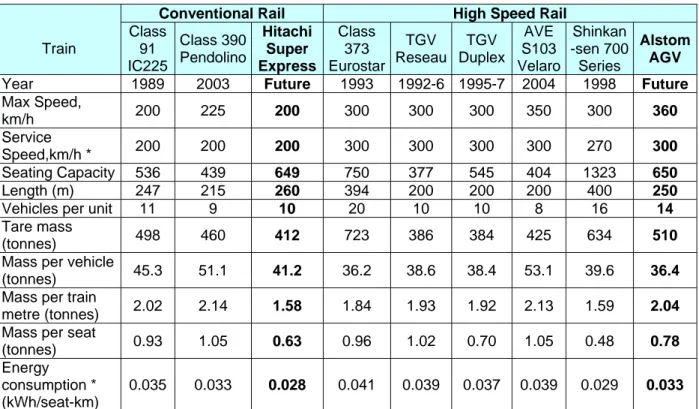
• Variations in service speed along the route (e.g. due to major curves, junctions, etc.), It can be seen from the table and figure that similar levels of improvements (15-20% reduction in kWh/seat-km) have been achieved for conventional and high-speed rail rolling stock between the 1990 timeframe and the most recent models (excluding the Japanese Shinkansen). In addition, in Figure 2.8 shows a much less pronounced increase in energy consumption than has previously been suggested. For the purposes of comparisons in this study we have taken the proposed Hitachi Super Express (HSE) for the UK Intercity Express Programme (IEP) and Alstom AGV as representative of the likely performance of rolling stock in the 2025 timeframe for conventional and high-speed rail respectively. In this case, the relative increase in the energy consumption per seat-km of the AGV and the HSE compared to equivalent current designs is around 18%, which is also consistent with the trend line in Figure 2.8.
The AGV is a train prototype rolling stock design from Alstom intended as the successor to France’s current TGV high-speed trains, with a commercial service speed up to 360 km/h (220 mph). The AGV will have distributed traction with motors under the floors of the passenger carriages, instead of the current TGV configuration with separate power cars at either end of the train. This arrangement is used on many regular-speed multiple-unit trains and also high-speed trains such as the Siemens Velaro and Japan's Shinkansen trains (Wikipedia, 2009) built by Hitachi. Not having separate, dedicated power cars creates additional space that enables the AGV to provide higher seating density compared to current models. This design feature is also employed in the Hitachi Super Express (HSE) trains. Alstom offer the AGV in configurations from seven to fourteen carriages, with a total of 250-650 seats (depending on internal layout and number of carriages). The AGV weighs less than its rivals which reduces its power consumption, and it consumes significantly less energy than previous TGV designs. Other design elements implemented to reduce the energy consumption of the AGV include articulation and permanent magnet motors. Both of these elements contributed to a reduction in the number of bogies, leading to further weight and aerodynamic benefits. It can be seen from Table 2.5 that both the HSE and the AGV have similar seating capacities at similar train lengths. However, the AGV has shorter vehicles and therefore a larger number in each train unit for a similar capacity.
Table 2.5: Characteristics of current and future rolling stock used for conventional and high-speed rail
Conventional Rail High Speed Rail Train Class 91 IC225 Class 390 Pendolino Hitachi Super Express Class 373 Eurostar TGV Reseau TGV Duplex AVE S103 Velaro Shinkan -sen 700 Series Alstom AGV
Year 1989 2003 Future 1993 1992-6 1995-7 2004 1998 Future
Max Speed, km/h 200 225 200 300 300 300 350 300 360 Service Speed,km/h * 200 200 200 300 300 300 300 270 300 Seating Capacity 536 439 649 750 377 545 404 1323 650 Length (m) 247 215 260 394 200 200 200 400 250
Vehicles per unit 11 9 10 20 10 10 8 16 14
Tare mass
(tonnes) 498 460 412 723 386 384 425 634 510
Mass per vehicle
(tonnes) 45.3 51.1 41.2 36.2 38.6 38.4 53.1 39.6 36.4
Mass per train
metre (tonnes) 2.02 2.14 1.58 1.84 1.93 1.92 2.13 1.59 2.04 Mass per seat
(tonnes) 0.93 1.05 0.63 0.96 1.02 0.70 1.05 0.48 0.78
Energy consumption * (kWh/seat-km)
0.035 0.033 0.028 0.041 0.039 0.037 0.039 0.029 0.033
Sources: Figures for the Class 91 IC225 and Hitachi Super Express were supplied by DfT (2009a) based on public information on the IEP. All other figures are based on figures from ATOC (2009), produced for Greengauge 21.
Notes: * The energy consumption figures are based on the service speed. Here the service speed represents the typical maximum speed of the train in service, usually dictated by the limits of the line infrastructure.
Figure 2.7: Energy consumption of current and future rolling stock (kWh per seat-km)
0.00 0.01 0.01 0.02 0.02 0.03 0.03 0.04 0.04 0.05
Class 91 IC225 (1989)
Class 390 Pendolino (2003)
Hitachi Super Express (Future)
Class 373 Eurostar (1993) TGV Reseau (1992-6) TGV Duplex (1995-7) AVE S103 Velaro (2004) Shinkansen 700 Series (1998) AGV (Future) C onv e n ti ona l H igh S p e e d
Energy Consumption, kWh/seat-km
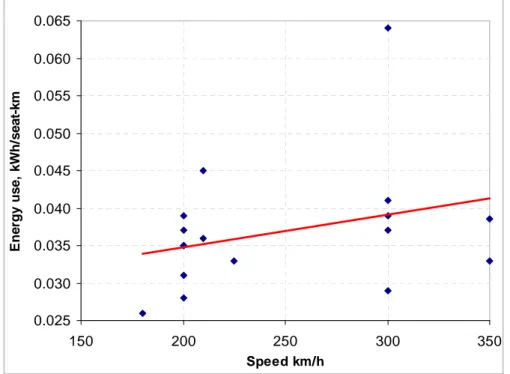
Figure 2.8: Trend between energy use (kWh/seat-km) and speed (km/h) for European trains
0.025 0.030 0.035 0.040 0.045 0.050 0.055 0.060 0.065 150 200 250 300 350 Speed km/h E n er g y u se, kWh /se at -k m
Notes: This plot the trend-line of speed versus energy consumption has been updated from the original presented in the RSSB (2007) traction energy metrics report using data from the more recent ATOC (2009) work and information from the IEP (DfT, 2009a).
Although the anticipated AGV performance is taken as representative for future UK HSR, the high-speed Japanese Shinkansen 700 trains already achieve lower energy consumption than the AGV, as shown in Table 2.5. In fact the newest model, the N700, has reportedly even lower energy
consumption per seat-km – an improvement of up to 19% over the 700 series (WCHSR, 2008). However, there are a number of important barriers to trains with the energy performance of such trains being used in the UK. The main barriers3 are linked to standards and interoperability: the wide body of the Shinkansen (which allows for 3+2 seats across the carriage as opposed to 2+2 in the EU) and
3
long nose section are incompatible with UK infrastructure. Furthermore, crashworthiness regulations in the EU mean that European trains are heavier and cannot utilise certain parts of the train for passenger seating when compared to their Japanese counterparts.
Other measures used to improve the performance per seat-km of rail in Europe include the double-deck configuration used by the TGV Duplex. However, as for the wide-body configuration, the need for future cross-compatibility of future rolling stock with the wider UK electricited network is a significant limiting factor. Long-distance direct services are favoured for a number of reasons in the UK (including minimising cost and maximising stock utilisation). It is therefore likely that any high-speed rolling stock procured for new high-high-speed lines would also need to be compatible to run on conventional speed electrified infrastructure. This would preclude new rollingstock utilising either the wide-body or double-deck designs to reduce energy consumption per seat.
2.1.4 Emissions
from
electricity generation
In establishing the lifetime emissions impacts resulting from direct rail energy consumption of different options it is important to factor in the likely change in the carbon intensity of the future electricity generation mix over time. Taking into account that services on any new lines would not be in place before 2025 at the earliest, and the typical 30 year lifetime of rail rolling stock this means developing suitable electricity carbon intensity scenarios to at least 2055.
Two legislative proposals will drive the decarbonisation of the UK electricity generation mix in the short and long term:
1. The EU’s commitment to a 20% reduction in GHGs by 2020 (rising to 30% if an international agreement can be reached beyond 2012) together with the EU Renewable Energy Directive target of 20% of EU energy consumption to come from renewable sources by 2020. As a result of effort-sharing between Member States, the UK-specific target is 15% reduction by 2020;
2. The UK’s domestic Climate Change Act target of an 80% reduction in GHGs by 2050 on a 1990 baseline.
In the short term the UK renewables share for electricity generation will need to be increased from around 5% currently to between 30-37% by 2020. This is because it is assumed the bulk of the 15% UK renewables target will need to come from electricity rather than other energy carriers (e.g. oil based transport fuels).
In the long term the UK’s statutory target to reduce greenhouse gas emissions by 80% by 2050 is taken as given, giving an approximate upper bound to the likely generation mix in this timeframe. However, detailed energy system modelling and analysis has shown that decarbonising electricity generation is one of the most cost-effective ways of making significant reductions in national carbon emissions. The Committee on Climate Change’s (CCC) analysis has shown the greater potential and cost-effectiveness of carbon emissions reductions in electricity generation in the short to medium term. CCC has therefore recommended much faster decarbonisation of the electricity sector and a more significant net contribution in the long term as essential to achieve the 2050 80% reduction goal (CCC 2008, ATOC 2009). This accelerated decarbonisation would require substantial measures to stimulate renewables, nuclear and carbon capture and storage in the short-medium term.
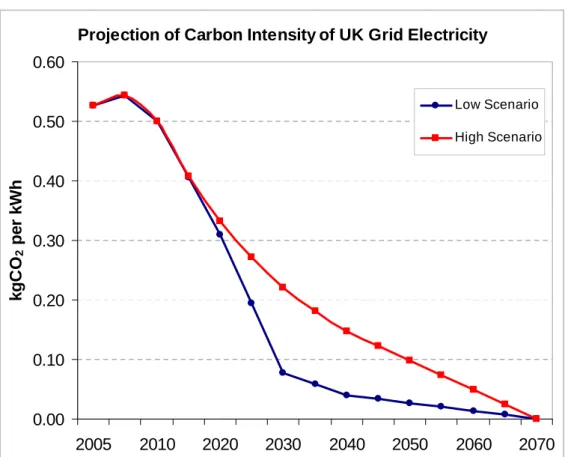
For the analysis carried out in this study we have therefore constructed two scenarios for the future carbon intensity of electricity, similar to those suggested by ATOC (2009) in their analysis for
Greengauge 21, presented in Figure 2.9. In the high scenario a 4% year-on-year reduction in carbon intensity is assumed from 2010. The low scenario is more aggressive than the high scenario in terms of the rate at which the carbon intensity of electricity generation decreases and follows the rapid decarbonisation pathway proposed by CCC (2008)4. In both cases we have assumed the downward trend continues after 2050, with essentially complete decarbonisation of electricity generation by 2070. In addition to the direct emissions of CO2 from electricity generation there are also smaller direct emissions of other greenhouse gasses - methane (CH4) and nitrous oxide (N2O). These account for around 0.7% of the total direct emissions of greenhouse gases resulting from electricity production. There are also further indirect emissions of CO2 and other greenhouse gasses resulting from the
4
For 2010-2020: DECC Energy Model, CCC abatement scenario, (extended ambition, central fuel prices); for 2025-2050: MARKAL modelling for the CCC (80% trajectory), adjusted to take account of losses in transmission and distribution.
extraction, transport and distribution of the primary fuels used in electricity generation. These indirect emissions have been estimated to add a further 12% (Carbon Tust, 2008) to the total (and are primarily due to the fossil fuel based component of generation). For completeness, we have included both the direct and indirect emissions of all the greenhouse gases in the analysis for this study.
Figure 2.9: Low and High Scenarios for Future Carbon Intensity of UK Grid Electricity
Projection of Carbon Intensity of UK Grid Electricity
0.00 0.10 0.20 0.30 0.40 0.50 0.60 2005 2010 2020 2030 2040 2050 2060 2070 kg C O2 pe r k W h Low Scenario High Scenario
Notes: The above figure only includes the direct emissions of CO2 from electricity generation. Resistive losses from transmission and distribution systems are included in the figures presented.
2.2
Indirect energy consumption and emissions from
trains
A complete assessment of the impact or rail rolling stock needs to factor in the energy consumption and emissions resulting from the production, disposal and maintenance phases, as well as the direct energy consumption considered in earlier sections. Whilst no quantitative information has been identified on the energy and emissions resulting purely from the rolling-stock manufacturing process, information is available on the breakdown (in tonnes) of material used in the construction of a typical electric vehicle unit. It is expected there would be some differences between different models of rolling stock in terms of the relative breakdown of materials, but no model-specific information has been identified. However, discussions with rolling stock manufacturers as part of this study have at least indicated that there are no fundamental differences expected between conventional and high-speed trains. The assumption made for this study is therefore that the relative material breakdown by weight of different rolling stock is similar.
A number of data sources were consulted to obtain information on the emissions due to the
manufacturing, recycling and disposal of the materials in question. Where data for specific materials was not available, proxy data have been used when possible based on the closest equivalents. The results for the group of materials included are summarised in the following Table 2.6, together with the primary source basis of the data. This dataset includes the materials utilised in analysis of embedded emissions from rail infrastructure in later Section 2.3.
Table 2.6: Total greenhouse gas emissions (in kgCO2eq per tonne material) resulting from different
stages of the material lifecycle (production, recycling, other disposal)
Material
Total Greenhouse gas (GHG)
emissions, kg/tonne material Primary Data Source Production Aggregates 8 GHG CF (2009) Aluminium 11,000 GHG CF (2009) Bricks 192 GHG CF (2009) Concrete 1,090 DfT (2007) Copper 1,700.9 SimaPro, 2007 Glass 840 SimaPro
Lubricating oil 1,004.8 SimaPro
Plastic 3,100 GHG CF (2009)
Plywood 887.1 SimaPro
Silt/soil 4 GHG CF (2009)
Steel 3,100 GHG CF (2009)
Synthetic rubber 2,774.1 SimaPro
Wood 84.3 SimaPro, 2007 Recycling Aggregates -4 GHG CF (2009) Aluminium -9,000 GHG CF (2009) Bricks 10 GHG CF (2009) Concrete -4 GHG CF (2009) Copper 1,723.8 SimaPro, 2007 Glass -315 SimaPro
Lubricating oil 0 N/A
Plastic -1,500 GHG CF (2009)
Plywood 250 SimaPro
Silt/soil 16 GHG CF (2009)
Steel -1,300 GHG CF (2009)
Synthetic rubber 40 SimaPro
Wood 250 SimaPro, 2007 Other Aggregates 10 GHG CF (2009) Disposal Aluminium 10 GHG CF (2009) Bricks 10 GHG CF (2009) Concrete 10 GHG CF (2009) Copper 10 GHG CF (2009) Glass 10 GHG CF (2009) Lubricating oil 3,938.6 GHG CF (2009) Plastic 40 GHG CF (2009) Plywood 10 GHG CF (2009) Silt/soil 10 GHG CF (2009) Steel 10 GHG CF (2009) Synthetic rubber 40 GHG CF (2009) Wood 10 GHG CF (2009)
Sources: GHG CF =Defra/DECC GHG Conversion Factors, 2009 update (forthcoming), Annex 9; SimaPro = Data from the SimaPro EcoInvent database (extracted 2007).
Notes: It is assumed that the alternative to recycling a material is disposal is to landfill = other disposal.
For each of the materials, the relevant factor from the Defra/DECC GHG Conversion Factors was used (2009 update - Annex 9, forthcoming). In the absence of factors from this source, the SimaPro lifecycle analysis software tool was used to calculate emissions associated with production and recycling (where applicable) of most of the other material elements. The database values generally represent average European production conditions, which is appropriate for the materials in question. For the rest of the materials listed above, alternative sources of data were used to obtain the energy usage to produce or recycle the material. These alternate sources are described below.
Glass: Because data on the energy used to produce or recycle toughened or laminated glass were not available, data for regular glass from the Defra/DECC GHG Conversion Factors have been used as a
proxy. According to Berryman,5 a glass recycling company, laminated and toughened glass can be recycled, though separating the laminate from the glass does add an extra step (and cost) to the process. After the glass is recovered, it is crushed and sold to the glass making industry. The glass would be used for making bottles and glasses as opposed to being used for flat glass again. At this point the process of recycling is the same as that for non-laminated flat glass; thus, emissions for recycling flat glass have been used as a proxy.
Lubricating Oil: No specific information on the emiss