Venture Capitalist Reputation and the Long-run
Performance of China’s Initial Public Offerings
Jing Ma
Submission for the degree of
Doctor of Philosophy
in
Accounting and Finance
Newcastle University Business School
March 2019
I
Abstract
China has experienced significant growth in the Initial Public Offering (IPO) market during the last decade. During this period, venture capital (VC) has been playing an increasingly important role in the IPO market. The main aim of this thesis is to empirically examine the impact of both VC-backing and VC reputation on the long-run performance of Chinese IPOs, and to explore whether the impact is subject to where the IPO get listed, e.g. ChiNext Board (a Nasdaq-type Board in China).
The thesis measures IPO performance with both share price performance and operating performance. In particular, the former is measured as the buy-and-hold abnormal returns, where the each IPO has its own matched portfolio as the benchmark. The latter is measured by the return on equity. These measures are calculated for up to three years post IPO. Significantly, this thesis acknowledges the wide range of possible metrics that can be used for measuring reputation and examines the importance of metric choice on the performance measurement outcomes. A special feature of the reputation used in this thesis is the use of a real-world and market-based ranking measure for VC reputation created by the Zero2IPO Research Group for the China market, which is more multifaceted than many of the traditional proxies for reputation used in earlier studies. This thesis constructs a cross-sectional sample consists of more than 1000 IPOs listed during the nine-year period from January 2004 through December 2012.
The thesis finds that although IPOs generally experience long-run underperformance in the Chinese stock market, VC-backed IPOs show better long-run performance than their non- VC-backed counterparts. In addition, there is some evidence that the higher the VC’s reputation, the better their invested IPOs perform in the stock market relative to non-VC-backed IPOs. This pattern is driven primarily by IPOs listed on the ChiNext Board (a Nasdaq-type Board), and the results are independent of reputation proxy. However, within the sample of VC-backed IPOs, the difference in performance between IPOs backed by high-reputation VCs and those backed by lower-ranked VCs is found not to be statistically significant and so this study is unable to provide conclusive evidence that VC reputation influences the performance of VC-backed IPOs. In the case of operating performance, neither VC-backing nor VC reputation affect post-IPO performance significantly. This is likely due to the limited forward-looking characteristics of historic accounting data, especially for early-stage and hi-tech firms. These results are robust to a range of additional tests.
The thesis brings forward some important policy implications based on the results. For example, the government should broaden the sources of funding to make private VC to participate more into the IPO market, provide more favourable tax policies to VC and encourage more involvements from VCs.
II
Acknowledgement
I would like to express my immeasurable appreciation and deepest gratitude to my supervisors Professor Simon Hussain and Dr. Chen Su for their continuous supports, professional guidance, and valuable supervisions throughout this period. I am so blessed to have them as my supervisors. My PhD study would not have been possible without their generous help, untiring patience, and inspiring encouragement. They give me the faith to overcome difficulties and the confidence to continue. As my supervisors, they have taught me more than I could ever give them credit for here. They have shown me, by their own examples, what good academics should be.
I am deeply indebted to the exceptional supports, care, and love from my parents. The financial supports, encouragement, and understanding they offered have made it possible for me to complete my study overseas. I especially would like to deliver my deepest thanks to my aunt and my grandmother, for their continuous and selfless love throughout my life. You all are so important to me.
Finally, I would also like to acknowledge all the colleagues and friends for their kindly help, emotional supports, and inspiring comments. All these make my PhD journey interesting, challenging and rewarding.
III
List of Figures
1.1 Distribution of A share IPOs ……….………...2
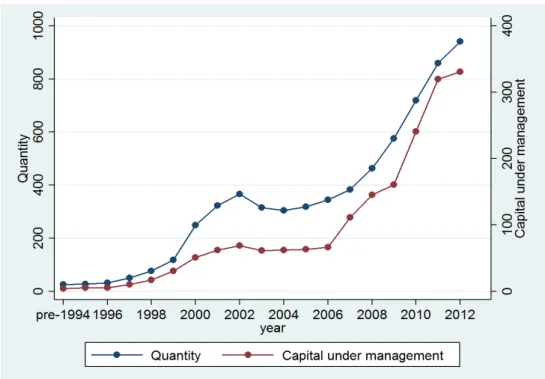
1.2 Distribution of VC Quantity and the Gross capital Raised ………6
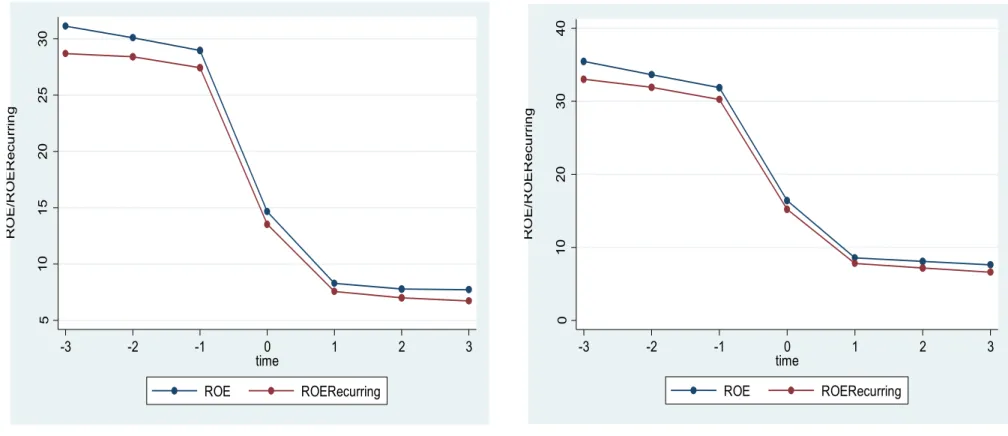
4.1 Operating Performance of IPOs …...110
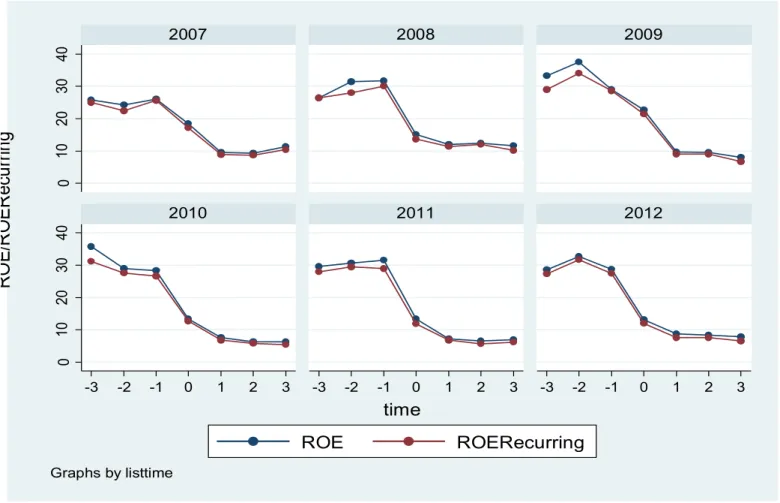
4.2 Operating Performance of IPOs by Year… ...111
IV
List of Tables
1.1 IPO Frequency and Market Capitalization of ChiNext ……… 4
3.1 Distribution of IPOs from 2004 to 2012 ………..……...53
3.2 Industry Classification by ICB ………...……... 54
3.3 Distribution of IPOs by Boards, Industry, and Ownership ………..……...55
3.4 VC Ranking Standards across 2004 to 2012 ………...…61
3.5 Lead VC Reputation ………..……….………... 65
3.6 Lead VC Reputation Correlation Matrix ……….……….. 66
3.7 High and Low Reputation ……….… 68
3.8 Descriptive of IPO Characteristics ………...………. ………74
3.9 A Summary of Variables ………...………….75
4.1 BHARs of IPOs from 2004 to 2012 ………..….….. 83
4.2 BHARs between VC-backed and Non-VC-backed IPOs………...… 85
4.3 Impacts of VC on Long-run Stock Market Performance……….. 87
4.4 VC Reputation and BHAR36 VC-backed IPOs . ………...………... 90
4.5 VC Reputation and BHAR36 on Full Sample ………... 92
4.6 Top-20 VCs and BHAR36 ………...……..…. 96
4.7 Top-50 VCs and BHAR36 ………...…………... 97
4.8 VC Ranking and Alternative BHARs ……….….……... 99
4.9 Alternative Lead VCs and BHAR36 ……….…….………...100
4.10 Alternative Reputation Measurements and BHAR36 ………...……...102
4.11 VC Ranking and BHAR36 by Boards ………..……….…...…104
4.12 Alternative Reputation Measurements and BHAR36 by Boards………...…. ….106
4.13 ROEs of IPOs from 2007 to 2012……….……….…...109
4.14 Changes of ROEs………..……….. .. 112
4.15 Changes of ROE1 of VC-backed and Non-VC-backed IPOs………. 114
V
4.17 Impacts of VC on Long-run Operating Performance ………..………..…….119
4.18 VC Reputation and ROE1 of VC-backed IPOs ……….………...121
4.19 VC Reputation and ROE1 on Full Sample IPOs ………...………….122
4.20 VC Ranking and Operating performance ……….…………... ..124
4.21 Alternative Reputation Measurements and ROE1 ………..126
4.22 Alternative Reputation Measurements and ROE2 ………..127
4.23 VC Ranking and Operating Performance by Boards………..131
4.24 Alternative Reputation Measurements and ROE1 by Boards………... 132
4.25 Alternative Reputation Measurements and ROE2 by Boards …………...……...133
5.1 Heckman 2-step on Impacts of VC………...140
5.2 Heckman 2-step on Impacts of VC Reputation on VC-backed IPOs………142
5.3 Heckman 2-step on Impacts of VC Reputation on Full Sample………...143
5.4 VC Ranking and BHAR36………... ...145
5.5 VC Ranking and BHAR36 by Boards………147
5.6 Characteristics of VCs ………...………...154
5.7 Characteristics of Top-20 and Non-Top-20 VCs ……….…………..………..155
5.8 Characteristics of Top-50 and Non-Top-50 VCs ………..……….…...……...156
5.9 Correlation matrix of VC Reputation Measurements ………...158
5.10 Associations between Top-20 and the Other Reputation Measurements…... ...161
VI
List of Abbreviation
BHAR
Buy-and-Hold Abnormal Returns
CAR
Cumulative Abnormal Returns
CSMAR
The China Stock Market & Accounting Research
CSRC
China Securities Regulatory Commissions
ICB
Industry Classification Benchmark
IPO
Initial Public Offering
M&A
Merge and Acquisition
PE
Private Equity
Repo
Repurchase Agreements
ROA
Return on Assets
ROE
Return on Equity
SHSE
Shanghai Stock Exchange
SME
Small and Medium Sized Enterprises
SZSE
Shenzhen Stock Exchange
VII
Contents
Abstract I Acknowledgement II List of Figures III List of Tables IV List of Abbreviations VI
1 Introduction 1
1.1 IPO Market in China ... 1
1.2 The ChiNext Board ... 3
1.3 VC Industry in China ... 5
1.4 VC Reputation ... 7
1.5 Research Questions and Hupothesis ... 8
1.6 Research Contributions ... 9
1.7 Research Finding ... 10
1.8 Thesis Structure ... 11
1.9 Conclusion ... 12
2 Review of Studies 13
2.1 IPO Long-run Underperformance ... 13
2.2 Long-Run Underperformance of China IPOs ... 15
2.3 Explanations of Long-run Underperformance ... 18
2.3.1 Information Asymmetry ... 18
2.3.2 Behavioural Factors ... 20
2.3.3 Measurement Problems ... 22
VIII
2.4.1 The Impact of VC on Long-run Performance ... 24
2.4.2 VC and IPO performance in China ... 27
2.4.3 Explanations of Positive Impact ... 29
2.4.4 Explanations of Negative Impact ... 32
2.5 VC Reputation ... 34
2.5.1 Measurements of Reputation ... 34
2.5.2 VC Reputation on IPO Long-run Performance ... 39
2.6 Conclusion ... 43
3 Hypotheses, Data, and Methodology 45
3.1 Hypotheses Development ... 45
3.2 Data ... 49
3.2.1 Data Resource ... 49
3.2.2 Data Description ... 51
3.3 Methodology ... 56
3.3.1 Long-term Market Performance ... 56
3.3.2 Long-term Operating Performance ... 58
3.3.3 VC Reputation ... 59
3.3.4 High and Low Reputation ... 67
3.3.5 Variables of IPO Firms ... 68
3.3.6 A Summary of Variables ... 75
3.4 Models ... 76
3.4.1 Difference Tests ... 76
3.4.2 Regression Models ... 76
3.5 Conclusion ... 79
4 Results and Findings 81
4.1 Long-run Post-IPO Stock Performance ... 81
4.2 VC and Long-run Stock Performance ... 84
4.3 VC Reputation and Long-run Stock Performance ... 88
4.3.1 VC reputation and BHARs ... 88
4.3.2 High vs. Low VC reputation ... 92
4.3.3 The Impact of Boards ... 103
4.4 Long-run Post-IPO Operating Performance ... 107
IX
4.6 VC Reputation and Post-IPO Operating Performance ... 119
4.6.1 VC reputation and ROEs ... 119
4.6.2 High vs. Low Reputation ... 122
4.6.3 By Boards ... 129
4.7 Conclusions ... 134
5 Robustness Checks and Measuremens of VC Reputation 135
5.1 Robustness Checks ... 135
5.1.1 Models ... 136
5.1.2 Results ... 139
5.2 Measurements of VC Reputation ... 148
5.2.1 Variables and Models ... 149
5.2.2 Results ... 157
5.3 Conclusions ... 160
6 Conclusion 163
6.1 Summary of Findings ... 163
6.1.1 VC and Long-run Performance ... 164
6.1.2 VC Reputation and Long-run Performance ... 164
6.1.3 Additional Findings ... 166
6.2 Policy Implications ... 166
6.3 Limitations and Future Research ... 169
6.3.1 Limitations ... 169
6.3.2 Future Research ... 170
Appendix
171
A.1 The Background of China Stock Market ... 171
A.2 VC Industry in China ... 176
A.3 The Split-share Reformation ... 185
A.4 VC Reputation and Initial Market Performance ... 186
X
A.6 Selection Bias Issue ... 191 A.7 List of China A share IPOs and VC Companies ... 194
- 1 -
Chapter 1
Introduction
This thesis explores the impact of Venture Capital (VC) and VC reputation on initial public offering (IPO) firms’ long-run post-issue performance, based on an emerging economy like China. This market has experienced significant growth over recent decades. As the government of China strives to stimulate economic growth by promoting the development of high-tech industries, VC has been playing an increasingly vital role in assisting the success of start-up firms. China therefore provides an ideal environment for exploring the study of associations between VCs and IPO performance. This chapter first reviews the specific institutional background of the Chinese IPO market and the VC industry. After that, the research objectives are proposed followed by the conclusive summation of outcomes of this study.
1.1 IPO Market in China
IPO is the first time that a private company issues shares to investors to raise capital and thereby transfers to a public listed company. Through IPO, a firm could attract more investors, improve brand recognition, and earn generous returns. It could also benefit firms to improve their enterprise system and managerial structure. Therefore, going public is the optimal choice for private firms if they are eligible to do so. The China stock market has exhibited great expansion during the last 30 years. The number of IPO companies steadily rises every year.
- 2 -
Figure 1.1 illustrates the number of A share IPOs listed on the Shanghai stock exchange (SHSE) and Shenzhen stock exchange (SZSE) from 1990 to 20121. Generally, the IPO
market in China was vibrant. Across the 32 years, there are 2,548 A share IPOs. However, the number of IPOs fluctuates in this period. For instance, in 1996 and 1997, China approved more than 200 IPOs in each year, but in 2005 there were only 15 new-issued firms2. With the establishment of ChiNext board3 on Oct 30 2009, the number of IPOs
soared to 349 in 2010, 282 in 2011, and 155 in 20124.
Figure 1.1 Distributions of A share IPOs from 1990-2012 by SHSE and SZSE.
Comparing the IPO frequencies by exchanges provides additional insight into the development of the China stock market. From 1990 to 2004, the SHSE took the leading role and had more IPOs than SZSE for most years. From 2001 to 2003 only one IPO was
1 A more detailed discussion of China stock can be found in section 3.
2 This was because from the May 2005, one year after the establishment of SME board (May 2004), the CRSC suspended the process of IPO after the SME board accomplished the 50th IPO case. Meanwhile, the whole market was dedicated into share-split reform during this period. Eventually the IPO market resumed in May 2006.
3 This is a Nasdaq-type board, especially for start-up firms to get listed.
4 The IPO market was suspended from Oct 2012 for the second period of adjustment. It reopened 14 months later in Jan 2014.
- 3 -
issued on the SZSE, while there were 212 on SHSE. However, the situation reversed since 2005, the total number of IPOs listed on SZSE was about 7 times more than on the SHSE. This reversal was mainly due to the launch of the SME in 2004 and the ChiNext board in 2009 on the SZSE, respectively. These two boards provide opportunities for small- and medium-sized and great growth potential firms to raise funds for further development. Thus, there is a huge and growing number of IPOs on the SZSE on account of the expansion of privately-own enterprises in many emerging and non-traditional industries. The apparent drop in the number of IPOs on the SHSE is also because of the new listings were halted for 11 months between 2005 and 2006 and 10 months between 2008 and 2009. This makes the Main board IPOs more tough and strict.
1.2 The ChiNext Board
It is obvious that the ChiNext board has played a very important role in China’s IPO market and the continued development of the China stock market. Nearly all the mature capital markets possess a second board, e.g. the Nasdaq of America, AIM of UK, Jasdaq of Japan, and the GEM of HK, etc. A Second board is an indispensable segment of an integrated stock market, and the establishing of the ChiNext board has symbolized the beginning of multi-level capital market in China.
The existence of ChiNext board provides a number of advantages. First of all, it incentives and encourages venture firms’ operation and development. Once listed on the ChiNext board, IPO firms will face a more efficient financial system and structure and more strict regulations, under which the raising and spending of money become more transparent, thereby avoiding abuses such as black-box operations. Besides, it can stimulate the entire venture industry, because to VCs IPO is the best way to liquidate their investments and accelerate capital turnover speed. The ChiNext board is well designed for the development of VC. A great number of studies have shown that VC is of great importance to the development of small and medium sized and innovative firms. Thirdly, the ChiNext board is mainly designed for the domestic growth start-ups, emphasising support for firms with creative independent intellectual property rights, good prospects, and positive employment opportunities5. It generates more opportunities for venture firms to go public. While being
5 In particularly, it prefers to support burgeoning industries such as New Material, New resources, IT, Medical Biotechnology, Energy-conserving and Environment-protective, and Morden Service, etc.
- 4 -
different with the western second board, the ChiNext is not limited to the IPO of high-tech venture firms but is available for other industries.
Table 1.1 displays the notable contribution the ChiNext board has made to the China stock market, by comparing the number of IPOs and the total IPO market capitalizations from 2009 to 2012. In 2009, 36% of IPOs were listed on the ChiNext board, while in 2012 the proportion rose to 47%. Such trend is also applicable to the total IPO market capitalizations. For instance, in 2009, the 36 ChiNext board IPOs only contributed to 6.67% of the total IPO market capitalization, but in 2012, the ChiNext board IPOs contributed to 39.63% of the total IPO market capitalization.
Overall, the data proves that ChiNext has become an increasing vital component of the China stock market. It is particularly meaningful to the small and medium size growth enterprises as this board promotes the integration of technology, knowledge and capital, the transformation from ideas to physical products. More strikingly, it is an ideal place for VC investments to exit.
Table 1.1 IPO Frequency and Market Capitalization of ChiNext
IPO Numbers Market Capitalization
ChiNext Full Market % ChiNext Full Market %
2009 36 99 36.36 1,610.08 24,150.37 6.67
2010 117 349 33.52 7,365.22 25,693.44 28.67
2011 128 282 45.39 7,433.79 20,730.30 35.86
2012 74 155 47.74 8,731.24 22,029.41 39.63
- 5 -
1.3 VC Industry in China
The founding of American Research and Development Corporation in 1946 is treated as the birth of the modern VC industry6. Since then, VC has attracted the world’s attention
due to its ability to produce enormous rewards. VC is a major impetus for the global development of high-tech industry, and it has been supported by governments in most countries. Generally, VC is acknowledged as a specialist-managed capital investment form. However, there is still a lot ambiguity in the standard definition of VC. According to the US National Venture Capital Association, VC is defined to be one kind of private equity that targets the investment towards the enterprises that have high potential, high growth rate and dramatic competing strength. The European Venture Capital Association emphasises the particular behaviour of VC investment, i.e. VC investors do not only offer capital, but also get involved in the management and operation of the funded firms.
The definition of VC varies with the development of the VC industry. In the early years, VC was associated with the early stage investment in high-tech firms, i.e., seed and start-up. Nonetheless, VCs have gradually extended their investment range beyond this narrow sense. An increasing number of VCs started to step into projects at the expiation and mature stages, and also attempted to widen their business to more traditional industries. Consequently, a broader concept of VC now appears to be more appropriate - all the capital investments towards pioneering, innovative and creative projects could be defined as VC investment. In fact, this description is more acceptable in Europe and Asia, for example, the British Venture Capital Association recognizes VC investment as an equity investment to unlisted UK company.
In recent years, the broad sense of VC has been gradually replaced by an even broader concept - private equity (PE). A PE investment is a private investment form which purchases equity stakes of unlisted companies or the non-tradable equities of listed companies. Generally speaking, VC is a subsample of PE which targets early stage investment. Even though VCs and PEs have diverse investment preferences, they both are pre-IPO equity investments aiming at long-term capital appreciation. Besides, in addition to money, they both provide services to venture firms that are contributable to the business expansion, new-product development, operations and management efficiency. In fact, boundaries to separate VC and PE are more and more unclear currently. A few specialized
6 In 1957, ARD invested $70,000 to the Digital Equipment Corporation; while later in 1971, the market value of DEC had grown by more than 5000 times and reached up to $3.55 billion, which ballooned investors’ values dramatically.
- 6 -
PE institutions participated in VC projects, while many VCs have also intervened in the business activities of PEs.
VC was introduced to China in 1980s7, and it has experienced enormous growth with
the support of Chinese government. In China, VC is primarily defined as equity investment into the high-tech, high growth rate and high potential start-up firms, but not limited to the early stage investments. It is crucial to mention that there is no strict distinction between VC and PE in China. These two terms are often reported or presented together as VC/PE. Generally, any equity investment into the unlisted companies by the VC/PE firms all are classified into the equity investment category. Indeed, VC and PE institutions are frequently stepping into each other’s business scope. For example, the traditional PE like Carlyle Group also conducted many VC investments (Ctrip, Target Media). In this research, all the IPOs invested by VC and/or PE institutions are classified as the VC-backed IPOs.
Figure 1.2 Distribution of VC Quantity and Gross capital Raised.
Figure 1.2 illustrates the 20-year development of Chinese VC industry from 1994 to 2012. From the table, it is clear that before 1999 VC in China developed at a very low pace. The quantity of VC institutions and the scale of capital raised were hovering around low
7 The first VC institution, “Chinese New Technology Venture Capital Corporation”, in China was established in 1985, which is sponsored by State Scientific and Technological Commission and People’s Bank of China.
- 7 -
levels, and the usage of fund was less efficient at this stage. With the expansion of global economy across the world in the late 1990s, VC played a prominent role in pushing the technological innovation and economic growth in China.
In spite of being influenced by several global economy cycles, the VC industry in China experienced steady growth. During this period, there was a great demand for funding as a large number of enterprises were established under the prosperity of high-tech knowledge-based industry. Given the issue of several encouragement policies, the launch of SME and ChiNext boards, and the participation of overseas VC funds, VC has developed considerably in China. In 2012, there were 942 VC institutions raising totally 331.29 billion yuan, an increase of 547% compared with 2000. The total investment amount reached 235.51 billion yuan and the average investment amount in each project reached 13.23 million yuan. China’s VC industry is not only vital for capital market growth, but also accounts for a large share of China’s IPO market.
1.4 VC Reputation
Reputation is recognized as a unique, cumulative, irreplaceable and comprehensive asset which is formed imperceptibly throughout the life span of a firm (Barney, 1991). According to Fombrun (1996, p.72), “reputation is a perceptual representation of a company's past actions and future prospects that describe the firm's overall appeal to all its key constituents when compared to other leading rivals”. Commonly, reputation has been affirmed as one of the indicators to distinguish a firm’s quality. The benefits that reputation generates could be enormous. A good reputation carries a signal of reliable and experience to the investors and consumers. One may also regard firms which cooperate with reputable firms to be of higher quality too.
The above definition of reputation is completely applicable to VC firms. Reputation is of great importance to VC firms, since it could reflect the competitive advantages and qualities of VCs (Dimov et al., 2007). Given their unique characteristics as financial intermediaries, VCs are the bridge to connect capital and investment opportunities. Nonetheless, in such a competitive industry, it is difficult for VCs to raise funding and select the ‘right projects’. Raising capital, as well as the ability to identify better projects would be much easier for a reputable VCs. Moreover, reputation is not only crucial to VCs, but also essential to the firms funded by VCs.
- 8 -
The measurement of VC reputation has attracted great academic attention because there is no explicit measure for it, given its nature (i.e. an intangible asset). Hence, there have been many studies (e.g. Shu et al., 2011, Cho and Lee, 2013 and Barry and Mihov, 2015) on the exploration of how to measure VC reputation, and how well can different measurements capture the true effects of VC reputation.
1.5 Research Questions and Hypotheses
A majority of studies find that VC-backed firms exhibited superior post-IPO performance in the long-term than the non-VC-backed IPO firms due to VC’s function of Certification, Screening and Monitoring (e.g. Lahr and Mina, 2012), as well as Value-added functions (Croce et al., 2013). On the contrary, another group of studies also found that VCs display a negative impact on IPO firms’ long-run performance. The inferior performance of VC-backed IPOs is suggested to be the consequences of the Adverse Selection between VCs and the portfolio firms (e.g. Rosenbusch et al., 2013) and VCs' Grandstanding behaviour (e.g. Hsu, 2013). Therefore, our first research question is to whether VC-backed IPOs experience significantly different long-term performance pattern than the non-VC-backed IPOs in China. This research question is addressed by formally testing the following hypothesis: H1. The VC-backed IPOs exhibit significantly superior long-run performance than the non-VC-backed IPOs in China.
In the course of investigating the performance of VC-backed IPO firms, a few studies have been carried out focusing on the properties which are unique to each VC, e.g. the reputation. However, the results are not conclusive. On the one hand, a few studies have verified that reputable VCs are more experienced in selecting projects and nurturing promising companies. Hence, it is more likely for reputable VC-backed firms to develop rapidly and became successful, and VC reputation is concluded to be positively associated with IPO firms’ long-run performance (e.g. Lahr and Mina, 2012). On the other hand, some studies suggest a negative impact from less reputable VCs (e.g.Rosenbusch et al. 2013). Therefore, the second question of this thesis is to understand whether VC reputation exerts a significant impact on the post-IPO long-run performance in China. This question is addressed by formally testing the following two hypotheses: H2. VC reputation exhibits significantly positive impact on the long-run performance of IPOs in China; and H3. High
- 9 -
(Low) VC reputation exhibits a positive (negative) impact on the long-run performance relative to the non-VC-backed IPO in China.
In general, this body of research usually focuses on the developed markets like the US and UK. China has shown significant economic growth since the 1980s. Due to the significance and intangibility of the reputation to every financial institution, it is a considerable task to test how VC’s reputation accounts for their effects in such a specific market. However, to the best knowledge of this research, studies that explore the impact of VC reputation on China IPO market still needed to be enriched. The last two decades have witnessed the success of VC investment in China. The quantity of VC-backed IPOs has grown up sharply in China and a large population of them are listed on the ChiNext Board. Therefore, the third question is whether VC/VC reputation exerts an exceptional impact on the ChiNext board IPOs. This question is answered by formally testing the following two hypotheses: H4. VC exerts significant impacts on post-IPO long-run performance for firms listed on the ChiNext board market and/or Main board market in China; and H5. VC reputation exerts a significant impact on post-IPO long-run performance for firms listed on the ChiNext board market and/or Main board market in China.
1.6 Research Contributions
This thesis contributes to the literature in several aspects.
1. This thesis examines both the post-IPO long-term stock market performance and operating performance in the context of China and finds that VC-backing/VC reputation plays different roles on China IPOs’ long-run stock market and operating performance. 2. This thesis makes improvement on the measurement of long-run performance as
buy-and-hold abnormal returns. The thesis construct IPO-specific portfolio as the bench mark to each IPO firms, in order to precisely estimate the abnormal returns. More specifically, for each IPO firm, the portfolio consists of firms with M/B ratio and market capitalization both being no smaller than and no larger than the corresponding values of the IPO by 25%.
3. This thesis acknowledges the wide range of possible metrics that can be used for measuring reputation and examines the importance of metric choice on the performance measurement outcomes. In particular, a special feature of the reputation used in this
- 10 -
thesis is the use of a real-world and market-based ranking measure for VC reputation created by the Zero2IPO Research Group for the China market, which is more multifaceted than many of the traditional proxies for reputation used in earlier studies. 4. According to the specific institutional background of China stock market, this thesis
also examines the impact of VC reputation (by high and low) on the long-run IPO performance across different boards, i.e. the Main, SME and ChiNext boards.
1.7 Research Findings
From the analysis of stock market performance, this thesis finds that the 36-month Buy-and-Hold Abnormal Returns (BHARs) of VC-backed IPOs are significantly superior to the non-VC-backed IPOs. VC-backed IPOs are significantly older, exhibit lower initial returns, and own less state-owned equity stakes than the non-VC-backed IPOs. What is more, the analysis with VC reputation generates several findings. Firstly, VC reputation does not act as a significant role in identifying variations of VC-backed IPOs' post-IPO long-term returns. Compared to the non-VC-backed IPOs, both IPOs funded by more reputable VCs and those funded by less reputable VCs display significantly better performance. Although the positive effects of more reputable VCs are stronger, the preponderance is not very notable. Examining across different boards, the above reputation effects of VCs are only significant on the non-main-board IPOs. This indicates that the impact of VCs on China stock market performance is driven principally by the impact on smaller firms with high growth potential.
However, the analysis of long-run post-IPO operating performance illustrates that VC and VC reputation unlikely exerte on the stock market performance. The ROE reduction is serious across all the IPOs in China over the three years after flotation, whereas VC-backed IPOs do not demonstrate any significant benefits. Neither the reputable nor the less reputable VCs are found to have a significant impact on the three-year’s post-IPO ROEs. Moreover, the examination by boards also fails to catch any significant impact of VC reputation on the operating performance.
Overall, this thesis finds that VC-backing and VC reputation have a significant positive impact on year’s post-IPO stock market performance but no impact on the three-year’s operating performance at all. Why such results? One explanation is that the stock
- 11 -
returns are ‘forward-looking’ indicators which integrate the expectations of investors, while the accounting data used for calculating operating performance are primarily ‘backward-looking’.
The stock prices can easily fluctuate as investor sentiment towards the firms’ expected returns alter. In accordance with the Certification hypothesis, the involvement of VC is a symbol of good quality and high growth potential. Therefore, the superior stock prices of VC-backed IPOs might be because of investors’ positive attitudes to the future prospects. By the same token, even if VCs completely exit, investors still incline to be more optimistic about IPOs, given that they had been labelled as VC-backed. The operating performance measure are backward-looking accounting-based indicators which reveal current and past performance. Hence, when VCs leave the IPO firms and the guidance and service terminates, their impact on firms’ operations terminates. In this sample, a large number of VCs completely exit the IPO firms after 12 months of floatation, meaning that using the three-year’s post-IPO period may not be sufficient to capture the exact impact of VC/VC reputation. The lack of significance of VC reputation on operating performance might, in part, be the result of this limitation.
The robustness of the above findings is examined by using the Heckman Two-step model which controls the selection bias of VC investors. The empirical results demonstrate consistent effects of VC/VC reputation. The associations between the various measurements of VC reputation are then explored. These reveal that measures used in the prior studies are far from being perfectly correlated and this may explain why some prior studies generate conflicting findings.
1.8 Thesis Structure
The structure of this study is as follows. Chapter 2 presents the literature review of IPO long-run performance and the impact of VCs on long-run performance. Summaries of the studies of VC reputation have also been included in this Chapter, including the functions and the measurements of VC reputation. Chapter 3 introduces the institutional background of China’s stock market and the development of the VC industry in China across the 20 years. Following the discussion from the previous chapters, Chapter 4 develops hypotheses, designs the empirical models and explains the methodologies for this thesis. The descriptions of the IPO dataset are presented in this Chapter as well. Chapter 5 first reports
- 12 -
the results of the empirical models that are put forward in Chapter 4 and then discusses the findings. Chapter 6 presents additional analyses including robustness checks of the above results and the associations between various measurements of VC reputation. Finally, Chapter 7 presents the concluding remarks. In chapter 7, the results of this thesis are summarised and implications to the VC investors, venture entrepreneurs, and the policy makers in China are discussed. Finally, the limitations of this thesis are explained, together with proposals for future studies.
1.9 Conclusions
This chapter introduces the IPO market and VC industry in China. VC has been playing an increasingly vital role in China. Therefore, China therefore provides an ideal environment for exploring the study of associations between VCs and IPO performance. The chapter then describe ChiNext, which has played a very important role in China’s IPO market and the continued development of the China stock market. This suggests that to study the influence of ChiNext on the impact of VC-backing and VC reputation is important in China. Moreover, the chapter describes the research questions, and demonstrates how they are addressed and linked to the main research hypotheses. Furthermore, the research contributions are clearly illustrated. Finally, research findings and the structure are described.
- 13 -
Chapter 2
Review of Prior Studies
This chapter summarises prior studies regarding the research questions described in the previous chapter. Firstly, the chapter reviews the studies on the IPO long-run performance. For the purpose of raising large amounts of capital to expand their business, going public has become the optimal goal for most companies. However, going public does not guarantee perpetual success. Maintaining promising performance is essential, otherwise firms might be suspended or delisted from the exchange. An overwhelming majority of studies have found IPO firms’ post-issue performance during the three to five years are significantly weaker than the listed firms that have been traded for years. Then, the paper reviews the studies on the role of VC and VC reputation in the IPO long-run performance. Since the measurement of VC reputation is one of the main contributing claims in this thesis, this chapter also summarizes the studies on the measurement of VC reputation.
2.1 IPO Long-run Underperformance
IPO long-run underperformance after the issue of IPO has been documented in the literature. This section will review these studies and the explanations of this phenomenon.8The long-term post-issue underperformance of IPO firms have been found in a great deal of studies. For example, Ritter (1991) examines the buy and hold abnormal returns (BHARs) during
8However, there are some exceptions of long-run outperformance. For example, Kim et al. (1995) using 169 firms listed on the Korea Stock Exchange during the period 1985–1989 find that the Korean IPOs outperform seasoned firms with similar characteristics. Ahmad-Zaluki et al. (2007) using 454 Malaysian IPOs during the period 1990 to 2000 and find significant outperformance for equally-weighted event time CARs and buy-and-hold returns. Michel et al. (2014) also find positive abnormal returns after IPO using a sample of 1801 IPOs that occurred between January 1996 and December 2006. Bird and Yeung (2010) find that Australian IPOs over performed by 12%.
- 14 -
the three years’ post-issue period of 1,526 IPOs listed on the US market from 1975 to 1984. Compared to the controlled listed stocks one-to-one matched by market value and industry, the three-year’s BHARs of the sample IPOs significantly underperformed by 27.39%. Such findings indicate that investors would lose money by buying and holding shares of companies that recently accomplished the IPO. The post-IPO underperformance pattern has also been found by Loughran and Ritter (1995) based on an even larger sample which contains nearly 4,753 US IPOs listed between 1970 and 1990. Their results claim that investing in IPO firms is hazard for investors’ wealth. The post-issue five years’ average annualized return of IPO firms only 5%, which is significantly lower than the same period returns of the matched non-listed firms (11.8%). Alternatively, IPO firms’ five-year’s BHARs are -50.7% and -41.6% relative to the matched non-listed firms by size and the value-weighted market index, respectively. Their results give further support to the prior evidence of long-run underperformance. Brau et al. (2012) using 3,547 IPOs from 1985 through 2003 find that the mean 3-year style-adjusted abnormal return is negative at 15.6%.
Inspired by Ritter’s work, a large number of studies was conducted to explore the long-run post-IPO performance, and most of them are based on the US market (see for example, Ritter and Welch, 2002; Krishnan et al., 2011; and Hoechle et al., 2018). In general, those studies extensively acknowledge that the new issued companies underperform the companies that have been listed on the stock market for many years, i.e., their post-IPO performance, for a period of 3 or 5 years, are significantly lower compared with matched companies or the market index. For example, Loughran (1993) expands Ritter’s study (1991) and further explores the six calendar years’ post-IPO performance on a larger sample (3,656 IPOs) during 1967-1987 from the Nasdaq Market. His result demonstrates that the average six-year’s post-IPO returns considerably underperform the equally-weighted market index, i.e. the returns are 17.29% vs. 76.23%. Meanwhile, the wealth relative mark is found to be 0.666, which is even smaller than that in Ritter’s study (0.831). Jain and Kini (1994) examine the operating performance of 682 US IPOs from 1976 to 1988, measuring by ROA and operating cash flows over the total assets. Compared to the one year pre-IPO level, the post-IPO operating performance dropped dramatically after five years of floatation. Their finding is in line with the view of Pagano et al. (1998) that the post-IPO reduction in profitability results from the window of opportunity hypothesis. Krishnan et al. (2011) also finds that the abnormal returns are negative, especially for the IPOs that are not backed by VC. Hoechle et al., (2018) using a sample of 7,487 U.S. IPOs between 1975 and 2014 continues to find significant underperformance.
- 15 -
The post-IPO underperformance has found to be a worldwide manifestation. It is not only identified in US markets but also in the other developed markets such as UK (e.g. Espenlaub et al., 1999; Espenlaub et al., 2000; Coakley et al., 2007). Levis (1993) computes the 3-year’s post-IPO returns on 712 IPOs listed on the London Stock Exchange from 1980 to 1988, choosing three different market indexes as the benchmark. The IPOs exhibit significantly inferior returns by 23% relative to the market index. Then Espenlaub et al. (2000) enhance the measurement of long-run post-issue returns in Levis’s study by adopting several additional benchmarks and models. Consistent with the previous literature, their three-year’s post issue operating performance (measured by ROA) display a significantly decline compared to that one-year pre-IPO level. Coakley et al. (2007) using around 590 UK IPOs from 1985 to 2003 and find significant underperformance during the 1998–2000 bubble years. Gregory et al. (2010) provides a more recent study of the IPO performance in UK market. They use a sample of 2499 firms issued from 1975 to 2004 and find a significant underperformance of IPOs, e.g. a negative 16.4% 3-year BHARs relative to the weighted size-matched portfolios. Studies based on the non-US/UK markets also support the underperformance pattern. For instance, evidence is found in Germany (Ljungqvist, 1997; Derrien, 2005), Italian market (Pagano et al., 1998), Australian (Rosa, 2003 and Suchard, 2009) and French (Boissin and Sentis, 2014). For example, using various methodologies, Boissin and Sentis (2014) find that IPOs in their sample performed poorly relative to the comparison portfolios over the 1991–2005 horizon. Furthermore, such underperformance not only exists in developed markets, but also takes place in developing markets. For example, Agathee et al. (2014) focus on the African market. They examine the long-run performance of initial public offerings on the Stock Exchange of Mauritius and show that the 3-year equally weighted cumulative adjusted returns average is negative at 16.5%.
2.2 Long-run Underperformance of Chinese IPOs
In recent years, China’s capital market has been a superstar in attracting VC financing. However, due to the relatively late start point of the stock market (in 1990s), there are still various studies that explore the China IPOs’ long-run performance.
Although the Chinese stock market was established much later than those in the developed countries, it generally follows the similar pattern of the post-IPO long-run
- 16 -
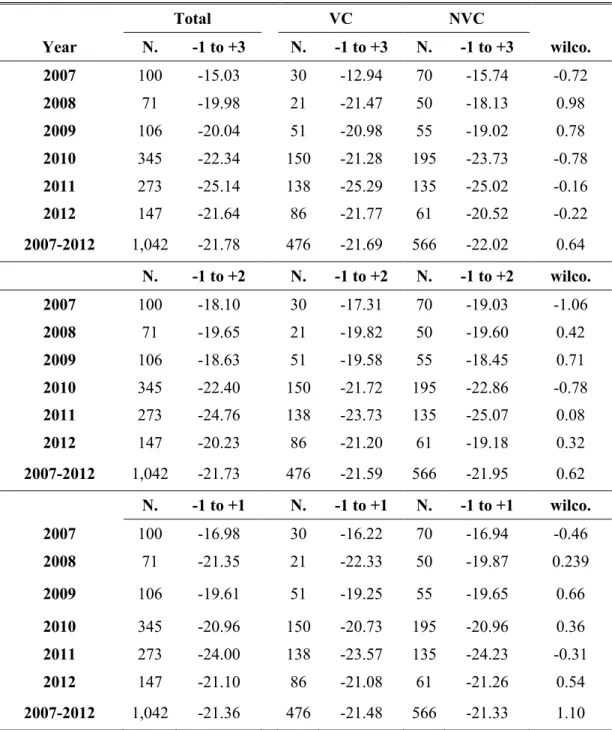
underperformance as well.9 For example, using of IPO firms from 1992 to 1995, Chen et al. (2000) find that the BHARs (relative to market returns) of China IPOs exhibit a continually declining trend in the long-term and their BHARs become substantially negative at 212% at 3 years after IPO. Cai et al. (2008) using IPOs listed on China’s Shanghai Stock Exchange from 1997 to 2001 find that three-year post-IPO BHARs are negative at 29.6%, indicating a significant underperformance. Primarily, studies of VCs in China derive from prior studies on the US market. With the sample covering period after 2000, the results are also consistent. Su and Bangassa (2011) report that their sample of 590 China A share IPOs during 2001-2008 exhibit significantly negative 36-month market-adjusted BHARs is (-21.74%). Liu et al. (2012) also find that the 3-year buy and hold returns (BHRs) of 627 IPOs during 2000 to 2007 are found to be significantly lower than the matched IPO firms by size and B/M ratio, and are negative (-0.447), confirming the underperformance of China IPOs.10
The findings of underperformance are sensitive to the method of calculation and measurement. For example, Su et al. (2011) provide a piece of evidence with 936 A-share IPOs during 1996-2005 based on a set of more rigorous methods. More specifically, the abnormal returns of sample IPOs are based on matching size and industry IPOs: the equal-weighed three-year BHARs significantly outperform the benchmark primarily owing to the better performance of small-sized IPOs, whereas the value-weighted BHARs are much lower and do not show any significantly difference. At the same time, the three-year CARs show no significant difference either calculated in terms of equal-weighted or value-weighted metrics. When using the market index as the benchmark, the sample IPOs are found to exhibit significant negative underperformance both for the BHARs and CARs. Finally, the sample IPOs do not show any significant performance differences if using calendar-time approaches, i.e. the CAPM and Fama-French three-factor model.
Given the robust pattern of underperformance in China, some studies aim to find some China-specific factors to explain the pattern. For example, Cai et al. (2008) find that government retained shareholdings, the allocation success rate, the post-IPO earnings
9 There are also expectations. For example, Chen et al. (2004) find that in the long run, the 36-month BHARs of A share IPOs are not significantly different with the matched firms by using size and B/M ratio. Like Chan et al. (2004), Chang et al. (2010) claim that the 36-month post-IPO BHARs only slightly underperform (-7.8%) the benchmark IPOs, using a group of China A share IPOs listed from 1993-2004. The calendar-time regressions (performance adjusted by the Fama-French three-factor models) present mixed results while there is no significant underperformance for regressions on the full sample IPOs.
10 Wang (2005) finds that the post-IPO operating performance also exhibits sharp declines in the long-term post-IPO compared to the pre-IPO level, e.g. the industry adjusted ROA and sales to asset declined significantly from 4.41% to 0.45%, and 26.92% to 1.35% three years before and after IPO, respectively. Generally, this finding is consistent with the prior research that China IPOs experience substantial underperformance in the long-run.
- 17 -
growth rate and whether the IPO firms also issue B-shares all exert significantly positive impact on both the long-run BHARs. Besides, in accordance with expectations, factors such as the underpricing level, pre-IPO earnings and whether the underwriter and referee are the same institution are all negatively and significantly related to the IPO long-run performance. However, the offering size seems to be negatively associated with the long-run performance, which runs contrary to the traditional assumptions since large offering size firms are supposed to receive more funds for development. Another explanation is provided by Chen et al. (2004), suggesting that firms have the intention to window dress their financial status before IPO, which leads to the overestimation of firms’ true value at the time of IPO. However, their true values are revealed in the post-IPO period and shows underperformance. Chang et al. (2010) find that the aftermarket P/E ratio and board size are negatively associated with long-run performance. They also find that underwriter reputation exerts positive impact on the performance, which is consistent with the statement that prestigious underwriters lessen the uncertainty and information asymmetry surrounding IPO pricing. This finding is also consistent with Su and Bangassa (2011).
Due to the unique characteristic of the China stock market during its early period, i.e. nearly all IPO firms are transformed from SOEs, various studies focus on the ownership and political connection to explain the long-run performance of China’s IPOs. On the one hand, it has been found that state ownership seems not important to affect the long-run performance. For example, Chang et al. (2010) and Su and Bangassa (2011) find that state ownership shows no significant influence on the long-run IPO performance, which is consistent with Sun (2003) and Wang (2005). As argued in Wang (2005), the lack of significance of ownership types might be because the negative influence of government intervention is offset by the benefits associated with government connections.
On the other hand, political connections have exhibited significantly positive impact on the long-run performance. For example, Liu et al. (2012) shows that the three-year BHARs of IPOs with political connections are significantly larger than their counterpart IPOs. In particular, for the size-matching and B/M-matching, the IPOs with political-connected CEOs outperform the IPOs without political-connected CEOs by 18% and 20.5%, respectively. This mechanism behind the results is that firms which have connections with government have better access to benefits such as bank loans, resources, advantages in particular industries, and more financial credits (e.g. Tian, 2001; Wang, 2005 and Francis et al., 2009). Wu et al. (2012) and Wu et al. (2013) also find similar results. The former paper shows that the political connections have a positive effect in assisting private firms
- 18 -
attain tax benefits, while they do not exert this effect in SOEs. On the contrary, the fully government-controlled firms, i.e. the SOEs, suffer from serious over-investment problem, which are found to be detrimental to the long-term performance. The latter shows the central government connected IPOs display significantly better performance (raise more net proceeds), than the non-political-connected IPOs, whereas the regional government connected IPOs do not show a significant difference. However, the effects of political-connection differ in regions of different market conditions. The positive impact of central-government connections will be weakened in those regions with high market restrictions but strengthened in the regions that are industries regulation-oriented.
2.3 Explanations of Long-run Underperformance
The fact that IPO firms perform poorly in the long run after floatation is a consistent finding across markets with different institutional backgrounds (e.g. the stock market regulations, corporation laws, and taxation system, etc.). Therefore, a rational explanation for this universal anomaly is necessary. This section briefly explains some explanations in the literature. Generally speaking, the explanations could be interpreted from three sides.
2.3.1 Information Asymmetry
It is widely acknowledged that in all stock markets, information is unevenly distributed, and that information asymmetry existing between the issuing firms and external investors. As the side that have information superiority, issuers usually hold more information about the IPO firm. By contrast, the only way external investors get to know an IPO firm is from the information publicly disclosed in the IPO prospects. Consequently, this could possibly lead investors to make wrong investment decisions. Deriving from the theory of asymmetric information, several hypotheses have been proposed to illuminate the long-run weak performance of IPOs, including signalling, principal-agent/agency cost theory, and window dressing.
The signalling theory (Welch, 1989) was initially used to explain the underpricing puzzle, which demonstrates that underpricing is a signal of firms’ quality. The rationale of this theory is that the issuer is perfectly informed about the value of the firm but investors are uniformed. For the purpose of mitigating information asymmetry and differentiating from less qualified firms, high quality firms are willing to set low issuing prices at IPO.
- 19 -
Unlike the lower quality firms, high quality firms are able to afford the cost of underpricing in the seasoned equity offerings (SEOs). Therefore, more underpriced IPOs, or higher quality IPO firms, should be associated with higher operating performance and higher stock market returns in the post-IPO long-term period (Levis, 1993; Ljungqvist et al., 2006).
The Agency Cost Theory stems from the proposition that there are conflicts of interest between firm managers and shareholders (Jensen and Meckling, 1976). In order to achieve the largest profits, the former tends to invest the money, either gained from the stock issuing or spare cash flows, to some inferior projects at the expense of shareholders’ profits. During the process of IPO, as firms sell shares to the extensive external investors the ownership concentration of the management team lessens and the agency costs increase, thus leading to the reduction of managers’ incentives. Accordingly, the post-issue performance of firms will decrease, attended by the downward adjustment of the new shares’ intrinsic value. Therefore, the weak performance is observed in the long-run. Nevertheless, this theory only has mild support from the empirical evidence. Mclaughlin et al. (1996) propose similar ideas as the divergence of interests, finding that quoted companies which hold more cash flows exhibit a decline in their long-run performance. Mikkelson et al. (1997) state that the more the managers disperse their stakes at IPO, the worse the aftermarket operating performance. While Cai and Wei’s (1997) study based on the Japanese market could not provide support for the ownership effect on the long-run stock profitability.
Given the difficulties to meet the listing financial requirements and the heavy reliance on the disclosed information, applicant firms may be tempted to manage their earnings, i.e. window-dressing. For investors, historical information on the issuing firms is essential. Generally, investors are able to evaluate the risk and returns through the extensive analysis of the historical information, and accordingly they make investment decisions. Since outside investors have access to limited information, they have no choice but to rely on the IPO prospectuses which report firms operating information in the last three years, especially for recently established firms (DeGeorge and Zeckhauser, 1993). Window-dressing means that the accounting numbers (e.g. accruals) are manipulated in order to make firms’ pre-IPO financial performance meet the requirements and be attractive enough to investors (Dechow and Skinner 2000). This manipulation is also called “window-dressing” and such behaviour leads to an overstatement of pre-IPO operating levels and understatement of post-IPO operating levels. In the long-run, firms’ performance will converge to its intrinsic value, IPOs will exhibit obvious underperformance. Rangan (1998) concludes that there is a significant negative relationship between earnings management
- 20 -
and the post IPO long-run performance. Teoh et al. (1998) demonstrate that the more serious the manipulated earnings, the worse the post-IPO long-run performance.
2.3.2 Behavioural Factors
Through the extensive detection of IPOs’ underperformance, Ritter (1991) proposes the explanation from the perspective of behavioural finance. In a similar vein, a number of studies have also found that the long-run performance puzzle is attributed to irrational investor sentiments, i.e. investors may either be systematically overoptimistic about the prospects of IPO firms or was overreact to the disclosed information on the IPO market. Nevertheless, as time passes and more information is disclosed, the true value of stocks will be exposed. The investment passion of overoptimistic investors will fade away, leading the stock prices approaching their true level. Therefore, the behavioural finance theory suggests that it is the irrational investor sentiments and behaviour which cause long-run underperformance (Loughran et al., 1994; Loughran and Ritter, 1995; Pagano et al., 1998). The explanations could be systematically divided into three types: heterogeneous expectations, impresario hypothesis and windows of opportunity and fads.
The hypothesis of heterogeneous expectations denies the homogeneous expectation hypothesis proposed by EMH, suggesting that there are two types of investors in the secondary market, the optimistic ones and pessimistic ones. Investors exhibit heterogeneous expectations: different investors have disparate anticipations to listed firms’ further cash flow and potential growth rate. Miller (1977) first tries to adopt this opinion to explain the long-run weak performance. He stresses that investors anticipate the new issuer’s value based on their own information and they always give excessive trust to this information (Daniel et al., 1998). Confident investors are more likely to be the purchaser of stocks issued by IPO firms. Due to the uncertainty of the stock value, the pessimistic investors’ evaluation will be lower than the optimistic ones. That is to say, the offering price of IPO is determined by the most optimistic investors who will pay much more than the true value, leading to highly irrational underpricing. Since there will be more accessible information for the stocks in the long-run, the divergence of expectations will be lessened. The prices will unavoidably adjust downwards, resulting in weaker post-IPO long-run performance. In short, the greater is the difference in expectation, the higher the underpricing, and consequently, the poorer the long-term performance. However, a problem with this hypothesis is that, with the increasing evidence of long-run weak
- 21 -
performance, even the optimistic investors would suspicious about whether the new issues were worth such high prices. So, whether this theory is the best way to find the key of long-run underperformance puzzle remains to be seen. The problem with this theory is that it is not easy to find a sound way to proxy for investor sentiment and expectations.
The impresario hypothesis is put forward by Shiller (1990), suggesting that whether the issuing is successful or not, and how many shares are sold, both exert impact on the reputation and commission incomes of investment banks. In order to have a smooth IPO process, the investment banks act as the role of ‘Impresario’ when making up and promoting the new issue firms. These investment banks, also called underwriters, will always publicize the new shares (often via a low offer price) in order to create the illusion of excess demand. The large amount of uninitiated investors will then rush to buy shares at IPO, so that the initial stock prices are hyped. But the intrinsic value of the stocks will appear as time goes by and so stock prices will go back to their fundamental values. This hypothesis stresses that there is a negative relationship between the initial underpricing ratio and the long-run performance.
The definition of windows of opportunity is that there is a short time period during which an otherwise unachievable opportunity exists. The good opportunity will disappear when the window ends (Loughran and Ritter, 1995). Applying to the long-run performance puzzle, it is also called ‘The Timing Hypothesis’ (Baker and Wurgler, 2002) whose premise is that issuers tend to issue new shares at the peak time of enterprise development or at the time when investors are overoptimistic about the prospects of the firms (Aggarwal and Rivoli, 1990). Inherent in such views is a conflict of interest in which insiders take advantage of outsiders. In other words, for a particular time period, investors tend to fix their minds on the new issues when underwriters concentrate to issue stocks on the bull market, which will lead to the overvaluation of the new issued shares. This fad activity causes incredibly high demands in the short period after IPO, but simultaneously pushes the pessimistic investors to sell their stocks, thereby causing the long-run underperformance (Daniel et al., 1998). Many studies have shown that the IPOs during ‘hot markets’ are more likely to perform worse in the long-run (Helwege and Liang, 2004; Derrien, 2005; Ljungqvist et al, 2006), supporting the previous statements that investors only feel optimistic about the invested firms for a short period. As a result, investor sentiment becomes the main factor that drives the stock prices to a high level. However, this hypothesis is questioned by Habib and Ljungqvist (2001) who establishes an excess
- 22 -
expectation model which argues that the IPO long-run underperformance is an equilibrium phenomenon, denying the rationality of windows of opportunity.
2.3.3 Measurement Problems
Except from the possible reasons that may cause the long-run underperformance as mentioned above, this confusing puzzle might simply be a ‘bad model problem’ (Fama, 1998). Weather an IPO underperform in the long-run is highly depended on the measurements of performance. Moreover, the same measurement calculated by the same method may still produce diverse results when applying to different markets conditions. For instance, Moshirian et al. (2010) show that the existence of long-run underperformance for Asian IPOs is subject to the used methodology. This is in line with Gompers and Lerner (2003). Moreover, Ritter and Welch (2002) argue that the selection of IPO sample, e.g. the time period and the selection criteria, also matters when estimating the long-run performance of IPOs. More specifically, the measurement problems can be summarized into three categories.
The first type of problem is caused by the selection of benchmarks. Choosing appropriate benchmark is essential, because whether one can conclude the IPO is outperformed or underperformed is relative to how the benchmark performs. Given the great sensitivity of long-run performance to the benchmarks, it is plausible to consider that the underperformance might be merely due to the benchmarks used. A number of studies choose the market index as the benchmark (e.g. Loughran and Ritter, 1995; Brav and Gompers, 1997). However there arise problems if the time-varying systematic risk is not suitably controlled. It is impossible that all the firms are facing the same systematic risk (not all the betas equal to 1), neither are the risks constant over time (Clarkson and Thompson, 1990). Ritter (1991) and Ljungqvist (1995) suggest the underperformance is robust after controlling such risk, while Brav et al. (2000) find the underperformance disappear when the benchmark is value-weighted. There are also many studies that construct a matched portfolio of firms as the benchmark. Megginson and Weiss (1991) create portfolios for IPO firms that are matched by industry and size. Loughran and Ritter (1995) find that the 5-years’ BHARs of IPOs are significantly lower than the non-IPO firms match by size, by 50 percent. Brav and Gompers (1997) construct a portfolio of listed firms for each IPO that matched by size and book-to-market ratio. They find the 5-years’ BHARs
- 23 -
of IPO firms are higher the compared to the controlled portfolios. However, the IPOs are found to have underperformance when the market indexes are adopted as benchmarks.
The second problem emphasizes that the long-run performance is significantly affected by the measurements of returns, and the magnitude of the bias is different if different measurements are used. Debates have mainly concentrated on the comparison between the cumulative abnormal returns (CARs) and the buy and hold abnormal returns (BHARs). Barber and Lyon (1997) argue that the BHAR is better because it takes the investors’ experience into consideration and the returns calculated in this approach are compounding returns which are believed to be necessary.
The third problem is the statistical inferences from the comparisons between long-run performances. Kothari and Warner (1997) suggest that when matching firms with the counter group, the standard parametric test statistics might violate normal distribution. Moreover, Lyon et al. (1999) claim that the traditional t-test might yield an over rejection of the null hypothesis (there is no positive abnormal returns). Besides, Mitchell and Stafford (2000) argue that the performance among individual firms might be correlated in calendar time, thus leading to an unreliable result. In order to deal with this problem, they suggest that the bootstrapping distribution can be adopted.
2.4 VC and IPO long-run Performance
IPO is recognized by VCs as the most preferred exit option since it provides the highest rate of returns. The market value of firms increase notably as their shares are sold to the public investors (Barry, 1994). For VCs, the returns corresponding to various exit patterns differ largely, i.e. on average the return is between 30% and 60% for exiting through IPOs, and around 15% for repurchase and merge and acquisitions (M&A). Hence, to receive the maximised profitability, bringing portfolio firms to IPO has always been the optimal choice for VCs. On the other hand, the engagement of VCs also impacts the IPO firms. VC-backed firms experience the same issuing procedures as the non-VC-backed firms. They both have to choose underwriters, determine the issuing time, and set the offering prices and share amounts. The biggest difference between them is that non-VC-backed firms can only receive money from the traditional fund-raising channels (e.g. banks), while VC-backed firms can access money from a wider range of sources. The additional benefits VCs could bring are various: they are able to provide expertise consulting service, supervise company
- 24 -
activities and serve in the board of directors to help with strategic and operational decisions, and even strengthen and extend the social networks for the invested portfolio companies (Sahlman, 1990; Lerner, 1995; Casamatta, 2003; Chemmanur et al., 2011). Therefore, it is reasonable that the VC-backed IPOs present distinctive aftermarket performance patterns. In fact, during the last 3 decades, considerable efforts have been made to uncover the relationships between VC investments and their portfolio firms’ IPO performance.
2.4.1 The Impact of VC on Long-run Performance
The leading studies were initiated from the US stock market as it is the largest and the most developed and mature financial market in the world. VCs have been found to have significant impact on the post-IPO long-run performance. studies through various aspects. For example, Therefore, VC syndication has been one of the aspects (e.g. Tian, 2012; and Chahine et al., 2012). As argued by Tian (2012), VC syndication can help firms to enhance the innovation productivity and improve the product market value, which generate more patents with more profound influences. It also works well in improving firms’ market value since syndicated VC-backed firms have higher successful exit rates (exit through IPO and M&A). Tian (2012) shows that the syndicated VC-backed IPOs are significantly less underpriced and have higher IPO market valuation, because VC syndication can efficiently alleviate information asymmetry within the IPO process. VC syndication has also been a factor to affect the pre-IPO earnings. For example, Chahine et al. (2012) find a numerous VC syndication involvement is likely to increase pre-IPO earnings management, which is then following by high initial returns and low long-run performance. The possible reason is that the discrepancy within VCs not only exacerbates the agency-principal conflicts but also aggravates the principal-principal conflicts. These results are in line with Gangi and Rosaria (2008).
VC’s experience is another aspect that is studied as the mechanism of the VC’s impact. Gompers et al. (2008) find that VCs increase their investments when the market heats up and that behaviour is exhibited mostly by VCs who have the highest industry-specific experience. At the same time, such reaction does not exert a significant influence on the success rate of VC investments. What is more, during the hot market more experienced VCs perform better than the less experienced VCs, although it is only slightly better. This result runs counter to the viewpoint of “overreaction” indicating that less experienced VCs