Prediction and visualization of the
carcinogenic potential of chemicals
with short-term
omics
assays
Dissertation
der Mathematisch-Naturwissenschaftlichen Fakultät der Eberhard Karls Universität Tübingen
zur Erlangung des Grades eines Doktors der Naturwissenschaften
(Dr. rer. nat.)
vorgelegt von
MSc. Bioinform. Michael Römer
aus RäckelwitzTübingen 2017
Tag der mündlichen Qualifikation: 24.05.2017
Dekan: Prof. Dr. Wolfgang Rosenstiel
1. Berichterstatter: Prof. Dr. Andreas Zell 2. Berichterstatter: Prof. Dr. Michael Schwarz
Abstract
Drug candidates that induce or promote cancer formation must be identified and elimi-nated during the preclinical phase of drug development to minimize the risk of adverse, carcinogenic effects in patients. Genotoxic carcinogens can be identified with short-term assays. In contrast, the lifetime rodent cancer bioassay that is used to identify nongeno-toxic carcinogenic substances, requires a high number of test animals and takes up to five years for completion. In addition, the lifetime rodent cancer bioassay does not pro-vide sufficient data to evaluate the human risk if carcinogenic effects are observed in rodents. This can result in discontinuation of the development of the drug candidate or a black label warning on the drug packaging. The application of high-throughputomics
methods such as transcriptomics or proteomics in toxicological studies is a promising approach for the development of short-term alternatives to the lifetime rodent cancer bioassay. However, theseomicsmethods are difficult to use for life sciences researchers and few specialized visualization tools exist for toxicogenomics data. Furthermore, most existing studies used only a singleomicsplatform to determine the molecular effects of carcinogens.
This thesis introduces new approaches that integrate multipleomicsplatforms for the identification of nongenotoxic carcinogens and presents analysis and visualization tools that were specifically developed for toxicogenomics data. We performed a series of ex-periments to demonstrate that our multi-omicsapproach improves the prediction perfor-mance compared to single-omicsapproaches. To facilitate the access to our analysis and visualization tools, we implemented two web platforms, the ZBIT Bioinformatics Tool-box and MARCARviz. These web platforms enable toxicologists to gain new insights into the mechanisms of nongenotoxic tumor promotion. Furthermore, we demonstrated that our multi-omicsapproach can provide the basis of new short-term alternatives to the lifetime rodent cancer bioassay.
Kurzfassung
Arzneimittelkandidaten die die Entstehung und das Wachstum von Tumoren begünsti-gen, müssen in der präklinischen Phase der Medikamentenentwicklung identifiziert und aus der weiteren Entwicklung ausgeschlossen werden, um das Risiko von gefährlichen, tumorfördernden Nebenwirkungen für Patienten zu minimieren. Während genotoxische Substanzen mit Schnelltests identifiziert werden können, dauert das aktuelle Standard-prüfverfahren zur Erkennung von nicht-genotoxischen, karzinogenen Substanzen bis zu fünf Jahre und benötigt eine große Anzahl an Versuchstieren. Außerdem können aus dem Ergebnis keine Hinweise auf den Mechanismus gezogen werden wenn bei der Prüfung Tumore gefunden werden, was zur Einstellung der Entwicklung des Arzneimittelkandi-daten oder zu einer Black-Box-Warnung auf der Verpackung führen kann. Die Anwen-dung von modernen Hochdurchsatz-Technologien in toxikologische Studien, Toxikoge-nomik genannt, ist ein vielversprechender Ansatz zur Entwicklung von Prüfverfahren, die weniger Zeit und Versuchstiere benötigen. Allerdings sind die Methoden aus der Toxikogenomik für Toxikologen oft schwierig anzuwenden. Außerdem berücksichtig-ten die meisberücksichtig-ten existierenden Studien nur Daberücksichtig-ten einer einzelnenomics-Technologie und es existieren nur wenige spezialisierte Visualisierungswerkzeuge für toxikogenomische Daten.
Diese Arbeit stellt neue Analyse- und Visualisierungswerkzeuge vor, die spezifisch für toxikogenomische Studien entwickelt wurden, sowie integrative Ansätze, die es er-möglichen Daten von mehreren omics-Plattformen zu berücksichtigen, um die Identifi-kation von nicht-genotoxischen Karzinogenen zu verbessern. Wir beschreiben eine Rei-he von Experimenten mit einem neuen Toxikogenomikdatensatz, um zu demonstrieren, dass unsere integrativen Ansätze die Vorhersage der Karzinogenität von Substanzen ver-bessern. Die Weiterentwicklung der von uns beschriebenen integrativen Verfahren bietet möglicherweise Alternativen zu dem aktuell verwendeten, zeitaufwändigen Verfahren zur Feststellung der Karzinogenität. Außerdem beschreiben wir neue Webplattformen zur Analyse und Visualisierung von Expressionsdaten aus der Toxikogenomik, die wir entwickelt haben, um Toxikologen den Zugang zu bioinformatischen Werkzeugen zu vereinfachen. Mit diesen neuen Webplattformen können Toxikologen neue Erkenntnisse über die Wirkmechanismen der nicht-genotoxischen Krebsentstehung gewinnen.
Contents
1 Introduction 1
1.1 Contributions of this thesis . . . 3
1.2 Thesis structure . . . 5
2 Gene regulation and nongenotoxic carcinogenesis 7 2.1 Molecular regulation of gene expression . . . 8
2.1.1 Transcription of DNA to mRNA . . . 9
2.1.2 Silencing of mRNA by miRNA . . . 9
2.1.3 Translation of mRNA to proteins . . . 11
2.1.4 Post-translational modification of proteins . . . 12
2.2 Measuring gene regulation withomicstechnologies . . . 13
2.2.1 Gene expression microarrays . . . 13
2.2.2 MiRNA microarrays . . . 14
2.2.3 Reverse phase protein arrays . . . 14
2.3 Mechanisms of chemical-induced carcinogenesis . . . 15
2.3.1 Genotoxic carcinogenesis . . . 16
2.3.2 Nongenotoxic carcinogenesis . . . 17
3 Introduction to toxicogenomics and machine learning 21 3.1 Omicsdata processing and analysis . . . 22
3.1.1 Microarray quality control . . . 22
3.1.2 Normalization methods for microarrays . . . 23
3.1.3 Statistical analysis of microarray data . . . 25
3.2 Machine learning methods for classification . . . 27
3.2.1 Support vector machines . . . 28
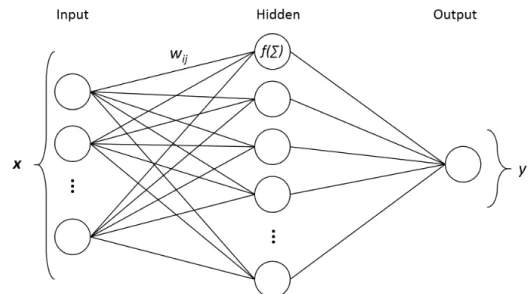
3.2.2 Neural networks . . . 30
3.2.3 Random forests . . . 31
3.2.4 Validation of classification models . . . 32
3.3 Toxicogenomics for preclinical risk assessment . . . 34
3.3.1 In vivorat studies . . . 34
3.3.2 In vivomouse studies . . . 37
3.3.3 In vitrostudies . . . 37
4 The ZBIT Bioinformatics Toolbox for computational biology 41
4.1 Tools included in the ZBIT Bioinformatics Toolbox . . . 43
4.1.1 Systems biology . . . 43
4.1.2 Transcription factor annotation . . . 46
4.1.3 Expression data analysis . . . 47
4.2 Setup of the web platform . . . 48
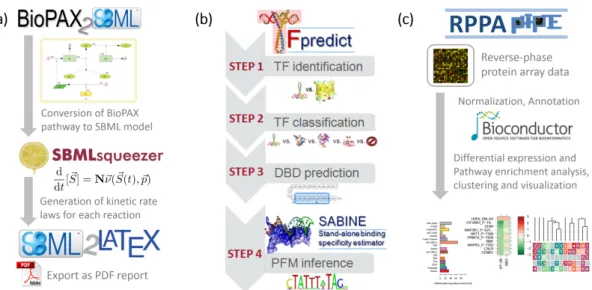
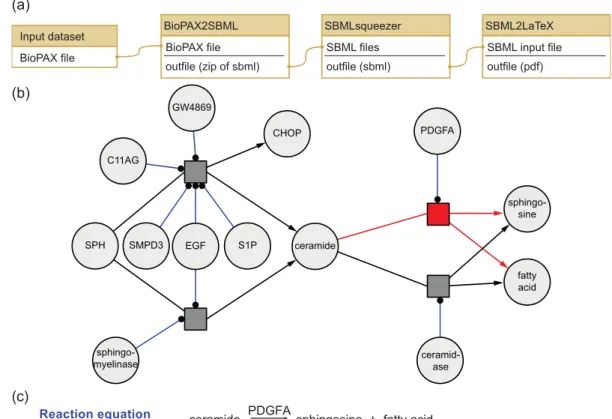
4.3 Use cases for the ZBIT Bioinformatics Toolbox . . . 50
4.3.1 Creation of full kinetic models from pathway maps . . . 50
4.3.2 Identification of transcription factors and DNA binding domains 52 4.3.3 Effects of drugs on protein expression . . . 52
4.4 Related web platforms . . . 54
4.5 Summary and conclusions . . . 57
5 Similarity screening for characterization of drug candidates 59 5.1 Data resources . . . 60
5.1.1 The Carcinogenic Potency Database . . . 61
5.1.2 Open TG-GATEs . . . 61
5.1.3 DrugMatrix . . . 62
5.1.4 Comparison of Open TG-GATEs and DrugMatrix . . . 63
5.1.5 Validation dataset . . . 64
5.2 Similarity scoring for gene expression profiles . . . 64
5.2.1 Gene expression fingerprints . . . 65
5.2.2 Tanimoto similarity coefficient and Jaccard index . . . 65
5.2.3 Novel similarity coefficient for gene expression fingerprints . . 66
5.3 Evaluation of the new similarity coefficient . . . 67
5.3.1 Gene expression fingerprint extraction . . . 67
5.3.2 Identification of similar conditions . . . 69
5.3.3 Intensity ratio threshold evaluation . . . 71
5.3.4 Hepatocarcinogenicity prediction . . . 73
5.4 The ToxDBScan web application . . . 73
5.5 Summary and conclusions . . . 76
6 Multi-omicsapproaches for prediction of nongenotoxic carcinogenicity 79 6.1 New integrative feature representations for multi-omicsdata . . . 80
6.1.1 Molecular interaction features . . . 81
6.1.2 Pathway enrichment features . . . 82
6.2 Model construction workflow with single- and multi-omicsfeatures . . 84
6.2.1 Data preprocessing . . . 84
6.2.2 Inference of predictive molecular signatures . . . 85
6.2.3 Validation of prediction models . . . 86
6.3 Results of the model evaluation . . . 86
Contents
6.3.2 Predictive features for toxicogenomics models . . . 90
6.3.3 Toxicogenomics-based classification of undefined compounds . 92 6.4 Summary and conclusions . . . 97
7 Web-based interactive visualization of gene regulation data 99 7.1 Database content and construction . . . 101
7.1.1 Datasets and data analysis . . . 101
7.1.2 Database construction . . . 102
7.1.3 Architecture of the interactive web platform . . . 104
7.2 Interactive visualizations of microarry data . . . 105
7.3 Use case: Identification of phenobarbital target genes and pathways . . 111
7.4 Summary and conclusions . . . 113
8 Summary and general conclusions 115
A Supplementary Tables 121
Abbreviations 125
Chapter 1
Introduction
The discovery of drugs for common and rare diseases has improved the prognosis of many diseases and greatly extended human life expectancy. The development and mar-keting of pharmaceutical drugs is a multi-billion dollar industry. Based on the data of 106 randomly selected new drugs, DiMasiet al.(2016) report that pharmaceutical com-panies invest over 10 years of research and $2.5 billion until a new drug is approved for marketing. This estimate includes the cost of drug candidates that are discontinued dur-ing the development or risk assessment process due to lack of efficacy or severe adverse side effects. During the premarketing risk assessment, drug candidates are screened for adverse side effects in a process that is divided into several phases. The preclinical phase involves in silico, in vitro, and animal testing. Three subsequent clinical phases involve increasing numbers of patients and healthy participants to evaluate the efficacy and side effects of drug candidates in humans. Based on industry reports, DiMasiet al.(2016) cal-culate a clinical success rate of 11.83%, which means that 88.17% of the compounds that pass the preclinical phase fail during one of the three clinical phases. When drug candi-dates pass clinical phase III, regulatory agencies approve them for marketing. Approved and marketed drugs enter clinical phase IV, the postmarketing surveillance. Physicians and regulatory agencies continue to monitor the effects of the drug in patients and ag-gregate new results from further animal experiments. Onakpoyaet al.(2016) report that manufacturers and regulatory agencies withdrew 462 approved medicinal products due to adverse drug reactions between 1953 and 2013. Hepatotoxicity (81 cases) was the most common reason for withdrawals, and 114 of the 462 withdrawals were associated with patient deaths. 61 drugs were withdrawn due to carcinogenicity. For example, the antihistamine methapyrilene that was used in flu medicines was withdrawn after it was found to be a potent liver carcinogen in animal carcinogenicity studies (Lijinskyet al., 1980).
Animal studies are an integral part of toxicological research and the drug discovery process. Mechanistic studies in animals establish biological pathways and determine druggable targets for diseases. These druggable targets are the basis for modern drug de-velopment. High-throughput chemical screenings identify small molecules (called leads) that show a binding affinity for the druggable target. Molecular optimization increases the binding affinities through modifications of the structure and composition of the lead.
Further in vitroand in vivoanimal studies establish the efficacy, toxicity, and pharma-cokinetics of successful leads and act as a filter for the initial drug candidates. Estimates by Bolten and DeGregorio (2002) indicate that only 1 in 1,000 compounds that pass the early stages of drug discovery enter the clinical phase. Due to the high number of com-pounds that fail before entering the clinical phase, pharmaceutical companies perform the most expensive and time-consuming animal tests late in the development process, long after clinical trials have started (Krameret al., 2004). One of these tests is the life-time rodent cancer bioassay (LRB). It requires more than 800 mice and rats, substantial amounts of the drug candidate, and the histopathological examination of more than 40 tissues (Waterset al., 2010). Regulatory agencies demand the LRB for drug candidates that are to be administered to patients chronically for more than six months. Tumor find-ings in the LRB may cause significant delays in the approval of drug candidates or even result in the withdrawal of approved drugs, as was the case for methapyrilene (Lijinsky
et al., 1980).
Because most compounds that cause DNA damage are potent carcinogens, pharma-ceutical companies eliminate genotoxic compounds early in the development. However, some carcinogens, such as methapyrilene, initiate or promote tumors but do not cause DNA damage. These compounds are called nongenotoxic carcinogens (NGCs). In con-sequence, thein vitrogenotoxicity assays that are performed in early stages of drug de-velopment fail to detect their carcinogenic potential. NGCs are the main reason for tumor findings in the LRB. The relevance of these positive findings to humans is a controversial issue, and the LRB does not provide mechanistic information to determine the mode of action (MOA) through which a compound induces cancer (Ames and Gold, 1990). For these reasons, as well as the high cost in time and money and more recent political initia-tives to reduce the number of animal tests in risk assessment, pharmaceutical companies and regulatory agencies are working towards alternative approaches for assessing the car-cinogenic potential of new drugs. The innovative medicines initiative (IMI) MARCAR project, which encompasses several European universities and pharmaceutical compa-nies, is a combined effort to identify molecular biomarkers and tumor classifications for nongenotoxic carcinogenesis. The MARCAR Consortium (2010) formulates four major objectives: (i) Find early biomarkers that can reliably identify compounds with potential for later cancer development, (ii) advance the scientific basis for the assessment of the carcinogenic potential of nongenotoxic drugs, (iii) identify the molecular responses to the exposure to NGCs to support the development of early biomarkers, and (iv) improve the efficiency of risk assessment in drug development by progressing the development of alternative research methods. The MARCAR consortium expects that early cancer biomarkers improve the safety of participants in clinical trials and reduces the need for animals in accordance with the proposed concept of reduction, refinement, and replace-ment of animal experireplace-mentation (MARCAR Consortium, 2010).
The inclusion of bioinformatics and high-throughput technologies is a central compo-nent of most proposed alternatives to the LRB. These so-calledomicsmethods contribute a rich source of molecular data, which toxicologists use to perform mechanistic
analy-1.1 Contributions of this thesis
ses. Machine learning models extract biomarker signatures from this high-dimensional data and predict the carcinogenicity of compounds. The field that combines toxicolog-ical questions with omics methods has been coined toxicogenomics. The maturation of microarray technologies and next-generation sequencing simplified the collection of molecular data for many compounds. This led to the creation of two large standardized databases of the effects of NGCs on gene expression in rodent tissues: the Toxicoge-nomics Project-Genome Assisted Toxicity Evaluation System (TG-GATEs) by Uehara
et al. (2010) and DrugMatrix by Ganter et al. (2006). Prompted by the need for al-ternative strategies for assessing the carcinogenic potential and the advances of omics
technologies, the MARCAR project explores the application of multi-omics and epige-netic profiling in preclinical risk assessment. To this end, the MARCAR consortium profiled gene expression, protein abundance, microRNA (miRNA) expression, and DNA methylation in the same samples to generate an integrated model of the effects of NGCs on all levels of gene regulation (see, for example, Thomsonet al.(2014) and Unterberger
et al. (2014)). To efficiently analyze this data, new integrative bioinformatics methods and specialized visualization tools are necessary.
1.1 Contributions of this thesis
This thesis presents the research that we conducted in cooperation with members of the chair of Cognitive Systems and the MARCAR consortium. The presented research focuses on the visualization and predictive analysis of the toxicogenomics data gener-ated during the MARCAR project. Due to the integrative approach of the MARCAR project and the high-dimensional nature of omicsdata, the analysis requires automated processing pipelines, efficient data storage infrastructure, robust statistics, and advanced machine learning methods. To facilitate data analysis and access to the data for the whole MARCAR consortium, we developed web platforms which provide visualiza-tions and analysis tools for the MARCAR data. In addition, we developed new toxi-cogenomics approaches that were designed specifically for the integrative data collected by the MARCAR project. The following paragraphs shortly summarize the four main contributions of this thesis.
The ZBIT Bioinformatics Toolbox for computational biology
Due to the advance of high-throughput technologies in the life sciences, computational data analysis is an integral part of modern research. However, the computational re-sources and the technical knowledge of many wet lab researchers are limited, whereas the requirements in both regards are rising with each new generation ofomics technolo-gies. For example, the installation of academic bioinformatics software often depends on specific operating systems or third-party libraries. Also, many tools do not provide graphical user interfaces or detailed documentation. In addition, the processing omics
data can require large amounts of RAM and computational power, which are not avail-able on standard desktop computers. For these reasons, we set up the ZBIT Bioinformat-ics Toolbox, which provides web-based access to a collection of bioinformatBioinformat-ics software and pipelines. By porting bioinformatics software into the web, we enable researchers to use our tools on our computation cluster, such that they do not need to install any dependencies or worry about hardware restrictions. Currently, the software collection in the ZBIT Bioinformatics Toolbox encompasses tools for systems biology, expression data analysis, and transcription factor annotation. We use a customized version of the Galaxy framework to host the tools and distribute the tool execution among the nodes of our internal computation cluster. A workflow system allows the combination of tools into automated pipelines and the ZBIT Bioinformatics Toolbox stores all results and pa-rameters in accordance with scientific needs for persistence and reproducibility. As a consequence, the user requires only a browser to access the tools, perform analysis, and view results in standardized formats. We provided extensive documentation for all tools, together with tutorials, use cases, and example data. The ZBIT Bioinformatics Toolbox is freely available at https://webservices.cs.uni-tuebingen.de/ and was pub-lished inPLoS ONEin 2016 (Römeret al., 2016b).
Similarity screening for characterization of drug candidates
ToxDBScan is a tool for evaluating the hepatocarcinogenic potential of drug candidates or other compounds in rodents. Users can upload gene expression signatures, which ToxDBScan uses to identify substances that induce similar changes. Based on the known properties and mechanisms of these similar substances, users can extrapolate informa-tion on hepatocarcinogenicity and potential modes of acinforma-tion. ToxDBScan uses a novel similarity screening method, which requires only the up- and downregulated genes as input. The ranking based on the new similarity scoring achieved a sensitivity of 88% and a predictive analysis correctly predicted the carcinogenicity of 15 external validation compounds. Furthermore, ToxDBScan visualizes the most similar expression patterns in heat maps and performs a pathway enrichment analysis for the gene expression signa-ture to provide the user with additional mechanistic information. ToxDBScan is freely available from the ZBIT Bioinformatics Toolbox and was published in theInternational Journal of Molecular Sciencesin 2014 (Römeret al., 2014b).
Multi-omics approaches for prediction of nongenotoxic carcinogenicity
Traditionally, predictive toxicogenomics studies use mRNA microarrays to determine molecular signatures for the early assessment of the carcinogenic potential of new com-pounds. While some studies explore the use of other omics platforms such as miRNA microarrays or proteomics arrays, most existing models are based on data from a single
omics platform. Here, we explored the integration of data from multiple omics plat-forms to build predictive models for compound carcinogenicity. To this end, mRNA,
1.2 Thesis structure
miRNA, and protein expression profiles were collected from the livers of rats, which were exposed to NGCs, genotoxic carcinogens (GCs), and noncarcinogens (NCs). We developed new integrative feature representations which provide an abstraction from the molecular perspective of traditional toxicogenomics models to a systematic, pathway-and interaction-based perspective. These feature representations are calculated based on the observed expression values and incorporate existing knowledge that is available from molecular interaction databases and pathway databases, such as KEGG, BioCarta, or Re-actome. We evaluated the performance of models for hepatocarcinogenicity prediction, which were built with five different machine learning methods and several combinations of the multi-omicsfeatures. With a repeated cross-validation procedure, we found that the integration of data from multipleomicsplatforms increases the prediction accuracy in hepatocarcinogenicity classification. We also demonstrated that the classification perfor-mance increases further when the proposed integrative feature representations are avail-able for classifier training. In consequence, we were avail-able to demonstrate that the early identification of NGCs can be improved by profiling and integrating data from multiple
omicsplatforms. This study was published inPLoS ONEin 2014 (Römeret al., 2014a).
Web-based interactive visualization of gene regulation data
The effective mining of high-dimensional toxicogenomics datasets is a non-trivial task that usually requires bioinformatics support to extract relevant mechanistic patterns and confirm toxicological hypotheses. MARCARviz is a web platform that enables biologists to quickly address the most common questions associated with the MARCAR microar-ray data, to identify relevant patterns in the data, and to generate or confirm mechanistic hypotheses about nongenotoxic effects leading to cancer formation. The major advan-tage of MARCARviz is that there is no software or advanced technical knowledge re-quired to perform powerful analyses and generate visualizations of the MARCAR data. MARCARviz greatly facilitates the confirmation of published MARCAR results and generation of new insights from the collected data without the requirement for com-plex preprocessing steps. MARCARviz is publicly available from https://tea.cs.
uni-tuebingen.de/and was presented at the German Conference for Bioinformatics
2016 (Römeret al., 2016a).
1.2 Thesis structure
The following two chapters provide the biological and statistical background for the re-search that is presented in this thesis. The first half of Chapter 2 describes the levels of gene regulation that are relevant for nongenotoxic carcinogenicity and have been tar-geted by molecular profiling in the MARCAR project, followed by a description of the high-throughput technologies that were used to collect the data used in this thesis. The second half summarizes the current knowledge of the mechanisms of chemical-induced
carcinogenesis with particular focus on NGCs. Chapter 3 provides an overview of the preprocessing and statistical analysis of gene regulatoryomicsdata. Chapter 3 also in-troduces the machine learning algorithms that have been used in the studies presented in Chapters 5 and 6 and the validation strategies that are used to assess the classification performance. The last section of Chapter 3 reviews the current state of predictive toxi-cogenomics, its anticipated impact on preclinical risk assessment, and the limitations of recent toxicogenomics studies.
Chapters 4 to 7 are based on the bioinformatics tools and toxicogenomics studies that were published in collaboration with other researchers in the MARCAR consortium. Chapter 4 describes the ZBIT Bioinformatics Toolbox, a web-based collection of bioin-formatics tools for systems biology, expression data analysis, and transcription factor analysis. The chapter provides an overview of the included tools and describes the user interface, the technical setup, and the architecture of the web platform, along with use cases for each major category of the ZBIT Bioinformatics Toolbox. Chapter 5 presents ToxDBScan, a web tool for hepatocarcinogenicity assessment, and provides a detailed mathematical background for the proposed similarity scoring index. In addition, Chap-ter 5 includes the evaluation of ToxDBScan with data from the MARCAR project, ex-amples of the MOA detection with ToxDBScan, and a proof of concept for a possible extension of the tool with predictive analyses. Chapter 6 introduces two integrative fea-ture types for multiplatformomicsdata, reports a predictive toxicogenomics study which compares single-omics, multi-omics, and integrated features for hepatocarcinogenicity classification, and discusses the observed results and their implications for the develop-ment of alternative testing strategies. Chapter 7 presents MARCARviz, a web platform for interactive visualization of the transcriptomics data that the MARCAR project has generated. The chapter provides a detailed description of the platform architecture and the user interface, as well as a use case for the application of MARCARviz for mecha-nistic analyses.
To conclude, Chapter 8 discusses the presented results and tools in the context of the MARCAR project and summarizes the conducted research and its potential contributions to preclinical drug and compound development.
Chapter 2
Gene regulation and nongenotoxic
carcinogenesis
The regulation of gene expression is a complex, multistage process, which begins with the structural and chemical properties of the DNA molecule and ends with biomolecules that influence and control the life and activity of biological cells. Adverse perturbations of the gene regulation in a single cell can have consequences for the whole organism. The principal example for these errors in gene regulation are tumors, abnormal tissue growths that originate from cells with a defective regulation of the cell’s life cycle. Malignant tumors, also called cancer, can spread across the whole organism and are a leading cause of death worldwide. Anand et al. (2008) estimate that environmental factors, such as smoking, diet, sun exposure, and environmental pollutants, cause 90-95% of all cancer cases. The formation of tumors can be attributed to three major external factors: physical (e.g., ultraviolet and ionizing radiation), chemical (e.g., tobacco smoke), and biological (e.g., virus infections) carcinogens (IARC, 2014)).
Chemical-induced carcinogenesis is often driven by DNA damaging effects, which cause mutations in genes that regulate the cell life cycle. Genotoxic carcinogens (GCs) are known to induce DNA damage , which initiates tumor formation through DNA mu-tations. In contrast, nongenotoxic carcinogens (NGCs) promote tumor formation but exhibit no genotoxic effects. While the mechanism of GCs is defined by their DNA damaging properties, NGCs act through a wide range of mechanisms which disturb the regulation of genes that control the proliferation, growth, and death of cells. The char-acterization and identification of these nongenotoxic effects are the major goals of the research presented in this thesis.
The first section of this chapter illustrates the molecular mechanisms of gene regula-tion with regard to mRNAs, miRNAs, and proteins. The second secregula-tion of this chapter describes theomicstechnologies that are used to assess gene regulation in cells. The last section of this chapter illustrates the differences between genotoxic and nongenotoxic carcinogenesis and provides an overview of the mechanisms of NGCs.
2.1 Molecular regulation of gene expression
Gene expression is the process of translating the genetic information that is stored within the chemical structure of the DNA into biologically active proteins. This process is di-vided into two major steps: (i) the transcription of the genetic code from the stable, two-stranded DNA into a single-stranded mRNA molecule and (ii) the translation of the mRNA molecule into a functioning protein (Twyman, 2001). These two steps can be further dissembled into smaller steps, e.g., the uncoiling of the DNA for transcription, RNA transport, or post-transcriptional modifications of mRNAs. From gene transcrip-tion initiatranscrip-tion to protein degradatranscrip-tion each step is regulated by molecular and biochemical mechanisms. The following sections describe the steps that are relevant for this the-sis: the transcription of DNA to mRNA, the post-transcriptional silencing of mRNA by miRNAs, the translation of mRNAs into proteins, and the post-translational modification of proteins. Figure 2.1 shows a overview of these steps of gene regulation. The following sections are based on literature and the book Developmental Biology by Twyman (2001).
Figure 2.1:Molecular regulation of gene expression. The genetic code of the DNA is transcribed into mRNAs, which are the templates for the protein amino acid sequence. The DNA also encodes non-coding RNAs that regulate DNA transcription and mRNA translation. Non-coding miRNAs inhibit mRNA translation by binding to complimen-tary regions on mRNAs and forming RNA-induced silencing complexes. Protein-coding mRNAs are translated into peptide chains that are cleaved and folded to form the final protein product. Post-translation modifications such as phosphorylation and methylation regulate the activity of proteins.
2.1 Molecular regulation of gene expression
2.1.1 Transcription of DNA to mRNA
Transcription is the synthesis of RNA molecules based on the DNA template. Transcrip-tion is the first and most crucial step of gene expression, as all subsequent steps depend on the transcribed RNA molecules. In eukaryotes, the DNA is transcribed by three RNA polymerases, but only RNA polymerase II produces mRNA for protein synthesis. RNA polymerases I and III transcribe ribosomal and transfer RNAs, which are required to build the ribosome and synthesize proteins. The RNA polymerase II binds to an up-stream region of the gene, the promotor. The DNA sequence of the promotor determines the binding affinity of the RNA polymerase II and can vary greatly between genes, which leads to different expression profiles.
In prokaryotes, the ground state of gene expression, i.e., the expression without any transcription altering molecules, is nonrestrictive. In consequence, gene regulation is mainly a question of gene repression. In contrast, the ground state of gene expression in eukaryotes is restrictive. This is the result of the tightly packaged chromatin struc-ture, which prevents the binding of RNA poymerase II to the promotor in the absence of transcription factors that catalyze the binding. The presence or absence of transcription factors is the major driver of differentiation and cell- or tissue-specific gene expression. Transcription factors bind to the promotor to initiate RNA polymerase II activity or in-teract with enhancer sites on the DNA to increase the speed and stability of the RNA transcription complex. Many transcription factors also influence the chromatin structure to facilitate or impede the access to gene promotors.
Promotor binding and transcription initiation are the dominant regulatory factors of transcription. However, after the transcription has started, the RNA synthesis can be accelerated, slowed, or terminated. For example, RNA elongation (the addition of RNA bases to the already synthesized RNA strand) is regulated by proteins and transcription factors that bind to the RNA transcription complex.
2.1.2 Silencing of mRNA by miRNA
After transcription, the mRNA is subject to post-transcriptional processing. This pro-cess of mRNA modification involves capping to improve stability, transport to specific translation locations, and alternative splicing of introns. In addition to these mRNA mod-ifications, mRNAs are also silenced and degraded to maintain steady levels of mRNA for protein synthesis. The abundance of mRNAs in the cell and the translation of mRNAs into proteins is regulated by many factors, such as degradation by non-coding RNAs and enzymes and silencing by miRNAs. These miRNAs form a family of small RNAs of 21-25 nucleotides (nt), which bind to specific target mRNAs and inhibit their translation into proteins (He and Hannon, 2004). The transcriptional regulation of miRNAs is still subject of research (Lee, 2002). Some miRNAs have been found in the introns of both protein-coding and non-coding host genes, which suggests that they are co-regulated with other RNAs (Lagos-Quintanaet al., 2003).
By binding at 7 or 8 nt complementary base pair matches in the 3’ untranslated region (3’-UTR) of the target mRNA, miRNAs form RNA-induced silencing complexes, which inhibit translation during protein elongation or the release of the protein product (Olsen and Ambros, 1999; He and Hannon, 2004). The post-transcriptional silencing of mRNAs by miRNAs is also shown in Fig. 2.2. The discovery of the imperfect complementarity at the mRNA-miRNA binding sites is the main access point for miRNA target prediction, for which a variety of tools exist (Bartel, 2009). According to Bartel (2009), a simple miRNA target recognition can be performed by a three-step procedure: first, identify the miRNAs seed, which are the nucleotides 2-8 of the 5’ region of the miRNA, second, use genome-wide alignments to compile orthologous 3’-UTRs, and third, search these orthologous UTRs for conserved occurrences of the miRNA seed (Bartel, 2009).
The prediction of miRNA targets has revealed that miRNAs regulate a large number of functionally diverse genes (Lim, 2003). In addition, miRNA expression has been found to be stage-specific in development and tissue-specific in different organs (Bartel, 2004). Bartel and Chen (2004) propose that miRNAs act as micromanagement modulator of gene expression by (i) suppressing genes that should not be expressed in a specific cell type and by (ii) adjusting the expression of genes to allow for a tissue-specific gene ex-pression pattern. Lu and Clark (2012) report that genes which are regulated by miRNAs
Figure 2.2: Post-transcriptional silencing of mRNAs by miRNAs. (a) The miRNA (red) binds to the 3’ untranslated region (3’-UTR) of the target mRNA at 7 or 8 nt com-plementary base pair matches. (b) RNA-induced silencing complexes (RISC) inhibit the elongation at the ribosome and the release of the translated protein.
2.1 Molecular regulation of gene expression
show a greater variation in expression at the population level compared to genes that are not regulated by miRNAs. Lu and Clark (2012) conclude that post-transcriptional silenc-ing has two major roles in gene regulation: (i) fine-tunsilenc-ing or canalizsilenc-ing the expression levels of a subset of target genes and (ii) promote expression variation of other target genes.
The dysregulation of miRNAs can lead to serious malfunctions of the gene expression regulation. For example, the loss of tumor-suppressive miRNAs leads to an increased expression of cancer-related genes (called oncogenes), whereas the increased expression of cancer-related miRNAs (called oncomirs) can repress tumor repressor genes (Kasinski and Slack, 2011). Targeting these miRNAs has been proposed as a potential cancer therapy and a synthetic mimic of a tumor suppressor miRNA is currently in clinical phase I trials for the treatment of liver cancers (Hayes et al., 2014). The deregulation of miRNAs is also associated with other diseases and the Human microRNA Disease Database lists 572 miRNAs that are involved in 378 diseases (Liet al., 2014).
2.1.3 Translation of mRNA to proteins
Translation is the synthesis of proteins based on the mRNA template and is the second major step in gene expression. The synthesis of proteins is performed by ribosomes, molecular complexes that are formed by ribosomal RNA (rRNA) and proteins. Ribo-somes are assembled at the 5’ cap of an mRNA and start the protein synthesis when en-countering an AUG codon. The protein is elongated with amino acids carried by transport RNAs (tRNAs), which match the codon at the current position of the ribosome. When a stop codon is detected, release factors cause the ribosome to disassemble and release the synthesized protein.
Like all stages of gene expression, translation is regulated by multiple molecular and structural mechanisms. In eukaryotes, translation initiation is controlled by enzymatic factors that catalyze ribosome binding (Kozak, 1999). In addition, mRNA binding factors affect the translational regulation, e.g., miRNAs, which repress protein elongation and release. The number of ribosomes is also a limiting factor for the amount of proteins produced by a cell.
The translation is one of the main targets of antibiotics due to the evolutionary dif-ferences between prokaryotic and eukaryotic ribosomes. Most antibiotics that are used clinically inhibit either the binding of tRNAs to the ribosome or the translocation of the ribosome along the mRNA (Wilson, 2013). The disruption of translational control has also been linked to cancer formation, e.g., by selective translation of oncogenes, and has been found to be specific for various types of cancer or disease stages (Silvera et al., 2010).
2.1.4 Post-translational modification of proteins
After the release from the ribosomal complex, most proteins undergo post-translational modifications (PTMs) that alter the protein structure, the amino acid composition, or properties of the amino acid side chains. The most relevant PTMs for this thesis are chemical modifications of the amino acid residues, such as phosphorylation, acetylation, and methylation.
The reversible phosphorylation of serine, tyrosine, and threonine residues in proteins is a major regulatory mechanism of protein activity (Johnson and Lewis, 2001). In humans, approximately 86.4% of serine, 11.8% of threonine, and 1.8% of tyrosine residues are phosphorylated (Olsenet al., 2006). Although tyrosine phosphorylation is less common, it is critical for many cell signaling processes. Several oncoproteins, growth factors, and hormones show tyrosine phosphorylating activity (Johnson, 2009b). Phosphorylation can change the function of proteins through multiple mechanisms. The negative charge of the phosphoryl group can lead to the formation of bonds with arginine residues, which results in conformational changes of the protein (Mandellet al., 2007). In other cases, en-zyme activity is inhibited without conformational changes, e.g., by the phosphate group acting as a steric blocking agent (Russoet al., 1996) or impeding substrate recognition (Hurley et al., 1990). The transfer of phosphate groups to amino acid residues is cat-alyzed by proteins that are called kinases. The identification of the human kinome, i.e., the set of all kinases, led to the discovery of seven major groups of kinases (Manning
et al., 2002). Due to their prominent role in the regulation of cellular signaling, protein kinases have been studied extensively and were linked to many types of cancers and dis-eases. In 2008, ten kinase inhibitors had been approved as drugs for the treatment of several cancer types, and several more are currently in clinical trials (Johnson, 2009a).
The acetylation of proteins usually occurs at lysine residues and neutralizes the pos-itive charge of the lysine, which changes the protein function (Choudharyet al., 2009). Histone acetylation plays an important role in the regulation of gene expression and has long been known to increase transcription (Allfrey et al., 1964). More recently, lysine acetylation has been shown to influence p53function and interactions (Yang and Seto, 2008), which suggests a broader role of protein acetylation in gene regulation and protein function. Acetylation and deacetylation are catalyzed by acetyltransferases and deacety-lases, both for histones and lysine residues in general (Shahbazian and Grunstein, 2007). Acetyltransferases and deacetylases have been identified as potential targets of drugs for cancer or neurodegenerative diseases and are currently tested in clinical trials (Choud-haryet al., 2009). However, despite the recent increase in interest, the knowledge ofin vivoacetylation sites is still sparse.
Protein methylation has long been associated mainly with histones and chromatin modification, where they are a major part of the “histone code”, which regulates gene transcription (Biggar and Li, 2014). Methylation occurs predominantly at lysine and arginine residues, which can be methylated up to two (arginine) or three (lysine) times. Recently, the methylation of non-histone proteins has been found to have a regulatory
2.2 Measuring gene regulation withomicstechnologies
role in many cellular processes (Paiket al., 2007). Similar to the role of kinases for phos-phorylation, methyltransferases that are specific for arginine or lysine act as an activator by transferring methyl groups to the amino acid residues, which leads to the binding of methyl-binding proteins or alters protein structure and activity. After the activating stimulus is withdrawn, demethylases erase the methyl group and restore the previous protein state. Methylation has long been considered to be a stable modification, but the discovery of non-histone protein methylation has also shown that methylation can be as dynamic as phosphorylation events (Dhamiet al., 2013) and is linked to several crucial cell signaling pathways, e.g., the mitogen-activated protein kinase (MAPK) signaling cascade (Mazur et al., 2014). The SMYD3 gene in the MAPK signaling cascade also links lysine methylation to cancer (Mazuret al., 2014), which indicates that methylation also regulates oncogene expression.
2.2 Measuring gene regulation with
omics
technologies
Gene expression profiling is of great use for toxicological studies because changes in the mRNA abundance are among the first detectable responses to compound adminis-tration. The earliest methods for mRNA transcript profiling such as the Northern blot by Alwineet al.(1977) performed one assay for each transcript. Meanwhile, these tra-ditional methods have been replaced by techniques that can quantify the expression of thousands of genes simultaneously. Among the most used technology in larger projects are mRNA microarrays, which are commercially available since the 2000’s (Bumgarner, 2013). Despite the recent advent of next-generation sequencing for transcript profiling (RNA-seq), microarrays remain an important technology for gene expression profiling because they are cheaper, require less data storage, and provide well-established analysis pipelines (Zhaoet al., 2014). Besides mRNA arrays, manufacturers provide microarrays for a wide range of other biomolecules such as non-coding RNAs, DNA methylation, and proteins. This section describes the three types of array-based technologies that we used to generate the data for the research presented in this thesis: Affymetrix mRNA microarrays, Agilent miRNA microarrays, and reverse phase protein arrays (RPPAs).
2.2.1 Gene expression microarrays
Gene expression microarrays, also called DNA or mRNA microarrays, have been applied in many fields of biology, such as pharmacogenomics (Debouck and Goodfellow, 1999), cancer research (Khanet al., 1999), and pathology (Becich, 2000). The application of microarrays involves multiple steps: array fabrication and probe spotting, hybridiza-tion of probes and sample material, hybridizahybridiza-tion signal detechybridiza-tion, and data analysis. Microarrays are fabricated on glass, silicon, or plastic surfaces and spotted with DNA probes, i.e., synthetic oligonucleotides, by in situ synthesis. The extracted DNA material is labeled with reporters (fluorescent dyes) and a whole array scanner measures the signal
of the bound reporter probes. Thus, an image of the microarray contains the complete hybridization pattern and can be used for the hybridization analysis. The high-density arrays manufactured by Affymetrix utilize a massively parallel approach for DNA hy-bridization, with hundreds of thousands of test sites (probes) in less than 2 cm2(Lockhart
et al., 1996).
To profile mRNA abundance in samples, the RNA is extracted, isolated, and purified with RNA preparation kits and RNA quality is assessed. The extracted RNA is labeled with a fluorescent dye that can be detected by the scanner and hybridized to the microar-ray probes. Affymetrix provides reagent kits to perform the necessary hybridization procedure, which includes hybridization, washing and staining. After hybridization, the scanner captures a fluorescence image and calculates a signal intensity for each probe. The probe signal intensity is a function of the amount of sample RNA that has hybridized to a probe. These intensities are the raw data input for the bioinformatics analysis, which is described in Chapter 3.
2.2.2 MiRNA microarrays
Perturbed miRNA expression can lead to dysfunctional cell regulation and is specific for different tissues, diseases, and cancers. For this reason, miRNA profiling is of great interest and microarray manufacturers have adapted the mRNA microarray technology to miRNAs during the last decade. The main challenge in miRNA profiling is the small size of miRNAs (∼22 nt) and the high degree of homology between different miRNAs (D’Andrade and Fulmer-Smentek, 2012). Commercially available mRNA arrays typi-cally use probes of 25 nt (Affymetrix) or 60 nt (Agilent), which necessitates a different probe design for miRNA microarrays. The presence of unspliced precursor miRNAs must also be considered in the probe design (D’Andrade and Fulmer-Smentek, 2012). The miRNA data in this thesis was generated with Agilent miRNA microarrays, which use a labeling method and probe design that is optimized for miRNAs (Wang et al., 2006). Agilent also provides labeling and hybridization kits for the miRNA microarrays to standardize sample processing. Subsequently, the miRNA microarrays are measured with commercial scanners and images and signal intensities are analyzed with bioinfor-matics methods.
2.2.3 Reverse phase protein arrays
Proteins are biologically active molecules that perform most cellular functions such as catalyzing chemical reactions, transporting other molecules, or replicating the DNA. Measuring protein expression and activation states is the most direct assessment of the biological state of a cell. Traditional methods (e.g., two-dimensional gel electrophoresis in combination with mass spectrometry) identify mostly high abundance proteins (Gygi
et al., 2000). However, up to 90% of the proteins in a cell are present in low copy num-bers (Miklos and Maleszka, 2001) and there is no protein amplification method available.
2.3 Mechanisms of chemical-induced carcinogenesis
In addition, protein immobilization and binding is difficult due to the large differences in function and structure. Proteins show high diversity, including anti-bodies, water-soluble enzymes, and water-insoluble membrane proteins.
RPPAs utilize microarray technology to profile protein expression with specific anti-bodies, which function as protein-binding probes. In contrast to most microarray tech-nologies, in RPPAs the samples are immobilized on the chip instead of the probes. The chip is spotted with beads of the sample solution and nonspecific binding sites on the array are blocked. Then, the chip is stained with a protein-specific antibody that is la-beled with a fluorescence marker, incubated, and washed to remove unbound antibodies. A fluorescence detection system takes an image of the chip and measures the fluores-cence signal intensity for each spotted sample. Depending on the availability of specific antibodies, RPPAs can also detected protein modifications, e.g., phosphorylation at func-tionally relevant sites, which allows the profiling of the activity state of proteins.
RPPAs have been applied in a wide range of applications, e.g., to identify risk factors for liver diseases (Morales-Ibanez et al., 2016). We have also combined RPPAs with RNA microarrays for the integrated assessment of the effects of the NGC phenobarbital in the mouse liver (Braeuning et al., 2016). To generate the data used in this thesis, we used the ZeptoMARK system, which uses a specialized fluorescence reader called ZeptoREADER (Pawlaket al., 2002).
2.3 Mechanisms of chemical-induced carcinogenesis
Carcinogenesis is the formation of cancer, i.e., malignant tumors, which are character-ized by uncontrolled cell proliferation and the ability to spread throughout the organism. DNA damage, either naturally occurring or through endogenous and exogenous factors, is considered to be the leading cause of cancer formation (Bernsteinet al., 2013). The causes of DNA damage can be roughly categorized to be either physical, such as ultravi-olet and ionizing radiation, biological, e.g., infections with viruses, or chemical (IARC, 2014). However, long-term rodent carcinogenicity studies have repeatedly demonstrated that chemicals that show no genotoxic activity can also induce carcinogenesis. A study of approved pharmaceuticals found that 50% of the pharmaceuticals were rodent car-cinogens but only six were found to be genotoxic (Van Oosterhout et al., 1997). This demonstrates that many approved pharmaceuticals are NGCs, which are carcinogenic in rodents but show no DNA damaging potential. NGCs act through a range of different mechanisms, in contrast to GCs, for which the carcinogenic profile is determined by di-rect DNA damage (Fig. 2.3). The following section describes genotoxic carcinogenesis and illustrates proposed mechanisms of NGCs.
2.3.1 Genotoxic carcinogenesis
Genotoxic carcinogens induce cancer formation by causing DNA damage through direct interactions with the DNA. For this reason, they are also known as DNA-reactive carcino-gens. The DNA reactivity can occur either by the carcinogen itself or by DNA-reactive metabolites of the carcinogen. In contrast, NGCs act through secondary mechanisms without directly damaging the DNA. However, the distinction between GCs and NGCs is not absolute, as many GCs can also act through mechanisms other than DNA dam-age and NGCs may indirectly lead to DNA damdam-age (Benigni et al., 2013). Substances that change the DNA sequence are only a subset of genotoxins, as genotoxins can also cause DNA lesions, i.e., sites where the structure or the base-pairing of the DNA are disrupted. Types of DNA lesions include sites where one base is missing (abasic sites), single- and double-strand breaks, and covalent links between the two DNA strands (in-terstrand crosslinks). DNA lesions can have strong effects on cells by inhibiting DNA replication and transcription and require DNA repair, which is error-prone and can lead to mutations.
Most GCs or their metabolites are strong electrophilic reactants, which bind to nu-cleophilic sites in the DNA, RNAs, and proteins. The formation of carcinogen-DNA adducts is linked to the occurrence of mutations. Altered bases are fixated by erroneous
Figure 2.3: Genotoxic and nongenotoxic tumorigenesis. Genotoxic carcinogens can bind to the DNA to form DNA adducts and cause DNA mutations. Mutated tumor sup-pressor genes or oncogenes can lead to tumor formation. In contrast, nongenotoxic car-cinogens perturb the regulation of oncogenes and tumor suppressor genes by altering the function of regulatory genes, which promotes tumor growth. Red arrows indicate direct effects of the carcinogen, black arrows indicate indirect effects.
2.3 Mechanisms of chemical-induced carcinogenesis
base-pairing during DNA replication to form potentially initiated cells (Miller and Miller, 1981). Some GCs require metabolic activation to form electrophilic metabolites that can bind to the DNA and form DNA adducts. For example, most N-nitroso compounds, such as N-nitrosomethylurea or dimethylnitrosamine, require metabolic activation (Magee, 1969). The oxidative removal of one N-alkyl group produces a monoalkylnitrosamine, which is unstable and rearranges to form electrophilic ions. Well-known GCs include aflatoxin B1, a food contaminant that is a major risk factor for liver carcinomas (Kew, 2003), components of tobacco smoke (e.g., nitrosamines and polycyclic aromatic hy-drocarbons, Hecht (1999)), and ethanol, which is metabolized to several DNA damag-ing metabolites, e.g., acetaldehyde and reactive oxygen species (Boffetta and Hashibe, 2006).
Most GCs are not species-specific because DNA mutations are a general initiating factor in carcinogenesis. For this reason, a battery of bacterial and in vitro assays has been developed for the identification of substances with genotoxic effects. One regularly used genotoxicity assay is the Ames test, a bacterial reverse mutation assay (Ameset al., 1975). The Ames test detects genotoxins which cause point mutations and frameshifts. As the Ames test requires only a few days, it is a standard assay for the risk assessment of new chemicals. The Ames test has also been shown to identify a high percentage of known carcinogens (McCannet al., 1975).
The majority of known chemical carcinogens is genotoxic, and the two largest risk factors for lifestyle associated cancer are tobacco smoking and alcohol, which both act as GCs (Anand et al., 2008; Hernández et al., 2009). The accumulation of activating mutations in tumor-promoting oncogenes and silencing mutations in tumor suppressor genes is a critical feature of carcinogenesis. However, Hernández et al. (2009) report that 45 of the 371 chemicals (12%) considered to be carcinogenic to humans (IARC Group 1) or likely to be carcinogenic to humans (IARC Groups 2A and 2B) are not genotoxic and thus qualify as human NGCs. In consequence, a risk assessment driven purely by genotoxicity findings is not sufficient, and nongenotoxic carcinogenesis has to be considered in the development of new chemicals and drugs
2.3.2 Nongenotoxic carcinogenesis
NGCs are capable of promoting cancer formation without direct interaction with the DNA. In contrast to the MOA of GCs, where the induced DNA damage leads to muta-tions in tumor suppressor or oncogenes, the knowledge of the mechanisms of tumor in-duction and promotion of NGCs is sparse. NGCs show a wide range of tumor-inducing and tumor-promoting modes of action, such as peroxisome proliferation, immunosup-pression, endocrine modification, or cytotoxicity (Williams, 2001).
Melnicket al. (1996) argued that limiting the evaluation of NGCs to their nongeno-toxic effects is not sufficient, as some NGCs have been found to form DNA adducts and induce DNA mutations although they are Ames-negative. For example, tamoxifen, a drug used in the treatment of breast cancer, was long thought to be a rat-specific,
nongeno-toxic liver carcinogen due to negative in vitro tests for mutagenicity and an assumed hormonal perturbation mechanism (Tucker et al., 1984). However, it was later shown that tamoxifen is activated by rat and human liver microsomes to form DNA adducts (Pathak and Bodell, 1994), which provided evidence for a human relevance of tamoxifen induced liver cancers. In 2012, tamoxifen has been reevaluated by the IARC and was classified as a Group 1 carcinogen with sufficient evidence that tamoxifen is a carcino-gen in humans (IARC, 2012). The argument by Melnicket al.(1996) demonstrates that the classification into GCs and NGCs is not a clear distinction, as NGCs may initiate tu-mors through weak genotoxicity and GCs may promote initiated cells to form tutu-mors by nongenotoxic mechanisms (Benigniet al., 2013). Mostly, the term nongenotoxic is used to mean Ames negative because the Ames test is the most common assay to determine the genotoxic potential in chemical development. Accordingly, the term nongenotoxic is used to mean Ames negative in this thesis.
Genotoxic substances can be identified by a range of short-term bacterial andin vitro
tests and are excluded from further development. In contrast, NGCs are negative in these genotoxicity assays and are only detected in the lifetime rodent bioassays (LRB, Hernández et al. (2009)). However, the LRB is time-consuming, expensive, and no longer in line with new policies for the reduction of animal testing. For this reason, several projects and consortia have investigated NGCs in the last decade, among them the MARCAR project. These projects try to expand the knowledge of the mechanisms of nongenotoxic carcinogenesis to provide cancer assays that require fewer animals and less time than the LRB. For human cancer risk assessment, the LRB is complemented with data from 90-day toxicity studies and toxicological studies of chemical kinetics and disposition in rodents (Hernández et al., 2009). Human epidemiological data is also integrated into risk assessment when available. As NGCs act through a variety of mechanisms, the following sections provide an overview of some of the most prevalent mechanisms of human nongenotoxic carcinogenesis based on the reviews by Hernández
et al.(2009) and Silva Lima and Van der Laan (2000).
Endocrine modifiers
The glands that secrete hormones into the blood constitute the endocrine system. En-docrine modifiers induce or promote cancer mainly by modifying the levels of hormones or binding to hormone receptors. For example, 17β-estradiol and its metabolites can
bind to the estrogen receptor, which induces strong mitogenic effects by altering path-ways mediated by the estrogen receptor. Estrogen is assumed to be a major factor in cancer induction because it modulates transcription factors that regulate proliferation, differentiation, and apoptosis (Chen et al., 2008). Hormones that bind to the estrogen receptor are considered human NGCs (IARC, 1987). Other hormone receptors that are targets for human NGCs are the progesterone receptor, the aryl hydrocarbon receptor, and the thyroid hormone receptor. Some nongenotoxic substances can bind to multi-ple receptors, for exammulti-ple, the pesticide dichlorodiphenyltrichloroethane (DDT). DDT
2.3 Mechanisms of chemical-induced carcinogenesis
promotes hormone-dependent pathology, induces several cytochrome P450 genes, and is associated with increased incidences of lymphoma and lung cancers in workers exposed to the pesticide (Sierra-Santoyo et al., 2000). These multi-receptor binding substances can further complicate the human risk assessment of compounds. Ultimately, the im-balance of the hormonal control by estrogen, progesterone, or other hormones, coupled with cytotoxicity and other effects of NGCs is thought to be a major driver of tumor promotion.
Goitrogens, i.e., substances that interfere with iodine uptake and thus disturb the pro-duction of thyroid hormones in the thyroid gland, are the largest group of non-receptor mediated endocrine modifiers. This class includes anti-thyroid drugs as well as cen-tral nervous system-acting drugs (e.g., phenobarbital), chlorinated hydrocarbons (e.g., chlordane), and others (Hernández et al., 2009). These substances increase the periph-eral production of thyroid hormones and the secretion of thyroid-stimulating hormone, which have been linked to the induction of cell hypertrophy and hyperplasia and thyroid tumors in the LRB.
Cytotoxicity and chronic cell injury
In tissues where tumor incidences are found in LRBs, cytotoxicity and regenerative hy-perplasia are often observed after the administration of NGCs (Dietrich and Swenberg, 1991). The regenerative proliferation response to chronic cell injury leads to enhanced cell replication, which is associated with cancer initiation and promotion. Melnicket al.
(1996) suggested that this is due to the reduced time available for DNA repair mecha-nisms during cell division, which increases the probability of the fixation of endogenous or exogenous DNA damage. Examples for NGCs with a proposed cytotoxic MOA are the arsenic compounds dimethylarsinic acid and monosodium methane arsenate. These two also inhibit DNA repair and suppressp53, which supports the hypothesis that prema-ture replication fixates DNA damage in exposed cells (Cohenet al., 2006; Salnikow and Zhitkovich, 2008). In general, tumor promotion by inhibiting DNA repair and inducing cell cycle progression is often observed for cytotoxic NGCs (Safe, 1989; IARC, 1999; Stickneyet al., 2003).
Inhibition of gap junction intercellular communications
The maintenance of homeostasis, i.e., a stable state of the internal cell conditions, re-quires intercellular communication. Gap junctions, which are plasma membrane chan-nels that are formed by proteins, link adjacent cells and enable the exchange of small molecules (Kumar and Gilula, 1996). This communication between cells is important for the control of cell differentiation and proliferation. The disturbance of intercellular communication by the inhibition of gap junctions has been observed for many NGCs such as chlordane, DDT, phenobarbital, arsenic compounds, and peroxisome prolifera-tors (Hernández et al., 2009; Rivedal and Witz, 2005; Budunova and Williams, 1994;
Cowles et al., 2007). The exact mechanisms of the inhibition of gap junction commu-nications are not clearly established for most NGCs. Cowles et al. (2007) found that gap junctions can be affected by both direct (by DDT or Wy-14,643) and indirect (by tetrachloride) connexin inhibition, particularly connexin 32 in the liver of rats. This also demonstrates that NGCs often act through multiple of the presented MOAss.
Other mechanisms
In addition to the presented mechanisms, there are several others that have been proposed to contribute to carcinogenesis, e.g., peroxisome proliferation, immunosuppression, or oxidative stress (Hernándezet al., 2009). However, several nongenotoxic substances act through unique and not fully understood mechanisms. For example, carbon tetrachloride is activated by CYP genes to form trichloromethyl radicals, which form DNA adducts and disrupt cellular processes by inducing tumor necrosis and promoting growth fac-tors (Weber et al., 2003). Perchloroethylene (PCE) is a solvent that is used by the dry cleaning industry and is a nongenotoxic rodent carcinogen which is suspected to be less relevant to humans. PCE is metabolized to trichloroacetic acid, which induces hepato-cellular peroxisomes in rodent livers (Wernke and Schell, 2004). In general, peroxisome proliferators, such as Wy-14,643, are suspected to be rodent-specific, although the exact mechanism of carcinogenesis is not entirely understood.
Overall, NGCs are known to act through a wide range of mechanisms and often multi-ple mechanisms are involved. As NGCs cannot be detected by the Ames test and require extensive mechanistic and toxicological investigation, they remain an important factor in human risk assessment during the development of new chemicals and drugs. For this reason, toxicogenomics has gained much momentum during the last decade, and several large projects and consortia have started to investigate new methods for the early identi-fication of NGCs. The next chapter provides an introduction to toxicogenomics and the statistical and machine learning techniques that have been proposed as new short-term alternatives to the LRB.
Chapter 3
Introduction to toxicogenomics and
machine learning
Toxicogenomics uses automated high-throughput techniques, statistical and machine learning methods, and computational models to address toxicological research questions. The maturation of mRNA microarray technology provided toxicologists with powerful new instruments for measuring the effects of chemicals on living organisms. More re-cently, the advent of next-generation sequencing such as RNA-seq further enhanced the repertoire of tools for assessing adverse drug effects. These new technological oppor-tunities for toxicologists and life science researchers initiated the development of new bioinformatics methods that were needed to analyze the increasing amounts of data that current experiments produce. Databases of microarray data are growing fast, but batch effects due to different protocols in different groups interfere with a simple combination of datasets, which necessitates normalization and methods to account for batch effects. Also, researchers and manufacturers are adding more omics layers to the repository of high-throughput technologies. Mass spectrometry and RPPAs measure protein abun-dance, DNA methylation arrays generate epigenetic maps of DNA modification, and new, global expression microarrays include non-coding RNAs with regulatory functions. To make full use of multilayeredomicsdata, researchers need methods that can integrate these different types of molecular data and extract meaningful biological signals.
Whereas mechanistic toxicogenomics usesomicsdata to examine a single substance or a particular metabolic pathway, predictive toxicogenomics attempts to construct compu-tational models and signatures that recognize groups of compounds with similar adverse effects. Pharmaceutical companies and regulatory agencies explore predictive toxicoge-nomics as an economical alternative to long-term animal tests such as the LRB, which are expensive and time-consuming.
The first section of this chapter describes the bioinformatics methods that we used to process and analyze theomicsdata measured with microarray technologies. The second section provides an overview of the machine learning methods and validation strategies that we used in our predictive toxicogenomics studies. The last section reviews the cur-rent state of toxicogenomics and presents several studies that are relevant to this thesis.
3.1
Omics
data processing and analysis
The readouts of the microarray systems presented in Chapter 2 are fluorescence signal intensities. These raw signal intensities are subject to systematic, instrumental, and ran-dom noise, which introduces a bias that needs to be removed before the signal intensities can be used to perform quantitative analyses. Microarray data processing encompasses quality control to detect microarrays that did not function correctly and raw data normal-ization to eliminate systematic bias and make samples comparable. After the processing, statistical and numerical methods are applied to identify affected biomolecules and de-termine the effect strength. This section first provides an overview of quality control and normalization methods, followed by an outline of the statistical and numerical methods used for data analysis.
3.1.1 Microarray quality control
Quality control is an essential step for microarray data processing. Whereas system-atic and instrumental bias or batch effects can be addressed by experimental design and normalization, random noise in the spotting and hybridization process or experimental errors cannot be removed automatically. For example, spatial bias due to contaminations or sample handling mistakes that affect amplification and hybridization can confound experiments and introduce effects that are not a result of drug administration. Schuch-hardtet al.(2000) list fluctuations that can affect all steps of the probe, sample or array preparation, hybridization, and signal detection. Examples of fluctuations that need to be detected during quality control are failed PCR amplification, unequally distributed sample solution, hybridization failure due to temperature, time, or buffering conditions, and overshining of signals due to external factors.
Several software packages are available to detect these experimental artifacts and remove affected arrays from further analyses. For the MARCAR data, we used the
arrayQualityMetrics package by Kauffmannet al.(2009), which is generic and can
be applied to many types of microarrays independent of manufacturer. Specialized soft-ware for Affymetrix (Parman et al., 2016), Illumina (Dunning et al., 2007), or two-color cDNA arrays (Bunesset al., 2005) are also available. ThearrayQualityMetrics package provides several analyses for detecting potential outliers such as density plots, principal component analysis (PCA), pairwise distance matrices, or false color plots. Figure 3.1 shows examples of these common quality control plots that were generated
witharrayQualityMetrics. We used both visual inspection methods (e.g., false color
plots and PCA plots) and statistical cutoffs (e.g., pairwise distances and dynamic range) to identify and remove microarrays of insufficient quality from the analysis.
3.1 Omicsdata processing and analysis Ar ra y * Samples Controls PC1 PC2 −200 −100 0 100 200 −400 −200 0 200 400 (a) (b) (c) (d) 6 8 10 12 4 6 8 10 12 Ar ra y 123 4 5 6 Ar ra y 0.0 0.5 1.0 Distance 1 2 3 4 5 *6 * 1 2 3 4 5 6
Figure 3.1:Microarray quality control and normalization. (a) Pairwise distance heat maps. (b) PCA identifies arrays that show global deviations, possibly due to process-ing errors. The asterisk marks the outlier. (c) Array density plots identify arrays with perturbed overall intensity distributions. (d) Array density plot after normalization. In-tensities are normalized to have similar distributions.
3.1.2 Normalization methods for microarrays
Normalization is the scaling of microarray readouts to make data from multiple arrays comparable (see Fig. 3.1(d), Hill and Whitley (2003)). As stated before, microarray ex-periments are influenced by systematic and stochastic fluctuations, which can introduce noise into data and confound the analysis (Schuchhardt et al., 2000). Sources of these variations between samples include varying sensitivity to RNA degradation, systematic fluctuation of the labeling, small differences in hybridization parameters (e.g., tempera-ture, time, or sample volume), nonspecific binding, and saturation effects (Schuchhardt
et al., 2000). For two-color microarrays, the two conditions that are compared can be considered to be comparable because they were subject to the same preparation, hy-bridization, and detection process. In contrast, for one-color microarrays the raw signal intensities need to be normalized before they can be compared. To eliminate the noise in the data, systematic fluctuations are measured by control probes or statistically estimated.
Quantile normalization
Amaratunga and Cabrera (2001) introduced quantile normalization for the analysis of viral DNA microarrays, which achieves a robust readout standardization (Bolstadet al., 2003). Quantile normalization standardizes the distribution of probe intensities for all arrays in an experiment.
The procedure for quantile normalization is described by Bolstadet al.(2003) as fol-lows: (i) build a matrixX of dimension p×n, givennarrays of with pprobes, (ii) sort allncolumns ofX to getXsort, (iii) assign the mean across rows inXsort to each element in a row to get Xsort0 , and (iv) rearrange the values in each column to revertXsort0 to the original order inX, which givesXnormalized. Thus, quantile normalization represents the transformation x0i=F−1(G(xi)), wherexi is the readout of array i, G is the empirical distribution of each array, and F is the empirical distribution of the averaged sample quantiles (Bolstad et al., 2003). The distribution F can also be replaced by an arbi-trary reference distribution, such as the normal distribution. Quantile normalization is a complete data method, i.e., it combines information from all arrays in the normalization transformation.
Quantile normalization is a generic normalization algorithm that can be applied inde-pendent of the array manufacturer. We used quantile normalization to standardize RPPA readouts. For commercially distributed microarrays, specialized normalization software and methods are available that account for specific microarray designs.
Robust multi-array average normalization
Affymetrix microarrays include perfect match (PM) and mismatch (MM) probes to esti-mate noise by nonspecific binding. The normalization provided by the Affymetrix Mi-croarray Suite deducts the MM probe signals from the corresponding PM probe signals to calculate the probe set signal (Hill and Whitley, 2003). However, Irizarryet al.(2003) report that MM probes may be detecting both true signal and nonspecific binding. Thus, estimating the true signal as the difference between PM and MM probe signal adds noise without removing bias, whereas estimaing the true signal by dividing the PM signal by the MM signal results in a biased signal. For this reason, Irizarryet al.(2003) propose robust multi-array average (RMA) normalization, which discards all MM probe signals and estimates the true signal with a linear additive model that is based on three major ob-servations. First, PM probe signals grow approximately linear to concentration, second, signal variance is roughly constant, and third, probe-specific affinity is approximately additive. Iriza