BALKAN JOURNAL
OF APPLIED MATHEMATICS
AND INFORMATICS
(BJAMI)
GOCE DELCEV UNIVERSITY - STIP, REPUBLIC OF NORTH MACEDONIA
FACULTY OF COMPUTER SCIENCE
ISSN 2545-4803 on line
BALKAN JOURNAL
OF APPLIED MATHEMATICS
AND INFORMATICS
(BJAMI)
GOCE DELCEV UNIVERSITY - STIP, REPUBLIC OF NORTH MACEDONIA
FACULTY OF COMPUTER SCIENCE
ISSN 2545-4803 on line
Managing editor Biljana Zlatanovska Ph.D. Editor in chief Zoran Zdravev Ph.D. Lectoure Snezana Kirova Technical editor Slave Dimitrov Address of the editorial office
Goce Delcev University – Stip Faculty of philology Krste Misirkov 10-A PO box 201, 2000 Štip, Republic of North Macedonia
AIMS AND SCOPE:
BJAMI publishes original research articles in the areas of applied mathematics and informatics. Topics:
1. Computer science;
2. Computer and software engineering; 3. Information technology;
4. Computer security; 5. Electrical engineering; 6. Telecommunication;
7. Mathematics and its applications;
8. Articles of interdisciplinary of computer and information sciences with education, economics, environmental, health, and engineering.
BALKAN JOURNAL
OF APPLIED MATHEMATICS AND INFORMATICS (BJAMI), Vol 2
ISSN 2545-4803 on line Vol. 2, No. 1, Year 2019
EDITORIAL BOARD
Adelina Plamenova Aleksieva-Petrova, Technical University – Sofia,
Faculty of Computer Systems and Control, Sofia, Bulgaria
Lyudmila Stoyanova, Technical University - Sofia , Faculty of computer systems and control,
Department – Programming and computer technologies, Bulgaria
Zlatko Georgiev Varbanov, Department of Mathematics and Informatics,
Veliko Tarnovo University, Bulgaria
Snezana Scepanovic, Faculty for Information Technology,
University “Mediterranean”, Podgorica, Montenegro
Daniela Veleva Minkovska, Faculty of Computer Systems and Technologies,
Technical University, Sofia, Bulgaria
Stefka Hristova Bouyuklieva, Department of Algebra and Geometry,
Faculty of Mathematics and Informatics, Veliko Tarnovo University, Bulgaria
Vesselin Velichkov, University of Luxembourg, Faculty of Sciences,
Technology and Communication (FSTC), Luxembourg
Isabel Maria Baltazar Simões de Carvalho, Instituto Superior Técnico,
Technical University of Lisbon, Portugal
Predrag S. Stanimirović, University of Niš, Faculty of Sciences and Mathematics,
Department of Mathematics and Informatics, Niš, Serbia
Shcherbacov Victor, Institute of Mathematics and Computer Science,
Academy of Sciences of Moldova, Moldova
Pedro Ricardo Morais Inácio, Department of Computer Science,
Universidade da Beira Interior, Portugal
Sanja Panovska, GFZ German Research Centre for Geosciences, Germany Georgi Tuparov, Technical University of Sofia Bulgaria
Dijana Karuovic, Tehnical Faculty “Mihajlo Pupin”, Zrenjanin, Serbia Ivanka Georgieva, South-West University, Blagoevgrad, Bulgaria
Georgi Stojanov, Computer Science, Mathematics, and Environmental Science Department
The American University of Paris, France
Iliya Guerguiev Bouyukliev, Institute of Mathematics and Informatics,
Bulgarian Academy of Sciences, Bulgaria
Riste Škrekovski, FAMNIT, University of Primorska, Koper, Slovenia
Stela Zhelezova, Institute of Mathematics and Informatics, Bulgarian Academy of Sciences, Bulgaria Katerina Taskova, Computational Biology and Data Mining Group,
Faculty of Biology, Johannes Gutenberg-Universität Mainz (JGU), Mainz, Germany.
Dragana Glušac, Tehnical Faculty “Mihajlo Pupin”, Zrenjanin, Serbia
Cveta Martinovska-Bande, Faculty of Computer Science, UGD, Republic of North Macedonia Blagoj Delipetrov, Faculty of Computer Science, UGD, Republic of North Macedonia
Zoran Zdravev, Faculty of Computer Science, UGD, Republic of North Macedonia Aleksandra Mileva, Faculty of Computer Science, UGD, Republic of North Macedonia
Igor Stojanovik, Faculty of Computer Science, UGD, Republic of North Macedonia Saso Koceski, Faculty of Computer Science, UGD, Republic of North Macedonia Natasa Koceska, Faculty of Computer Science, UGD, Republic of North Macedonia Aleksandar Krstev, Faculty of Computer Science, UGD, Republic of North Macedonia Biljana Zlatanovska, Faculty of Computer Science, UGD, Republic of North Macedonia
Natasa Stojkovik, Faculty of Computer Science, UGD, Republic of North Macedonia Done Stojanov, Faculty of Computer Science, UGD, Republic of North Macedonia Limonka Koceva Lazarova, Faculty of Computer Science, UGD, Republic of North Macedonia Tatjana Atanasova Pacemska, Faculty of Electrical Engineering, UGD, Republic of North Macedonia
5
C O N T E N T
Todor Cekerovski, Dalibor Serafimovski and Marija Cekerovska
GEO - MAPPING OPPORTUNITIES FOR DETECTING
DIFFERENT TYPE OF WASTE AND TRANSFORMATION INTO
ECO-BUSINESS SOLUTIONS ... 7
Mladen Kiprijanov, Saso Gelev and Davor Vasielvski
ACQUIRING INFORMATION USING SOCIAL ENGINEERING ... 15
Lindita Loku, Mirjana Kocaleva, Biljana Zlatanovska, Natasha Stojkovikj and Aleksandar Krstev
ANALYSIS OF STUDENTS’ OUTCOMES FOR THE SUBJECT
MATHEMATICS AT UNIVERSITY LEVEL ... 23
Roman Golubovski and Gjorgji Markoski
EXPERT SYSTEM APPLICATION IN SUPPORT OF AUTOMATED ECG DIAGNOSIS .... 29
Ljupce Janevski, Aleksandar Velinov and Zoran Zdravev
ANALYZING TEACHERS BEHAVIOR USING
39
UDC: 004.43:378.147
ANALYZING TEACHERS BEHAVIOR USING
MOODLE DATA AND BIG DATA TOOLS
Ljupce Janevski, Aleksandar Velinov and Zoran ZdravevAbstract.In this research, we present a new waterfall model for analysing Big Data from Moodle Database and Logs. We analyse the data from the Moodle e-learning system at the University Goce Delcev in Stip. The idea is to get knowledge about the behaviour of teachers and to make clustering in relation to the activities they had on the platform. We also show the tools that we have used to analyse Big Data as well as the clustering tools. The main goal with this analysis is to improve the teaching process by developing specific methods that will contribute to the improvement of student success.
Keywords: Big Data, Moodle, Analysis, Teachers Behaviour. 1. Introduction
The term “Big Data” refers to any set of data [1] that is so large or so complex that conventional applications are not adequate to process them. The term also refers to the tools and technologies used to handle “Big Data”. Examples of Big Data include the amount of data shared in the Internet every day, YouTube videos viewed, twitter feeds and mobile phone location data. In recent years, the data produced by learning environments have also started to get big enough raising the need for Big Data technologies and tools to handle them.
Big data is not a single technology but a combination of old and new technologies that helps companies gain actionable insight. Therefore, big data is the capability to manage a huge volume of disparate data, at the right speed, and within the right time frame to allow real-time analysis and reaction. Big data is typically broken down by four characteristics [2]:
• Volume - how much data,
• Velocity - how fast that data is processed,
• Veracity-the quality of the data available,
• Variety - the various types of data.
These characteristics are called the four Vs of Big Data. Big data can be analysed to find associations, patterns and trends, and to get knowledge.
Big Data [3] can be defined as an environment comprising of tools, processes, and procedures that fosters discovery with data at its centre. This discovery process refers to our ability to derive business value from data and includes collecting, manipulating, analysing and managing data.
We are talking about four discrete properties of data that require special tools, processes, and procedures to handle:
• Increased volumes (to the degree of petabytes, and so on)
• Increased availability/accessibility of data (more real time)
• Increased formats (different types of data)
• Increased messiness (noisy)
Due to the increased volumes of data, they cannot be analysed with the standard database processing techniques. This requires special tools for Big Data analysis [4] that have implemented various methods for faster processing and retrieval of results. These data are available and real-time analysis can provide knowledge that can enhance the learning process in the case of educational data, for example. This data may come in different formats. Some of them are structured while others are semi-structured and unstructured. The method of analysing structured data is much easier in terms of unstructured and semi-structured data. In our analysis, we often have to combine more of these data types in order to get better results.
40
The big data in education is a particularly interesting area. These data often come from the learning management systems (LMS). By analysing this data, we can extract knowledge that can help us to improve the learning process, to improve the courses and the way in which the courses are organized. In this way, we can determine what is good or what is bad and, with this, we can change the educational process. This is very useful for teachers. Using big data analysis, teachers can reveal how the teaching methods affect the behaviour of students. The interesting information that can be obtained from the analysis is as follows: number of downloaded resources, number of submitted tasks, students activity on courses and so on. This is a good feedback for teachers about their work. Teachers can discover new methods using good practices that contribute to greater activity and better student success [5]. According to student activities (for example, homework assignments), we can discover which learning resources are really good for mastering the material and which resources need to be improved, upgraded, or what new resources need to be added. In this way, pedagogical approaches can be considered when teaching the course.
In this section, we explain the notion of Big Data as well as the possibility of improving teaching by analysing this data. In Section 2 of this paper, we describe the Big Data that we used for our research. Specifically, in this section we describe the Moodle database that we used, the tables that could be domain of interest, size, etc. In Section 3, we give a description of the tools that we use for Big Data analysis: Cloudera Hadoop Distribution, Weka for Big Data, Anaconda Navigator, Apache Spark etc. In Section 4, we give a description of the created temporary tables that we have used to analyse the behaviour of teachers. The process for analysing the behaviour of teachers is given in Section 5. Section 6 contains the conclusion of our work.
2. Moodle Data
Moodle is an e-learning platform that is designed to offer a system that can be used by teachers, students and administrators to create courses, to add digital content into it and to make that content available for students [6]. Moodle is one of the most used systems for e-learning. The two most important features of Moodle are modules and resources [7]. The modules allow interaction with the system. There are several modules in Moodle such as Assignments, Glossary, Book, Forum, Quiz, Lessons, Chats, Choices and so on. The modules are integrated in the platform. In our research, we use the modules to discover the activity of teachers, for each module separately and later the total activities.
We have analysed the database of the Moodle e-learning system at the Goce Delcev University in Stip. It has MySQL database with more than 300 tables that contain data of 7 years and its size is about 13GB. We have Big Data for a longer period of time. It is a good basis for analysing and extracting knowledge about teachers’ behaviour.
In the first step of this research, we selected the tables that could help us to discover the activity of teachers on the platform. The tables that we used in our research are:
– mdl_logstore_standard_log - All visitor interactions are logged in this table including the teachers’ actions.
– mdl_user - Each Moodle user has an entry in this table (including information about teachers) – mdl_role_assignment - The user role in Moodle
3. Big Data Analytics Tools
Based on the popularity and usability according to [8], we have listed the following ten open source tools as the best open source big data tools in 2019: Hadoop, Apache Spark, Apache Storm, Cassandra, RapidMiner, MongoDB, R Programming Tool, Neo4j, Apache SAMOA and HPCC. Some of the top tools are listed below.
For the purpose of this research, we investigated the Cloudera Hadoop [9].
Cloudera is an open source platform for data engineering, data warehousing, machine learning and analytics that runs in the cloud or on premises. Cloudera started as a hybrid open-source Apache Hadoop distribution, CDH (Cloudera Distribution Including Apache Hadoop) that targeted enterprise-class deployments of that technology.
Hadoop is a framework that allows distributed processing of big datasets across clusters of networked computers using simple programming models. The key component of Hadoop framework is
41
HDFS (Hadoop Distributed File System), which can store a huge amount of structured, semi-structured and unstructured data. MapReduce is the second core component of this framework and it represents the processing layer, which programming model is designed for handling large volumes of data in parallel by dividing the work into a set of independent tasks. Querying and analysis of data stored in HDFS is provided by Hive, powerful data warehouse infrastructure software built on top of Hadoop. Hive provides SQL-like language called HiveQL for querying the structured data. With the increasing popularity of cloud computing, we can think of Hadoop in the cloud. This “Hadoop in the cloud” paradigm denotes the execution of Hadoop clusters on resources offered by a cloud provider [10]. The cloud instance is identical to a server to which we access remotely, with root access, some number of CPU cores, and some amount of disk space [10]. There are several reasons why to run Hadoop in the cloud [11] such as flexibility, speed of change, lower risk, worldwide availability, cloud provider features, capacity, efficiency and reduced cost. We can use some cloud services to use Hadoop in the cloud and analyse big data.Hadoop MapReduce is used to break down the job into smaller pieces that can be distributed across nodes in the Amazon EMR cluster [12]. The Amazon Simple Storage Service (S3) can be used as a data layer for Hadoop.
Weka is a Java based tool for processing large amount of data. It has a vast selection of algorithms that can be used in mining data. Weka [13] is a popular and comprehensive Data Mining workbench with a well-known and intuitive interface. It supports only sequential single-node execution. Hence, the size of the datasets and processing tasks that Weka can handle within its existing environment is limited both by the amount of memory in a single node and by sequential execution. To overcome this, the DistributedWekaSpark can be used. It is a distributed framework for Weka, which maintains its existing user interface. The framework is implemented on top of Spark, a Hadoop-related distributed framework with fast in-memory processing capabilities and support for iterative computations. By combining Weka’s usability and Spark’s processing power, DistributedWekaSpark provides a usable prototype distributed Big Data Mining workbench that achieves near-linear scaling in executing various real-world scale workloads - 91.4% weak scaling efficiency on average and up to 4x faster on average than Hadoop [13].
Anaconda Navigator is one of the many open source platforms that facilitate the use of open source programming languages (R, Python) for large- scale data processing, predictive analytics, and scientific computing. The open-source Anaconda Distribution [14] is the easiest way to perform Python/R data science and machine learning on Linux, Windows, and Mac OS X. With over 11 million users worldwide, it is the industry standard for developing, testing, and training on a single machine, enabling individual data scientists to:
Manage libraries, dependencies, and environments with Conda;
Develop and train machine learning and deep learning models with scikit-learn, TensorFlow, and Theano;
Analyze data with scalability and performance with Dask, NumPy, pandas, and Numba; Visualize results with Matplotlib, Bokeh, Datashader, and Holoviews.
Apache Spark [15] has emerged as a widely used open-source engine. Spark is a fault-tolerant and general-purpose cluster computing system providing APIs in Java, Scala, Python, and R, along with an optimized engine that supports general execution graphs. Moreover, Spark [16] is efficient at iterative computations and is thus well suited for the development of large-scale machine learning applications.
4. Creating Temporary Tables Using Moodle Dataset
In order to facilitate the work for getting the activity of teachers in Moodle, we created temporary tables.
ANALYZING TEACHERS BEHAVIOR USING MOODLE DATA AND BIG DATA TOOLS
42
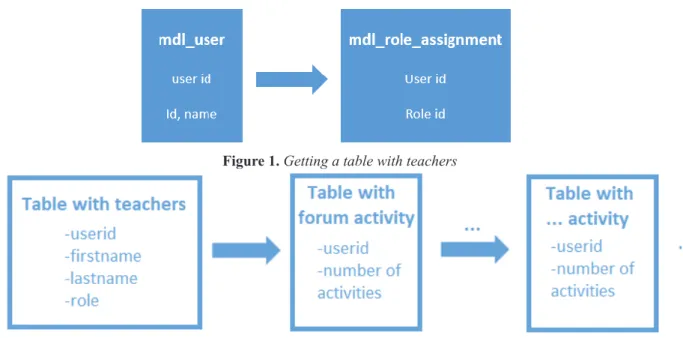
Figure 1. Getting a table with teachers
Figure 2. Workflow for obtaining all activities of the teachers
First, we created a table with all teachers. For this purpose, we used “mdl_user” and “mdl_role_ assignments” tables that are associated with “userid” attribute (Figure 1). We selected only those users who have the role of a teacher using the “mdl_role_assignment” table. With this, we got a new table with attributes “userid”, “firstname”, “lastname” and “role”. Using the tables from the database, especially the table with logged user activities (mdl_logstore_standard_log), we created temporary tables that contain the data for individual users for a certain activity on some module. We have investigated teacher activity for various Moodle modules such as Forums, Lessons, Glossary, Assignments, Survey, Quizzes, Choices, Chats, Wikis and Books. After this, we joined the table that contains the teachers and the tables with the teacher module activities using the queries and “userid” attribute in all tables (Figure 2). With this, we got a table with all teachers’ activities.
5. Teachers Behavior Analysis
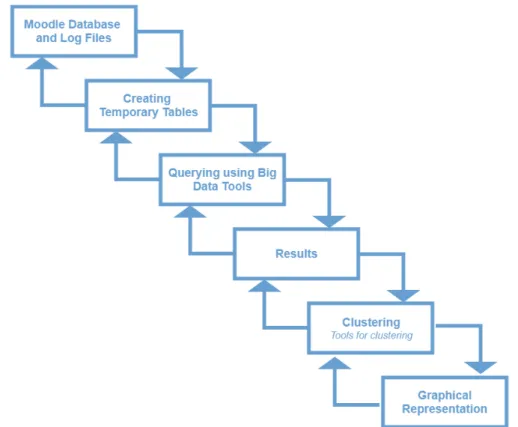
To analyze the behavior of teachers using Moodle data, we present a new waterfall model (Figure 3). In [17], we can see a more general framework for analysis of Big Data from the Moodle Database. With our waterfall model, we facilitate the process of analysis by introducing temporary tables, which after processing will give us results for the behaviour of teachers. According to some research [18], the process of data pre-processing is considered the most crucial phase in the whole data analytics process and it can take more than a half of the total time spent in solving the data mining problems. Before that, we also did some exploring of the tables from Moodle database, so we can make a decision which one to be used as a basis for constructing our dataset. This is the first phase from the new waterfall model (Figure 3.) that is mentioned in Section 2 of this paper. In the second phase, we created temporary tables, which is mentioned in Section 4 of this paper. The third phase is analysis of Big Data with tools such as Hadoop, Cloudera Distribution, Hive, Anaconda Navigator and Apache Spark. We got the results and, based on the results obtained, we will cluster the records with Weka or Rapid Miner for Big Data. For clustering in Weka we can use more techniques such as simple k-means, X-means, DBSCAN, OPTICS, EM, hierarchical clustering etc. [18]. In RapidMiner we can use also the k-means method [19], X-means, k-medoids, DBSCAN, EM and SOM [20]. As in this case we do not have a large number of clustering samples, we can use these tools. If we have a large number of samples that need to be clustered, we can use tools for Big Data clustering such as Apache Mahout, Radoop and SOMOA framework [19]. After the clustering process, we will perform graphical representation of the clusters. This is the last phase of the new waterfall model.
Ljupce Janevski, Aleksandar Velinov and Zoran Zdravev
ANALYZING TEACHERS’ BEHAVIOUR USING MOODLE DATA AND BIG
DATA TOOLS
5
Figure 2. Workflow for obtaining all activities of the teachers
First, we created a table with all teachers. For this purpose, we used “mdl_user” and “mdl_role_assignments” tables that are associated with “userid” attribute (Figure 1). We selected only those users who have the role of a teacher using the “mdl_role_assignment” table. With this, we got a new table with attributes “userid”, “firstname”, “lastname” and “role”. Using the tables from the database, especially the table with logged user activities (mdl_logstore_standard_log), we created temporary tables that contain the data for individual users for a certain activity on some module. We have investigated teacher activity for various Moodle modules such as Forums, Lessons, Glossary, Assignments, Survey, Quizzes, Choices, Chats, Wikis and Books. After this, we joined the table that contains the teachers and the tables with the teacher module activities using the queries and “userid” attribute in all tables (Figure 2). With this, we got a table with all teachers’ activities.
43
Figure 3. New waterfall model for Teachers’ Behaviour Analysis 6. Conclusion
In this paper, we presented a new waterfall model for analysing behaviour of teachers using Big Data from Moodle database and Big Data tools. We have used this model for analysis of the Moodle database of the e-learning system at the University Goce Delcev in Stip. The database contains data for a longer period of time (about 7 years) and its size is about 13GB. It is a good basis for analysis and knowledge extraction. When we have Big Data, as in the case, we cannot use the standard database processing techniques. For this purpose, we have used special tools for the analysis of Big Data. The research is ongoing and after we get the final results about teacher activities, we plan to perform clustering. The main purpose of the presented model is to extract knowledge from the activities of teachers. We can use the acquired knowledge in future to improve the teaching process and to create new educational methods.
References
[1] Saptarshi Ray. (2013). Big Data in Education: Gravity, the Great Lakes Magazine, pp. 8-10. [2] Zhou, Z. H., Chawla, N. V., Jin, Y., & Williams, G. J. (2014). Big data opportunities and challenges:
Discussions from data analytics perspectives [discussion forum]. IEEE Computational Intelligence Magazine, 9(4), 62-74.
[3] Sunila Gollapudi. (2013).Getting Started with Greenplum for Big Data Analytics: Published by Packt Publishing Ltd. Birmingham B3 2PB, UK.
[4] (2016) S. M. S. S. H. Salisu Musa Borodo, “Big Data Platforms and Techniques,” Indonesian Journal of Electrical Engineering and Computer Science, vol. 1, pp. 191-200.
[5] Drigas, A.S, Leliopoulos, P. The Use of Big Data in Education: IJCSI International Journal of Computer Science Issues.
[6] Moodle: About Moodle, https://docs.moodle.org/36/en/About_Moodle
[7] Costa, C., Alvelos, H., & Teixeira, L. (2012). The use of Moodle e-learning platform: a study in a Portuguese University. Procedia Technology, 5, 334-343.
ANALYZING TEACHERS BEHAVIOR USING MOODLE DATA AND BIG DATA TOOLS
44
[8] (2018).Top 10 Open Source Big Data Tools in 2019. [Online]. Available: https://www.whizlabs.com/ blog/big-data-tools/
[9] (2018) Cloudera. [Online]. Available: https://www.cloudera.com/
[10] Havanki, B. (2017) Moving Hadoop to the cloud. Sebastopol; USA: O’Reilly Media, Inc.
[11] Reyes-Ortiz, J. L., Oneto, L., & Anguita, D. (2015). Big data analytics in the cloud: Spark on hadoop vs mpi/openmp on beowulf. Procedia Computer Science, 53, 121-130.
[12] (2018)Apache Hadoop on Amazon EMR. [Online]. Available: https://aws.amazon.com/emr/ details/hadoop/
[13] Koliopoulos, A. K., Yiapanis, P., Tekiner, F., Nenadic, G., & Keane, J. (2015, June). A parallel distributed weka framework for big data mining using spark. In 2015 IEEE international congress on big data (pp. 9-16). IEEE.
[14] (2019) Anaconda. [Online].Available: https://www.anaconda.com/distribution/
[15] Zaharia, M., Chowdhury, M., Das, T., Dave, A., Ma, J., McCauley, M., Franklin, J.M., Shenker, S., Stoica, I. (2012). Resilient Distributed Datasets: A Fault-Tolerant Abstraction for In-Memory Cluster Computing. In USENIX Symposium on Networked Systems Design and Implementation (2-2).
[16] Shoro, A. G., & Soomro, T. R. (2015). Big data analysis: Apache spark perspective. Global Journal of Computer Science and Technology.
[17] Nikolovska, A., Velinov, A., Spasov, S., Zdravev, Z.(2018). Framework for Big Data Analytics of Moodle Data Using Hadoop in the Cloud, Eighth International Scientific Conference Computer Science, (3-8)
[18] Romero Morales C.(2012)., Applying data mining in Moodle, Department of Computer Sciences and Numerical Analysis, University of Cordoba.
[19] (2010) Oyelade, O. J., Oladipupo, O. O., & Obagbuwa, I. C, “Application of k-Means Clustering algorithm for prediction of Students’ Academic Performance,” (IJCSIS) International Journal of Computer Science and Information Security, vol. 7.
[20] Kurasova, O., Marcinkevicius, V., Medvedev, V., Rapecka, A., & Stefanovic, P. (2014, November). Strategies for big data clustering. In 2014 IEEE 26th international conference on tools with artificial intelligence (pp. 740-747). IEEE.
Ljupce Janevski Goce Delcev University,
Faculty of Computer Science, Bul. Goce Delcev 89-, 2000 Stip, Republic of North Macedonia E-mail address: [email protected]
Aleksandar Velinov Goce Delcev University,
Faculty of Computer Science, Bul. Goce Delcev 89, 2000 Stip, Republic of North Macedonia E-mail address: [email protected]
Zoran Zdravev
Goce Delcev University,
Faculty of Computer Science, Bul. Goce Delcev 89, 2000 Stip, Republic of North Macedonia E-mail address: [email protected]