Florida International University Florida International University
FIU Digital Commons
FIU Digital Commons
FIU Electronic Theses and Dissertations University Graduate School
9-7-2018
Improved Methods for Network Screening and Countermeasure
Improved Methods for Network Screening and Countermeasure
Selection for Highway Improvements
Selection for Highway Improvements
Md Asif RaihanFlorida International University, [email protected]
Follow this and additional works at: https://digitalcommons.fiu.edu/etd
Part of the Civil Engineering Commons, and the Transportation Engineering Commons
Recommended Citation Recommended Citation
Raihan, Md Asif, "Improved Methods for Network Screening and Countermeasure Selection for Highway Improvements" (2018). FIU Electronic Theses and Dissertations. 3846.
https://digitalcommons.fiu.edu/etd/3846
This work is brought to you for free and open access by the University Graduate School at FIU Digital Commons. It has been accepted for inclusion in FIU Electronic Theses and Dissertations by an authorized administrator of FIU Digital Commons. For more information, please contact [email protected].
FLORIDA INTERNATIONAL UNIVERSITY Miami, Florida
IMPROVED METHODS FOR NETWORK SCREENING AND COUNTERMEASURE SELECTION FOR HIGHWAY IMPROVEMENTS
A dissertation submitted in partial fulfillment of the requirements for the degree of
DOCTOR OF PHILOSOPHY in CIVIL ENGINEERING by Md Asif Raihan 2018
ii To: Dean John L. Volakis
College of Engineering and Computing
This dissertation, written by Md Asif Raihan, and entitled Improved Methods for Network Screening and Countermeasure Selection for Highway Improvements, having been approved in respect to style and intellectual content, is referred to you for judgment. We have read this dissertation and recommend that it be approved.
____________________________________ Mohammed Hadi ____________________________________ Xia Jin ____________________________________ Wensong Wu ____________________________________ Priyanka Alluri, Co-Major Professor ____________________________________ Albert Gan, Co-Major Professor
Date of Defense: September 7, 2018
The dissertation of Md Asif Raihan is approved.
____________________________________ Dean John L. Volakis College of Engineering and Computing ____________________________________ Andrés G. Gil Vice President for Research and Economics Development and Dean of the University Graduate School
iii
© Copyright 2018 by Md Asif Raihan All rights reserved.
iv DEDICATION
I dedicate this dissertation to my parents, Nilufar Fatema and Mohammad Farhad Hossain, parents-in-law Dr. Zinat Mahrukh Banu and Dr. Md. Anwarul Islam, to my wife
Shahrin Anwar, and my sons Tanzif and Tawfeeq for their unconditional love and support.
v
ACKNOWLEDGMENT
I thank Almighty Allah for favoring me to successfully complete this research work.
Dr. Priyanka Alluri, Assistant Professor, Department of Civil and Environmental Engineering, Florida International University, has been an excellent supervisor. She has always shared her exceptional engineering knowledge with me and inoculated the meaning of good values of life in me. Thank you very much, Dr. Alluri.
My mentor, teacher and guide Dr. Albert Gan, Professor, Department of Civil and Environmental Engineering, Florida International University, has been supportive to this work from its inception. He always made himself available for any research related discussion. His constructive criticism and suggestions, throughout the course of this work, was invaluable. He discovered my strengths and weaknesses and made me what I am today. I owe so much to you, Sir, you are really wonderful.
I would also like to thank all my committee members, Dr. Mohammed Hadi, Dr. Xia Jin and Dr. Wensong Wu for showing interests in my research. I sincerely appreciate their invaluable time for reading the dissertation and providing comments and suggestions to improve it.
I cannot forget Dr. Wu who taught me statistics. She inspired me and created interests in research in me.
The research associates at Lehman Center for Transportation Research (LCTR), Dr. Wanyang Wu, Mr. Haifeng Wang, and Dr. Kaiyu Liu, were always ready to help me.
I value the unconditional friendship with my colleagues at LCTR. They have been a source of inspiration during my stay at the university.
vi
I acknowledge the financial support of the Florida Department of Transportation for my research.
Finally, I would like to thank my parents Nilufar Fatema and Mohammad Farhad Hossain, my parents-in-law Dr. Zinat Mahrukh Banu and Professor Dr. Md. Anwarul Islam, my younger brother Shabib, my beloved wife Shahrin, and my gifts from God, my sons Tanzif and Tawfeeq for their support, encouragement and love.
vii
ABSTRACT OF THE DISSERTATION
IMPROVED METHODS FOR NETWORK SCREENING AND COUNTERMEASURE SELECTION FOR HIGHWAY IMPROVEMENTS
by Md Asif Raihan
Florida International University, 2018 Miami, Florida
Priyanka Alluri, Co-Major Professor Albert Gan, Co-Major Professor
Network screening and countermeasure selection are two crucial steps in the highway improvement process. In network screening, potential improvement locations are ranked and prioritized based on a specific method with a set of criteria. The most common practice by transportation agencies has been to use a simple scoring method, which, in general, weighs and scores each criterion and then ranks the locations based on their relative overall scoring. The method does not deal well with criteria that are qualitative in nature, nor does it account for the impacts of correlation among the criteria. The introduction of Analytic Hierarchy Process (AHP) provides agencies with a method to include both quantitative and qualitative criteria. However, it does not address the issue on correlation. This dissertation explores the use of both Analytic Network Process (ANP) and Fuzzy Analytic Network Process (FANP) for their potential capabilities to address both issues. Using urban four-lane divided highways in Florida for bicycle safety improvements,
viii
both ANP and FANP were shown to provide more reasonable rankings than AHP, with FANP providing the best results among the methods.
After the locations are ranked and prioritized for improvements, the next step is to evaluate the potential countermeasures for improvements at the selected top-ranked locations. In this step, the standard practice has been to use Crash Modification Factors (CMFs) to quantify the potential impacts from implementing specific countermeasures. In this research, CMFs for bicycle crashes on urban facilities in Florida were developed using the Generalized Linear Model approach with a Zero-Inflated Negative Binomial (ZINB) distribution. The CMFs were tested for their spatial and temporal transferability and the results show only limited transferability both spatially and temporally. The CMFs show that, in general, wider lanes, lower speed limits, and presence of vegetation in the median reduce bicycle crashes, while presence of sidewalk and sidewalk barrier increase bicycle crashes. The research further considered bicycle exposure using the bicycle activity data from the Strava smartphone application. It was found that increased bicycle activity reduces bicycle crash probabilities on segments but increases bicycle crash probabilities at signalized intersections. Also, presence of bus stops and use of permissive signal phasing at intersections were found to increase bicycle crash probabilities.
ix TABLE OF CONTENTS CHAPTER PAGE 1. INTRODUCTION ...1 1.1 Background ...1 1.2 Problem Statement ...3
1.3 Research Goal and Objectives ...5
1.4 Dissertation Organization ...5
2. LITERATURE REVIEW ...7
2.1 Network Screening Methods for Highway Improvements ...7
2.1.1 State-of-the-practice Methodologies ... 8
2.1.2 State-of-the-art Methodologies ... 9
2.2 Risk Factors Affecting Bicycle Safety and the Bicycle CMFs ...16
2.2.1 Bicycle Safety ... 17
2.2.1.1 Statistical Methods ... 17
2.2.1.2 Spatial Frameworks ... 24
2.2.1.3 Descriptive Data Analyses ... 29
2.2.1.4 Combination of Methods ... 30
2.2.2 Bicycle Crash Countermeasures and CMFs ... 33
2.2.2.1 Bicycle Lanes ... 33
2.2.2.2 Bicycle Tracks ... 37
2.2.2.3 Bicycle Boulevards ... 39
2.2.2.4 Wide Curb Lanes ... 39
2.2.2.5 Traffic Calming Measures ... 42
2.2.2.6 Roadway and Intersection Geometry ... 44
2.2.2.7 Crosswalks ... 46
2.2.2.8 Roadway Lighting ... 46
2.2.2.9 Parking Treatments ... 47
2.2.3 Crash Frequency Modeling ... 48
2.3 CMF Transferability ...53
2.4 Summary ...55
3. METHODOLOGY ...57
3.1 Network Screening ...57
3.1.1 Analytic Hierarchy Process (AHP) ... 57
3.1.2 Analytic Network Process (ANP) ... 62
3.1.3 Fuzzy Analytic Network Process (FANP) ... 67
3.2 Crash Modification Factor (CMF) Development ...72
3.2.1 Cross-sectional Analysis ... 74
3.2.2 Zero Inflated Negative Binomial (ZINB) Models ... 75
3.3 CMF Transferability ...78
3.3.1 Transferability Assessment ... 78
x
3.4 Summary ...81
4. DATA PREPARATION ...82
4.1 Network Screening ...82
4.1.1 Crash Analysis Reporting (CAR) System ... 83
4.1.2 Roadway Characteristics Inventory (RCI) ... 84
4.1.3 Strava Database ... 85
4.1.4 Florida Geographic Data Library (FGDL) ... 86
4.1.5 Florida Transit Information System (FTIS) ... 88
4.2 CMF Development ...89
4.2.1 Roadway Segment Data ... 89
4.2.2 Intersection Data ... 96
4.2.3 Bicycle Exposure Data ... 97
4.2.4 Crash Data ... 97
4.3 Summary ...98
5. ANALYSIS AND RESULTS ...99
5.1 Network Screening ...99
5.1.1 Analytic Hierarchy Process (AHP) ... 99
5.1.2 Analytic Network Process (ANP) ... 105
5.1.3 Fuzzy Analytic Network Process (FANP) ... 109
5.1.4 Comparison of Results ... 115
5.2 CMF Development ...120
5.2.1 Urban Two-lane Divided Segments ... 121
5.2.2 Urban Four-lane Divided Segments ... 125
5.2.3 Urban Six-lane Divided Segments ... 127
5.2.4 Urban Four-leg Signalized Intersections ... 130
5.2.5 Reflection on Strava Data ... 134
5.3 Transferability Assessment ...135
5.3.1 Spatial Transferability ... 135
5.3.2 Temporal Transferability ... 137
5.4 Summary ...139
6. CONCLUSIONS...141
6.1 Summary and Conclusions ...141
6.2 Research Contributions ...144
6.3 Recommendations for Future Research ...145
6.3.1 Network Screening ...145
6.3.2 CMF Development ...146
REFERENCES ...147
VITA……. ...169
xi
LIST OF TABLES
TABLE PAGE
Table 3-1: Values of Random Consistency Indices ...62
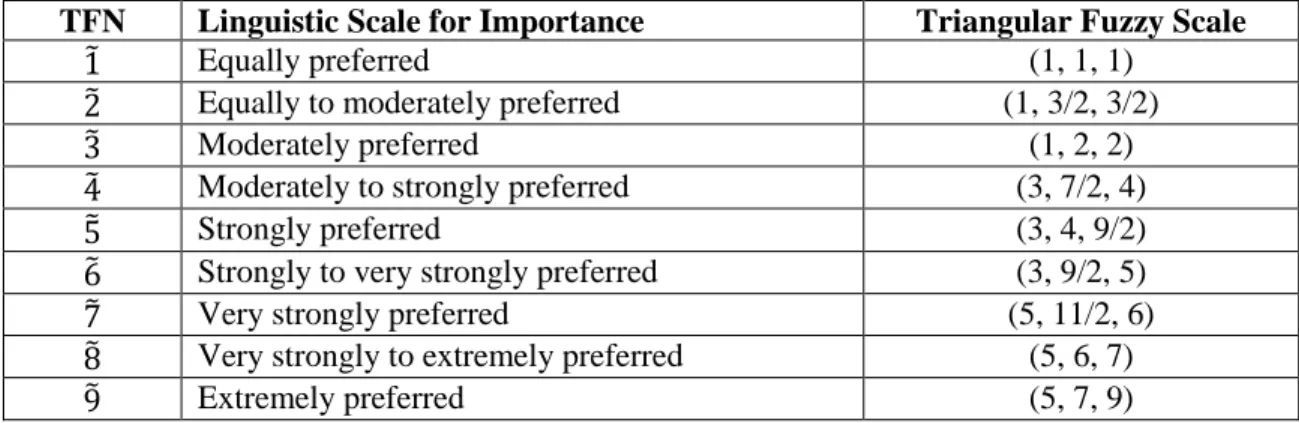
Table 3-2: TFN-linguistic Scale for Importance ...69
Table 4-1: Reclassified Land Use ...88
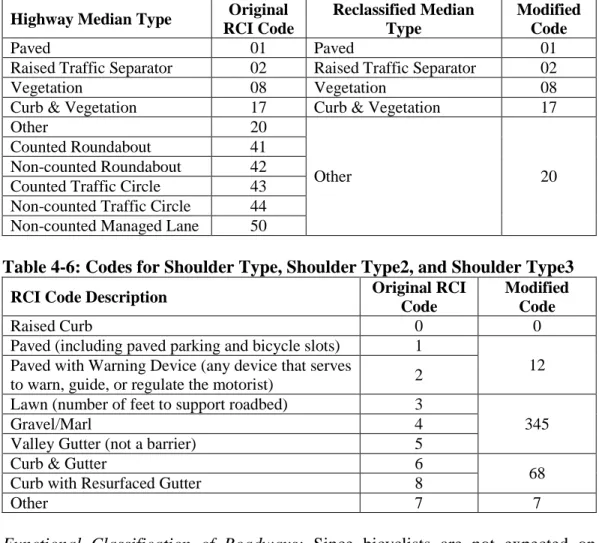
Table 4-2: RCI Variables Extracted for CMF Development ...90
Table 4-3: HSM Recommended Rounded Median Widths ...91
Table 4-4: HSM Recommended Rounded Lane Widths ...93
Table 4-5: Codes for Median Type ...94
Table 4-6: Codes for Shoulder Type, Shoulder Type2, and Shoulder Type3 ...94
Table 5-1: Pre-defined Scaling for Bicycle Volume ...102
Table 5-2: Pre-defined Scaling for Land Use ...103
Table 5-3: Cluster Level Priorities with Respect to Goal ...104
Table 5-4: Sub-cluster Level Priorities with Respect to Bicycle Crash ...106
Table 5-5: Sub-cluster Level Priorities with Respect to Bicycle Facility ...106
Table 5-6: Sub-cluster Level Priorities with Respect to Bicycle Volume ...106
Table 5-7: Sub-cluster Level Priorities with Respect to AADT ...106
Table 5-8: Sub-cluster Level Priorities with Respect to Auto Ownership ...107
Table 5-9: Sub-cluster Level Priorities with Respect to Land Use ...107
Table 5-10: Sub-cluster Level Priorities with Respect to Transit Stops ...107
Table 5-11: Expanded Supermatrix Framework ...108
Table 5-12: Lower Bound Cluster Level Priorities with Respect to Goal ...109
xii
Table 5-14: Upper Bound Cluster Level Priorities with Respect to Goal ...110
Table 5-15: Lower Bound Sub-cluster Level Priorities with Respect to Bicycle Crash .110 Table 5-16: Modal Sub-cluster Level Priorities with Respect to Bicycle Crash ...110
Table 5-17: Upper Bound Sub-cluster Level Priorities with Respect to Bicycle Crash ..110
Table 5-18: Lower Bound Sub-cluster Level Priorities with Respect to Bicycle Facility ...111
Table 5-19: Modal Sub-cluster Level Priorities with Respect to Bicycle Facility ...111
Table 5-20: Upper Bound Sub-cluster Level Priorities with Respect to Bicycle Facility ...111
Table 5-21: Lower Bound Sub-cluster Level Priorities with Respect to Bicycle Volume ...111
Table 5-22: Modal Sub-cluster Level Priorities with Respect to Bicycle Volume ...112
Table 5-23: Upper Bound Sub-cluster Level Priorities with Respect to Bicycle Volume ...112
Table 5-24: Lower Bound Sub-cluster Level Priorities with Respect to AADT ...112
Table 5-25: Modal Sub-cluster Level Priorities with Respect to AADT ...112
Table 5-26: Upper Bound Sub-cluster Level Priorities with Respect to AADT ...113
Table 5-27: Lower Bound Sub-cluster Level Priorities with Respect to Auto Ownership...113
Table 5-28: Modal Sub-cluster Level Priorities with Respect to Auto Ownership ...113
Table 5-29: Upper Bound Sub-cluster Level Priorities with Respect to Auto Ownership...113
Table 5-30: Lower Bound Sub-cluster Level Priorities with Respect to Land Use ...114
Table 5-31: Modal Sub-cluster Level Priorities with Respect to Land Use ...114
xiii
Table 5-33: Lower Bound Sub-cluster Level Priorities with Respect to Transit Stops ...114
Table 5-34: Modal Sub-cluster Level Priorities with Respect to Transit Stops ...115
Table 5-35: Upper Bound Sub-cluster Level Priorities with Respect to Transit Stops ...115
Table 5-36: Top 30 Prioritized Locations using AHP, ANP, and FANP Approaches ....116
Table 5-37: Scenario 1 - Comparison of Ranks from AHP, ANP, and FANP ...118
Table 5-38: Scenario 2 - Comparison of Ranks from AHP, ANP, and FANP ...118
Table 5-39: Descriptive Statistics for Segment Facility Types ...122
Table 5-40: Bicycle CMFs for Urban Two-lane Divided Segments ...126
Table 5-41: Bicycle CMFs for Urban Four-lane Divided Segments ...126
Table 5-42: Bicycle CMFs for Urban Six-lane Divided Segments ...128
Table 5-43: Descriptive Statistics for Urban Four-leg Signalized Intersections ...131
Table 5-44: Bicycle CMFs for Urban Four-leg Signalized Intersections ...133
Table 5-45: FDOT District-wise Urban Four-lane Divided Segments ...136
Table 5-46: Spatial TI Indices for FDOT Districts ...136
Table 5-47: Spatial GOF Indices for FDOT Districts ...136
Table 5-48: Temporal TI Indices for 2011-2012 and 2015 Periods ...137
Table 5-49: Temporal GOF Indices for 2011-2012 and 2015 Periods ...137
Table 5-50: Temporal D5 TI Indices for 2011-2012 and 2015 Periods ...139
xiv
LIST OF FIGURES
FIGURE PAGE Figure 2-1: Geographic Region in Melbourne, Australia, Selected for Detailed Case
Study Based on Spatial Analysis ...26
Figure 2-2: Bicycle Lanes in Chicago, IL ...33
Figure 2-3: Green-colored Pavement and Accompanying Signing in a Bicycle Lane Weaving Area in St. Petersburg, FL ...36
Figure 2-4: Bicycle Track ...38
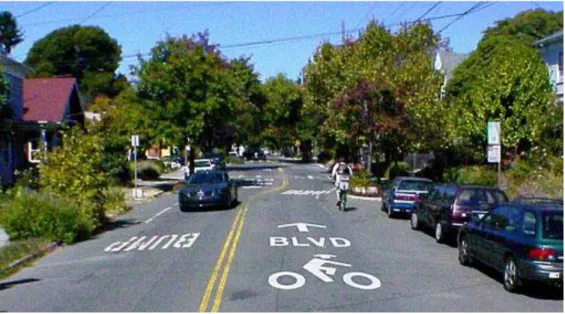
Figure 2-5: Bicycle Boulevard ...40
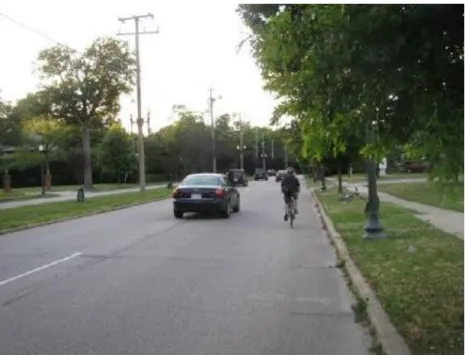
Figure 2-6: Wide Curb Lane ...41
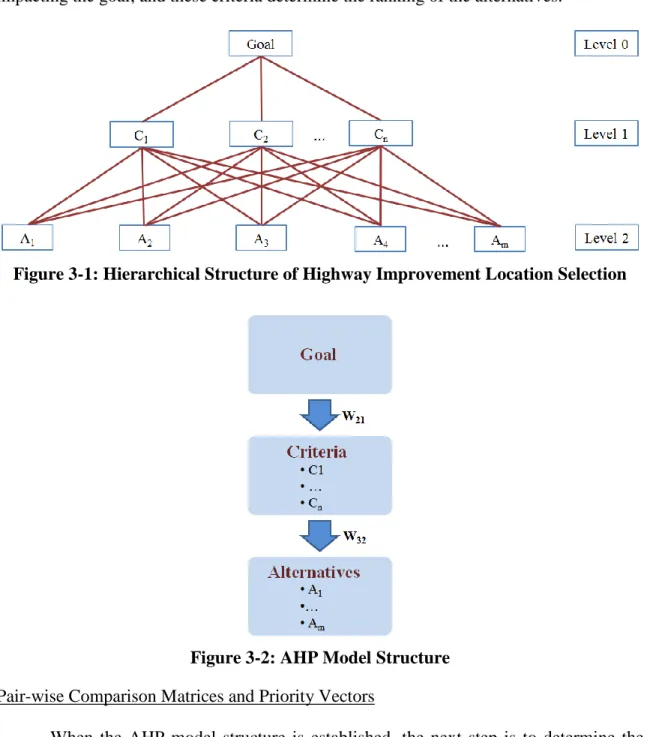
Figure 3-1: Hierarchical Structure of Highway Improvement Location Selection ...59
Figure 3-2: AHP Model Structure...59
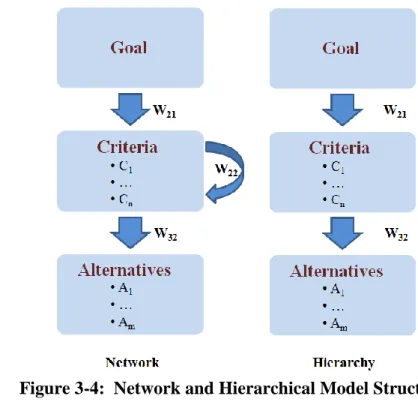
Figure 3-3: Difference between Hierarchy and Network Decision Making Process ...63
Figure 3-4: Network and Hierarchical Model Structures ...65
Figure 3-5: A Triangular Fuzzy Number ...68
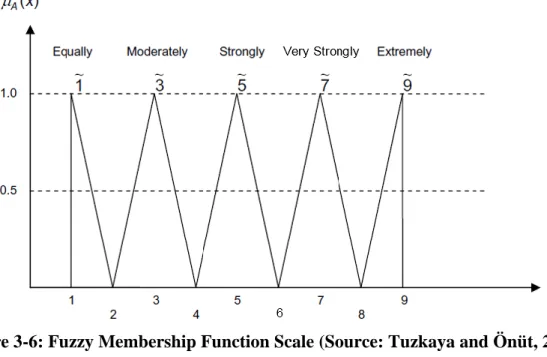
Figure 3-6: Fuzzy Membership Function Scale ...70
xv
LIST OF ACRONYMS AADT Annual Average Daily Traffic
AASHTO American Association of State Highway and Transportation Officials
ADTT Average Daily Truck Traffic AHP Analytic Hierarchy Process AIC Akaike Information Criterion ANP Analytic Network Process
B/C Benefit-cost
CMF Crash Modification Factor or Function DOT Department of Transportation
EI Environmental Impact
GAM Goal Achievement Matrix
GOF Goodness of Fit
ISS Innovation Support System
LRTP Long Range Transportation Plan MAD Mean Absolute Deviation
MCDM Multi Criteria Decision Making
MEB Modified Empirical Bayes
MLP Multi-Layer Prioritization MNB Modified Negative Binomial
MNL Multinomial Logit
MSPE Mean Squared Predicted Error MPB Mean Predicted Bias
xvi
MPO Metropolitan Planning Organization
MRZINB Multivariate Random-parameter Zero-Inflated Negative Binomial
NB Negative Binomial
NHTSA National Highway Traffic Safety Administration
OECD Organization for Economic Cooperation and Development OLS Ordinary Least-Square
RCI Roadway Characteristics Inventory REP Random Effect Poisson
REZIP Zero-Inflated Poisson with Random Effects R&D Research and Development
SPF Safety Performance Function TFN Triangular Fuzzy Number TI Transferability Index
TIP Transportation Improvement Program TNB Traditional Negative Binomial
TOPSIS Technique for Order Preference by Similarity to an Ideal Solution
v/c Volume to Capacity
VRU Vulnerable Road User
ZI Zero-Inflated
ZINB Zero-Inflated Negative Binomial ZIP Zero-Inflated Poisson
1
CHAPTER 1 INTRODUCTION 1.1Background
Transportation agencies ideally would like to improve all the locations that have a transportation problem. However, it is not feasible due to financial constraints. Transportation engineers and planners are, therefore, tasked with selecting the potential locations that provide maximum benefit for improvements. This is commonly termed as network screening. Network screening is the first and the most important aspect of making investment decisions.
In network screening, potential improvement locations are ranked and prioritized based on a specific method with a set of criteria. Transportation agencies have been screening highway locations using simple scoring and ranking method which assigns fixed weight to each of the criterion. In this method, each of the selected quantitative criterion is assigned a maximum score. The actual score of each criterion is then determined based on site-specific characteristics. Finally, for each location, scores from all the criteria are summed up to obtain the overall score which is then used in ranking. Top-ranked locations are then scrutinized using qualitative criteria to determine the final location list for potential funding.
The criteria for screening can either be quantitative or qualitative, with the qualitative criteria requiring subjective judgment. Moreover, some measures could be correlated requiring the screening method to consider their interdependencies. The simple scoring method, however, cannot efficiently address these issues, and thus agencies have
2
become more interested in advanced screening methods that are transparent, effective, accountable, and defendable.
After the locations are prioritized and selected for improvements, the next important step is to evaluate the potential countermeasures for improvements at the selected top-ranked locations. How changes in roadway characteristics affect safety is one of the critical issues to be considered. The safety impacts of roadway characteristics can be evaluated from expected changes in number of crashes after implementing a countermeasure. This can be attained by Crash Modification Factors (CMFs). A CMF is a multiplicative factor which is used to compute the expected number of crashes when a particular countermeasure is implemented at a specific site. A CMF greater than 1.0 indicates an expected increase in crashes, while a CMF less than 1.0 indicates an expected reduction in crashes when a particular countermeasure is implemented (Gross et al., 2010). The preferred methods for developing CMFs can be classified into two broad categories: before-after study, and cross-sectional study. Although before-after study is usually preferred over cross-sectional design, it is not always practical because there could be insufficient locations to allow for credible results (Gross et al., 2010). Cross-sectional studies are thus often adopted. The most common norm to develop CMFs using cross-sectional method is through Negative Binomial (NB) models. Crashes are rare and random events. Therefore, the crash data is expected to be zero inflated. In other words, several locations (i.e., roadway segments and intersections) may not have experienced any crashes during the analysis period. Traditional NB models may not be able to handle the datasets that have a large number of zero crash observations.
3
1.2Problem Statement
Network screening criteria can be quantitative and qualitative, and interdependent. For example, if an agency prioritizes highway locations based on safety, annual average daily traffic (AADT), and land use, it is quite clear that safety and AADT can be measured quantitatively in terms of crash frequency and number of vehicles per day, respectively. On the other hand, land use needs to be assessed qualitatively. In decision making that involves multiple criteria, the Analytic Hierarchy Process (AHP) is being widely used for its capability to organize quantitative and qualitative criteria in a systematic way, and provide a structured yet relatively simple solution to decision making problem (Skibniewski and Chao, 1992). Thus, the AHP can overcome the limitation of addressing qualitative criteria along with quantitative criteria.
AHP, however, structures the problem hierarchically; thus, it does not consider the impacts of interdependencies that may exist among the criteria. For example, if an agency screens highway locations based on AADT, volume to capacity (v/c) ratio, delay, truck volume, and truck percentage, it is quite clear that AADT and v/c ratio are interdependent, so are truck volume and truck percentage. Further, delay and v/c (thus AADT) are also interdependent as delay is a function of v/c (Raihan et al., 2016). It can thus be concluded that several of the criteria can essentially be interdependent. Therefore, a method that can take into account the impacts of such interdependencies will yield more meaningful and defendable results. In summary, a desirable network screening method should address:
qualitative and quantitative criteria,
interdependencies of the criteria, and
4
The method should also be simple and easily applicable for the transportation agencies to adopt and implement.
Once the locations are prioritized and ranked, the next step is to determine what to improve. Since traffic safety has enormous scopes, this research particularly focuses on bicycle safety improvements. Bicyclists are vulnerable road users who are at a greater risk for fatal or serious injury when involved in a crash with a motor vehicle. While bicycling accounts for only 1% of all trips taken in the United States (Pucher et al., 2011), bicycle fatalities constitute over 2% of all traffic fatalities (NHTSA, n.d.). Moreover, bicycle fatalities across the nation have increased by 31% from 2010 to 2015. During the same period, Florida has led the nation with over 750 bicycle fatalities, representing approximately 18% of the nation’s total (NHTSA, 2017). These grim statistics underscore the need for a thorough investigation of bicycle crashes and forms the rationale for this research.
Improving bicycle safety is a different challenge compared to improving the safety and mobility of motorized vehicular traffic because of the following reasons: bicycle crashes are rare and often severe; bicycle exposure is different from vehicle exposure and is difficult to quantify; and bicycle crash trends are quite distinctive and are dependent on land use, existing bicycle infrastructure, socio-economic factors, etc. A thorough analysis of these factors is therefore required to improve bicycle safety. The unavailability of data and the zero inflation in crash data pose additional challenge to address bicycle safety. Therefore, the following issues need to be considered while developing the CMFs:
roadway characteristics, i.e., the cross-sectional properties,
5
bicycle exposure,
the surrogate measures of bicycle exposure, and
the zero inflated crash data.
Furthermore, the applicability of a CMF depends on the data from which the CMF is estimated. It may vary by crash severity, crash type, and/or site condition (Gross et al., 2010). This instigates the question whether CMFs developed using state-wide data are applicable to different jurisdictions and for different time periods, i.e., are CMFs spatially and temporally transferable.
1.3Research Goal and Objectives
The goal of this research is to improve the traffic safety of Florida’s state roads by determining an appropriate network screening method, and quantifying the safety impacts of critical cross-sectional geometrics. The specific objectives of this research are:
1. to explore and determine the most suitable network screening method for bicycle safety improvements;
2. to quantify the impact of roadway characteristics, bicycle infrastructure, and bicycle exposure on bicycle safety; and
3. to explore the scope of spatial and temporal transferability of the CMFs for bicycle crashes.
1.4Dissertation Organization
This dissertation is comprised of six chapters. Chapter 2 presents a comprehensive literature review of the state-of-the-art and state-of-the-practice network screening methods, potential factors affecting bicycle crashes, existing bicycle CMFs, crash
6
frequency modeling, and studies on CMFs transferability. Chapter 3 discusses the potential network screening methodologies, and CMF development and transferability assessment methodologies adopted to attain the research objectives. Chapter 4 describes the detailed data collection and preparation efforts undertaken in this dissertation. Chapter 5 presents the analyses and discusses the results. The most suitable network screening method and Florida-specific bicycle CMFs are provided in this chapter. The possibility of CMFs transferability is also discussed. Chapter 6 concludes this dissertation by summarizing the contributions of this research and providing recommendations for future research.
7
CHAPTER 2 LITERATURE REVIEW
This chapter provides a comprehensive literature review on three topics: (a) network screening practices and methods; (b) risk factors affecting bicycle safety, and the bicycle crash countermeasures and CMFs; and (c) the transferability aspects of the CMFs. Section 2.1 discusses the state Departments of Transportation (DOTs’) network screening practices and the screening methods developed or adopted by different researchers. Section 2.2 focuses on different risk factors, causes, patterns, contributing factors associated with bicycle crashes, and bicycle crash countermeasures and CMFs. Finally, Section 2.3 presents the literature on transferability of CMFs.
2.1 Network Screening Methods for Highway Improvements
This section reviews different screening methods. It is divided into two broad sub-sections: (a) the network screening, i.e., project location prioritization practices that are either currently being applied or being considered for adoption by the state DOTs, Metropolitan Planning Organizations (MPOs), and local transportation agencies across the country; and (b) the state-of-the-art screening, i.e., prioritization methodologies.
A state-of-the-practice review of the screening methods revealed that none of the agencies focused on identifying improvement locations. However, a majority of the methods prioritize projects, rather than highway improvement locations. This is in contrast to the principle of differentiating the prioritization process into two categories: (a) screening for highway project locations with potential for improvement; and (b) prioritizing projects. Nonetheless, the approaches discussed to prioritize projects are to a
8
large extent applicable to screening highway improvement locations, and could potentially be used to screen the locations for improvements.
2.1.1 State-of-the-practice Methodologies
This section summarizes the prioritization methodologies currently being applied or being considered for adoption by the following 12 state DOTs: Delaware, Florida, Indiana, Missouri, North Carolina, Ohio, Oregon, Texas, Utah, Virginia, Washington, and Wisconsin, and by eight MPOs and local transportation agencies from North Central Pennsylvania, Hampton Roads, Fredericksburg Area, Broward, Winston-Salem Urban Area, Boston Region, Nashville Area, and Metrolinx. Gan et al. (2016) provides detailed discussion on the methodologies.
It is evident from the review that most of the transportation agencies are still relying on simple scoring and ranking algorithm for prioritizing the projects thus the project locations; and the criteria used for prioritization are quantitative and qualitative requiring subjective judgments. In addition to the simple scoring method, agencies were found to use rating scale, and the Technique for Order Preference by Similarity to an Ideal Solution (TOPSIS) approaches. Rating scale is just an alternate form of simple scoring. Instead of giving direct point to any project for any particular criterion, rating scale provides the point values in terms of a scale. The potential best criterion is given the highest rating and the potential worst criterion is given the lowest rating; the rest lies in between. Thus it makes the scale continuous and therefore easy to assign points to any project for that criterion. TOPSIS’s principle is that any chosen alternative should have the shortest distance from the positive-ideal solution and the farthest distance from the negative-ideal solution. Hence,
9
it eventually applies the simple scoring algorithm in the methodological steps. Thus, most of the state transportation agencies are confined with the limitations of simple scoring methodological approach.
2.1.2 State-of-the-art Methodologies
Researchers have used several methods including Analytic Hierarchy Process (AHP), Conjoint-based AHP, Analytic Network Process (ANP), Fuzzy-ANP (FANP), Multi-layer prioritization, Goal Achievement Matrix, etc. to prioritize locations for highway improvements. Studies that applied these methods are discussed in the following paragraphs.
Amponsah (2013) presented the potential of AHP in prioritizing highway projects. A hierarchical structure was constructed based on commonly known factors used by highway agencies for selecting projects. Social, Legal, Environmental, Economical, Political, and Technological (SLEEPT) influence of roads were incorporated in this study to form an integrated factor base (IFB) to prioritize the highway projects systematically. Candidate projects were prioritized in a descending order through AHP.
Outwater et al. (2011) presented a conjoint-based AHP to prioritize projects. They determined that the AHP is useful in developing weights for multiple goals; however, it has a limitation in determining the ways to achieve goals through quantitative performance measures. A conjoint-based approach specifically designed to complement an AHP weighting exercise was developed. Several performance measures were manifested for each goal and conjoint exercises were structured for each goal in such a way that it was able to elicit information about the relative importance of each of the performance
10
measures in achieving that goal. The number of conjoint exercises required for each goal depends on the number of performance measures being tested for that goal as well as the number of levels to be tested. In brief, AHP provided the platform to develop the weights of the goals for the transportation projects and conjoint method estimated stakeholders’ weights for each measure in their study.
The ANP methodology has been applied to solve decision making problems in various fields including business, construction, and transportation. For example, El-Abbasy et al. (2013) integrated ANP and Monte Carlo simulation to prioritize competitive contractors at the pre-bidding stage for highway projects. Sadeghi et al. (2012) used the ANP for supplier selection. Macura et al. (2011) applied ANP for prioritizing rail infrastructure investment projects in Serbia. Banai (2010) also utilized the ANP for light rail route selection in Memphis, Tennessee. The study highlighted the fact that the analysis of land use and transportation was facilitated by the ANP methodology. Tuzkaya and Önüt (2008) employed a fuzzy ANP-based approach to transportation-mode selection between Turkey and Germany. Cheng and Li (2005) demonstrated the potential of the ANP for construction project selection. Cheng and Li (2004) applied ANP for the contractor selection process. Azis (2003) compared ANP and AHP while studying the impact of highway construction, and found that ANP model is more stable and robust compared to the AHP model.
Mohanty et al. (2005) applied the fuzzy ANP approach for research and development (R&D) project selection case study. Ramík (2007) also proposed a decision algorithm using ANP and fuzzy inputs. The algorithm provides the platform of doing the pairwise comparisons using fuzzy numbers. The author discussed the extended arithmetic
11
operations with fuzzy numbers, and the procedure adopted to order the fuzzy relations to compare the outcomes.
Tuzkaya and Önüt (2008) conducted a case study to prioritize the different freight transportation modes between Turkey and Germany. Both qualitative and quantiative criteria were incorportated in the study. The research presented the potential of fuzzy analytic network process (FANP). Furthermore, the analysis results were compared with the results of the ANP. The results of the FANP and ANP procedure did not differ in prioritizing the transportation modes. However, the researchers stated that consideration of the upper or lower values of the ranking algorithm affect the final verdict of the decision maker in decision making process. As the study included imprecise data, giving lower and upper values with triangular fuzzy numbers was considered preferable over crisp numbers, and therefore, the FANP was considered to be more reliable compared to the ANP.
Dağdeviren et al. (2008) employed the FANP framework to evaluate work system safety and identify faulty behavior risk (FBR). Work system safety is a function of many factors, and is dynamic and complex. Thus the study used the FANP algorithm to determine the factors’ and sub-factors’ weights to calculate the FBR. The authors concluded that the methodology’s analytical framework made it possible to make better decision.
Guneri et al. (2009) used the FANP approach in selecting an appropriate location for a shipyard. Chen and Chen (2010) developed a conjunctive multi-criteria decision making (MCDM) approach based on decision making trial and evaluation laboratory (DEMATEL), FANP, and TOPSIS to develop an innovation support system (ISS) for Taiwanese higher education. The approach was able to address the dependent relationships among the measurement criteria. Later, Büyüközkan and Çifçi (2012) used the fuzzy
12
DEMATEL, FANP, and fuzzy TOPSIS to evaluate green suppliers. The study also proposed a case study for green supplier evaluation in a specific company, namely Ford Otosan.
Sevkil et al. (2011) proposed SWOT (i.e., Strengths, Weakness, Opportunities, and Threats) FANP methodology to rank the business factors for the Turkish airline industry. The study results showed that the SWOT FANP is a viable and highly capable methodology over the traditional SWOT methodology in providing invaluable insights for strategic management decisions for the airline industry in Turkey. The authors concluded that a better method was indeed needed for complex business situations triggered by continuous stringent constraints of global marketplace demands while optimizing multiple goals and considering inherent uncertainty. Yücenur et al. (2011) compared the fuzzy AHP and FANP approaches in global supply chains for supplier selection. The analyses from the two models selected the same supplier as the best alternative; however, ordering of the triggering factors for alternative selection differed in the two models. Bhattacharya et al. (2014) used the FANP framework for green supply chain performance measurement.
Ayağ and Özdemir (2012) evaluated machine tool alternatives through modified TOPSIS and alpha-cut based fuzzy ANP. The study utilized a fuzzy extension of ANP to address uncertain qualitative preferences as input in the decision making process and used modified TOPSIS to determine the rank of the competing machine tool alternatives in terms of overall performance. Although fuzzy logic is useful to model vague and uncertain judgments of the decision makers and is insensitive to noisy data, it is computationally intensive and time and resource consuming. Therefore, the modified TOPSIS algorithm was utilized to eliminate the time consuming fuzzy calculations of the FANP method.
13
However, the authors (Ayağ and Özdemir, 2007) proposed a FANP approach to select enterprise resource planning (ERP) software before.
Lu and Wang (2005) implemented Multi-Layer Prioritizing (MLP) method to prioritize intersections for improvements. Safety was integrated with operational considerations to generate a more rational prioritized list. The MLP method was employed with three criteria, benefit-to-cost ratio of safety performance, delay reduction, and existing delay. The authors adopted two priority categories, one with safety ahead of operations, and the other with operations ahead of safety. Accordingly, when safety was prioritized, the criteria for the first layer was benefit-to-cost ratio of safety performance, followed by delay reduction in the second layer, and existing delay as the criterion in the last layer. On the other hand, when operations was prioritized, delay reduction, safety, and existing delay were considered in the three layers, respectively. The intersection improvement projects were ranked and clustered into the layers based on similarity. The sequential process continued until the final priority list was obtained. However, the thresholds regarding choosing the layer criteria were beyond the scope of their study.
Berechman and Paaswell (2005) presented the Goal Achievement Matrix (GAM) methodology to prioritize transportation investment projects in New York. The following paragraphs briefly discuss the three phase methodology used by Berechman and Paaswell (2005) to evaluate, rank, and prioritize the projects in New York.
Out of a number of competing proposals, eight most visible and important projects that meet basic transportation and economic needs, and thus had the best chance to be considered for implementation were selected in the first phase. However, no comprehensive regional analyses were carried out to test the needs or to set the priority list.
14
The projects were mainly Manhattan-oriented-passenger-transportation-type projects. Cost-benefit analysis of transportation and economic development impacts was the second phase of the study. Transportation benefits were measured using two variables: expected number of riders at the completion of the project’s construction, and the amount of time saved per rider. A growth model with declining growth rate was used to measure the expected number of riders. The growth model is:
g(t)= g
1+ α(t-Tc) for t>Tc (2-1) where
g(t) = the growth in ridership over time (t), g = 0.523% (annual growth rate),
Tc = construction period, and α = 0.1 (attenuation rate).
The time savings variable included two aspects: direct time saved, and indirect time saved on other applicable transit lines. Transportation cost mainly comprised of operation costs and maintenance costs. Projects’ respective sources of funding always pose a question to assessing the cost of a project. Therefore, the funding sources were also considered during the study by factoring the Net Present Value (NPV) formula into debt service costs, which should be borne by the project. The NPV of transportation benefits for the Cost Benefit Analysis (COBA) was calculated as:
NPV(C,Tc,Bt) = − [∑ (TC c)+r.C (1+r)T Tc t=1 ]+∑Bt.[(1+g(t) (t-Tc))]+(R)-(MO)-(r.C) (1+r)t T+Tc t=Tc (2-2)
15 where
Tc = construction period, C = capital costs,
r = discount factor (5%),
r.C = debt service (assumed to be paid during construction period and then during life span of the project),
Bt = annual transportation benefits for effective year of project completion, g(t) = ridership growth function (shown in Equation 2-1),
R = fare box revenue,
MO = maintenance and operating costs, t = year index, and
T = life span of a project (assumed 50 years).
The equation is based on consumer and producer surplus, capital costs, debt service, and operating and maintenance costs. The study identified that the projects could not be justified by transportation benefits alone; however, most of the projects generated positive net economic development benefits. Thus, the final step of the three-phase methodology was to employ a GAM method to address this critical issue in a systematic manner and to rank, i.e., prioritize, projects unequivocally. Obviously, another crucial component of GAM method is the weights of the criteria. A modified Delphi approach was applied to determine the weights. A modified Delphi approach is a process in which a panel of experts determine the most appropriate criteria weights for the concerned projects.
Herbel et al. (2010) presented a variety of methods including benefit-cost analysis, ranking, and optimization approaches to prioritize safety improvement programs. They
16
emphasized on quantitative analysis procedures rather than qualitative judgment in prioritizing safety projects. However, they highlighted innovative design standards, project development effort, competing transportation needs, unfamiliarity of countermeasures, and constituent concerns as important hindrances in the project prioritization process. The authors concluded that a combination of project prioritization strategies and concerns of other agencies (e.g., DOT district or regional offices, FHWA division safety staff, etc.) should be taken into account to rank the projects for sequential selection and implementation.
Schweikert and Chinowsky (2013) stressed on including social concerns in prioritizing rural roads. They highlighted the fact that most prioritization processes utilize technical and economic benefit-cost analysis and completely ignore the most vulnerable needy communities that could gain the most from any roadway project. The existing prioritization processes consider rural road projects with low rate of return as “low priority”. This study proposed to incorporate a social impact score metric system combining rural mobility, rural accessibility, urban accessibility and mobility, and employment into the prioritization methodology.
2.2 Risk Factors Affecting Bicycle Safety and the Bicycle CMFs
This section presents a brief review of the literature on bicycle safety. The section is divided into three major sub-sections. The first sub-section includes a review of recent literature on different risk factors affecting bicycle crashes. It also includes studies that focus on the causes, patterns, and contributing factors associated with bicycle crashes. As researchers have used several statistical and spatial models to evaluate bicycle safety, this
17
sub-section is therefore organized according to the analytical methods applied in the reviewed literature. The second sub-section presents a review of literature on the safety performance of the existing engineering-related bicycle crash countermeasures. Particularly, the following countermeasures are discussed:
bicycle lanes,
bicycle tracks,
bicycle boulevards,
wide curb lanes,
traffic calming measures such as speed humps and road diets (i.e., lane reductions),
roadway and intersection geometry related countermeasures such as raised medians,
crosswalks,
roadway lighting, and
on-street parking treatments.
The third sub-section focuses on crash frequency modeling approaches. The pros and cons of different approaches are included in this discussion.
2.2.1 Bicycle Safety
2.2.1.1 Statistical Methods
This section discusses the studies that have applied statistical models including logit models, probit models, odds models, multivariate Poisson-lognormal models, and regression models to identify the factors affecting bicycle safety.
18 Logit Models
Klassen et al. (2014) analyzed the severity of bicycle crashes using spatial mixed logit model for Edmonton, Canada. A total of 424 intersection-related and 147 mid-block-related bicycle crashes that occurred during 2006-2009 were investigated. Corridor design, human, temporal, and environmental factors were considered as covariate categories. The authors did not identify any common factor contributing to bicycle crash severity at intersections or mid-block locations. However, the interaction between roadway and approach-control type, the existence of partial crosswalks and bicycle signs, and the bicyclist’s gender and age were identified as significant factors affecting bicycle crash severities at intersections. Roadway classification, on-street parking, and driver’s age were found significant for mid-block bicycle crash severities.
Moore et al. (2011) also differentiated the factors for intersection and non-intersection bicycle crashes. A total of 10,029 bicycle crashes that occurred from 2002-2008 in Ohio were analyzed. Standard multinomial logit and mixed logit models were developed to estimate the injury severity factors. Roadway geometry (horizontal curve and vertical grade), vehicle type (van, heavy truck, etc.), bicyclist safety devices (helmet), drug and alcohol usage, and driver insurance played a significant role in determining the injury severity of bicycle crashes at intersections and mid-block sections.
Zahabi et al. (2011) used an ordered logit model to investigate the effects of crash location, roadway type, vehicle movement, vehicle type, environmental conditions, population density, road connectivity, and land use mix on injury severity of pedestrians and bicyclists involved in collision with motor vehicles in the City of Montreal, Canada. Crashes at signalized intersections were found to be more dangerous for bicyclists.
19
Through movement of vehicles was found to have significant associations with sustaining an injury, i.e., increased the bicyclist’s injury severity. Transit access and median income were not statistically significant. The authors did not find population density and lighting to be significant factors. This result is contradictory to the result from a later study by Hamann et al. (2014) which considered these factors to be significant.
Eluru et al. (2008) applied a mixed generalized ordered response logit model to analyze pedestrian and bicyclist injury severity using data from the 2004 General Estimates System (GES). Age (the elderly are more injury-prone), speed limit (higher speed limits lead to more severe injuries), crash location (crashes at signalized intersections are less severe compared to those that occurred elsewhere), and time-of-day (dark conditions resulted in more severe injuries) were identified as influential variables affecting the non-motorist injury severity.
Kim et al. (2007) used a multinomial logit model to identify the factors leading to the four injury severity levels in bicyclists (i.e., fatal injury, incapacitating injury, non-incapacitating injury, and possible or no injury). The authors used crash data from 1997-2002 from North Carolina. Inclement weather, no streetlights, morning peak hour (06:00 AM to 09:59 AM), head-on crashes, speeding involving vehicle speeds over 30 mph, truck involvement, drunk driver, bicyclist age 55 or over, and drunk bicyclist were found to double the probability of a fatal injury in a bicycle crash. An estimated pre-crash speed of vehicles of more than 50 mph was found to increase the bicyclist’s probability of a fatal injury by more than 16 times. Compared to the bicycle crashes involving at-fault drivers, those involving at-fault bicyclists were identified to be more closely correlated with bicyclist injury severity.
20 Probit Models
Klop and Khattak (1999) examined the impacts of physical and environmental factors on the bicyclist injury severity. North Carolina Highway Safety Information System (HSIS) crash and inventory data from 1990-1993 for state-controlled, two-lane, undivided roadways were analyzed. Using the KABCO scale of injury severity distribution, two ordered probit models, one with all crashes and the other one restricted to only those in rural areas were developed [In the KABCO scale, K = fatal, A = incapacitating injury, B = non-incapacitating injury, C = possible injury, and O = property damage only]. Roadway characteristics such as speed limit, both straight and curved grades; driver- and bicyclist-related factors including impaired braking, acceleration, and maneuverability; environmental factors including fog and dark unlighted conditions showed increased severity trend, most probably due to their effect on driver reaction time and speed differentials at the time of impact. Annual average daily traffic (AADT), interaction between shoulder width and speed limit, and street lighting were found to be associated with decreased injury severity. Marginal effects of each factor on the likelihood of each injury severity class were identified. They highlighted the fact that in addition to vehicular traffic and scenery, decision makers should also review the frequency of both straight and curved grades on roadway segments, the presence of a shoulder, and the presence of foggy conditions in selecting state bicycle routes. The authors concluded that reducing grades and curves on new two-lane roadway construction might have additional benefits in terms of reduced bicycle crash severity.
21 Odds Models
Wang et al. (2015) investigated the factors associated with the severity of injuries sustained by bicyclists in bicycle crashes at unsignalized intersections. Bicycle crash data were extracted from Kentucky State Police’s Kentucky Collision Database for the period 2002-2012. The authors employed a partial proportional odds model. Stop-controlled intersections, one-lane approaches, helmet usage, and lower speed limits were found to be associated with decreased injury severity. On the other hand, uncontrolled intersections, older drivers and bicyclists (age > 55 years), child bicyclists (age < 16 years), foggy and rainy weather, inadequate use of lights in dark conditions, and wet road surface were found to increase bicycle injury severity.
Multivariate Poisson-Lognormal Models
Kaplan and Prato (2015) utilized a multivariate Poisson-lognormal model to analyze land use and network effects on frequency and severity of bicycle crashes in the Copenhagen region. A total of 5,349 bicycle crashes from 2000-2013 were extracted for analysis from the National Crash Database compiled by the Danish Road Directorate. Traffic exposure of non-motorized and motorized transport modes was controlled in the model. The effect of infrastructure (e.g., the presence of bicycle lanes or paths, the presence of different types of intersections) and land use (e.g., the characteristics of the area where the roads were located and their interactions with the aforementioned infrastructure) was evaluated, and heterogeneity and spatial correlation across links was accounted in the model framework. The model resulted in reduced crash rates as bicycle traffic increased and this happened more for fatal and severe injury bicycle crashes.
22
The study revealed that crash rates decreased with increasing traffic volume, and particularly severe crash rates reduced more with increasing level of congestion. Fatal and severe injury crashes were related to the presence of more heavy vehicles on the road. Bicycle lanes and segregated bicycle paths reduced the number of severe injury crashes, and the effects were more pronounced in suburban areas. Possible injury or no injury crashes were more concentrated at the Copenhagen city center; whereas, fatal and severe injury crashes were more associated with industrial zones. One-way streets were correlated with decreased number of crashes, although this relationship was found to be reversed for the city center. The model identified intersections to be more problematic than mid-block sections, and the difference was even more pronounced when located in suburban areas. Roundabouts were found to be the most problematic type of intersections. Giving the right-of-way, crossing a traffic signal, and crossing a roundabout triggered more bicycle crashes (Kaplan and Prato, 2015).
Regression Models
Boufous et al. (2012) examined the risk factors associated with the injury severity of bicyclists involved in traffic crashes in Victoria, Australia during 2004-2008. A logistic regression was used to ascertain the predictors of serious injury and fatal crashes. About 34% of 6,432 police-reported bicycle crashes resulted in severe injury. The multivariate analysis identified age (50 years and above), not wearing helmet, dark unlit roadway conditions, 70 kmph or above speed zones (43.5 mph), curved roadway sections, rural locations, head-on collisions, run-off-road crashes due to loss of control, striking the door of a parked vehicle on paths as the main factors increasing the severity of injuries in bicycle crashes.
23
Schepers et al. (2011) also investigated the safety of bicyclists at unsignalized intersections within built-up areas in Netherlands using crash data from 2005-2008. The study focused on the association between intersection design characteristics and bicycle crashes. The authors classified bicycle crashes into two types based on the movements of the involved motorists and bicyclists: type I - through bicycle-related crashes where the bicyclist had the right-of-way, i.e., bicycle on the priority road; and type II - through motor vehicle-related crashes where the motorist had the right-of-way, i.e., motorist on the priority road. Negative Binomial (NB) method was employed for the study. The probability of each crash type was found related to its relative flows and independent variables. Type I crashes were found to occur more at intersections with two-way bicycle tracks, well-marked, and reddish colored bicycle crossings; and these crashes are negatively related to raised bicycle crossings, i.e., speed humps and other speed-reducing measures. The intersections where the bicycle track approaches were 2-5 m away from the main carriageway were found to have lower crash probabilities. Roadway geometric factors such as raised medians did not have any significant impact on type II crashes. However, bicycle crashes were found to be less severe at intersections with speed-reducing devices.
Bíl et al. (2010) evaluated the critical factors in fatal crashes involving adult bicyclists (over 17 years) using multivariate regression analysis. The authors analyzed 1995-2007 crash data from the Traffic Police of Czech Republic. Inappropriate driving speeds, head-on collisions, and unlit roadways were identified as significant factors. Bicycle crashes were found to be more serious when associated with the consequence of bicyclist’s denial of right-of-way on crossroads. Male bicyclists were found to be more prone to fatal injuries compared to female bicyclists. The most vulnerable age group was
24
found to be 65 years and older. The authors also found that more crashes where bicyclists were at-fault resulted in a fatal injury compared to those where drivers were at-fault (598 vs. 370).
Oh et al. (2008) developed bicycle crash prediction models for urban signalized intersections. The authors conducted field surveys at 151 intersections in Inchon, Korea to identify the potential variables affecting bicycle crashes. The study revealed Poisson regression model to be most suitable for predicting bicycle crashes. The models identified the following factors (and their direction of association) to be the most critical for bicycle crashes at urban signalized intersections: AADT (+), presence of bus stops (-), sidewalk width (-), number of driveways (+), presence of speed restriction devices (-), presence of crosswalk (+), and industrial land use (+). In addition, the study emphasized the need to incorporate driver characteristics, roadway geometric design, and operational features in the analysis.
2.2.1.2 Spatial Frameworks
Researchers have traditionally been using spatial analysis to study the influence of socio-economic and demographic factors such as population, median household income, vehicle ownership, etc., on bicycle crashes. This section presents the recent studies that have analyzed bicycle safety spatially in ArcGIS. More specifically, studies focusing on the spatial analysis of bicyclist injury severity trends, bicycle crash clusters, and the spatial correlation between bicycle safety and several engineering, socio-economic and demographic factors are reviewed and summarized.
Lawrence et al. (2015) conducted a geospatial analysis of bicyclist injury trends in Melbourne, Australia. The objective was to identify reduced bicyclist injury areas. The study examined crash characteristics and cycling environment to better understand the
25
factors associated with bicycle safety. Two methods were employed: (a) cycling injury severity was calculated using a kernel density estimation method for the period 2000-2011 to study patterns in injury density across Melbourne over an extended time period; and (b) the absolute change in injury density was calculated between 2005 and 2011, which helped identify a geographic area which experienced a relatively more significant reduction in injury density. Figure 2-1 displays the spatial analysis results. The crash characteristics were then analyzed to identify the changes to the cycling environment that were associated with reduced injury rate. As shown in Figure 2-1, a geographical area to the southeast of Melbourne was found to have experienced a significant reduction in injury rate. It appeared that a combination of behavior and road infrastructure changes might be the contributing factors for the observed reduction. However, the lack of cycling exposure data prevented more conclusive remarks.
Chimba et al. (2014) also used GIS to geo-locate and cluster the pedestrian and bicycle crash locations on the roadway network in Tennessee. The study objective was to investigate demographic, socio-economic, roadway geometric, traffic, and land use characteristics affecting pedestrian and bicycle crash frequency. NB regression was employed to model the relationship between contributing factors and crashes. The findings were used to identify patterns of pedestrian and bicycle high crash locations in Tennessee. Population distribution by race, age group, mean household income, percentage in the labor force, poverty level, vehicle ownership, land use, number of lanes crossed by pedestrians or bicyclists, posted speed limit, and the presence of special speed zones were found to significantly influence the frequency of pedestrian and bicycle crashes.
26
Figure 2-1: Geographic Region in Melbourne, Australia, Selected for Detailed Case Study Based on Spatial Analysis (Source: Lawrence et al., 2015)
Siddiqui et al. (2012) applied a Bayesian spatial framework to model bicycle crashes to investigate the spatial correlation at Traffic Analysis Zones (TAZs) level in Hillsborough and Pinellas counties in Florida. Roadway characteristics, environmental, demographic, and socio-economic variables associated with bicycle crashes were used to develop the aggregate (i.e., macroscopic) models. The Bayesian models were compared with the traditional NB models to assess the effect of spatial correlation. Two Bayesian models were developed, one with only the random effects which did not account for the spatial correlation, and the other with both the random effects and spatial correlation to compare the results and explicitly identify the effect of spatial correlation. A Heuristic approach, Bayesian Poisson-lognormal, was used along with the traditional forward and
27
backward methods for variable selection while developing the non-Bayesian models. Florida Department of Transportation (FDOT) District Seven’s bicycle crash data for 2005-2006 was analyzed. It was found that variations contributed by spatial correlations are about 79% for bicycle crashes in the TAZs; thus, Bayesian models controlled for spatial correlation resulted in a better fit.
The authors considered the following eleven significant variables for the non-Bayesian NB model: (1) the total length of roadways with 15 mph posted speed limit, (2) total length of roadways with 35 mph posted speed limit, (3) total number of intersections per TAZ, (4) median household income per TAZ, (5) total number of dwelling units, (6) log of population per square mile of a TAZ, (7) percentage of households with non-retired workers but zero auto, (8) percentage of households with non-retired workers and one auto, (9) urban flag for a TAZ, (10) number of kindergarten through 12th grade enrollment, and (11) log of total employment number in a TAZ. The Bayesian model which did not account for spatial correlation identified similar variables as significant; whereas, median household income per TAZ, urban flag for a TAZ, and number of kindergarten through 12th grade enrollments were found statistically insignificant when spatial correlation was considered in the Bayesian model. Neighborhood-related variables did not reveal any significant difference in the two models.
A similar conclusion was drawn by Kim et al. (2007) except for institutional areas (i.e., schools) which were found to be associated with higher probabilities of incapacitating injuries. Moran’s I statistic identified the spatial orientation of kindergarten through 12th grade school enrollment as ‘random’ which explained the reason why it was not found significant in the model addressing the spatial relation by Siddiqui et al. (2012). Total
28
roadway length with 15 mph posted speed limit was found to be the only variable negatively associated with bicycle crashes. On the contrary, total roadway length with 35 mph posted speed limit was found to have positive association. A similar positive association between 30 mph and 40 mph was observed by Kim et al. (2007). The number of intersections was also found to be highly associated with bicycle crashes. A study by Carter and Council (2007) identified the similar relationship that about 48% of bicycle crashes are intersection-related in urban areas. The estimates for percent of households with non-retired workers with zero autos was found to be twice than that of non-retired workers with one auto in the model with spatial correlation, implying the latter is less critical than the former variable while other variables being controlled. Population density and total employment, the two possible surrogate measures for bicycle exposure, were also found to be positively associated with bicycle crashes. Siddiqui et al. (2012) concluded that Bayesian Poisson-lognormal models with spatial correlation to be the better one compared to other models that did not account for spatial correlation among TAZs. Quddus (2008) acknowledged the Bayesian framework as a more capable platform to account for spatial correlation and uncontrolled heterogeneity present in macro-level crash data.
Loo and Tsui (2010) conducted a spatial, circumstantial, and epidemiological study on bicycle crashes in Hong Kong, where bicycle is a minor mode of transport. The Traffic Accident Database System (TRADS) of Hong Kong police from 2005-2007 and a hospital based Road Casualty Information Database (RoCIS) were used. Spatial and statistical tools including buffer analysis, chi-square tests, analysis-of-variance, and binary logistic regression were used to analyze bicycle crashes. It was found that large proportion of crashes occurred on public roads near cycle tracks which triggered the careful
29
consideration of fully integrated cycle tracks in the new territories and sufficient safe road network connecting the new cycle tracks. Majority of the bicycle crashes were found to have taken place on relatively simple road environment which highlighted the lack of sufficient training and practice. The bicycle safety problem was found to be more serious on roads outside the cycle tracks as these locations experienced bicycle crashes often resulting in serious and fatal injuries. These bicyclists were mainly middle-aged males (> 45 years) riding bicycles on public roads and were using bicycles as their mode of transportation for daily trips. Proper education for all bicyclists focusing on the use of helmets and protective gears was stressed in the study.
2.2.1.3 Descriptive Data Analyses
Descriptive data analysis is one of the oldest and the most common techniques in crash data analyses. It provides an overall understanding about the safety situation and helps to identify the most probable predictors that affect crash frequency and severity. This section discusses several recent studies that have used the descriptive data analysis techniques to improve bicycle safety.
Johnson et al. (2013) studied the crash characteristics and risk factors associated with bicyclists and open vehicle doors in Victoria, Australia. Three complementary data sources were used in this study: a total of 1,247 police-reported bicycle crashes from 2011, a total of 401 hospitals’ emergency department presentations for the period 2000-2010, and a sample of video footage from a naturalistic study of commuter bicyclists in Melbourne from 2009-2010. Bicyclist-open vehicle door crashes accounted for about 8.4% of the police-reported crashes, and 3.1% of the hospital-recorded crashes. Male population (police report: 67.1%; hospital record: 65.8%) comprised the higher portion of the injured
30
bicyclists. Adults aged 18 years or older (police report: 97.5%; hospital record: 96.3%) were found to be the most vulnerable age group for bicyclists. A high percentage (93.1%) of crashes took place within 60 kmph (37.3 mph) speed zones. The study identified 13 door-related events with a rate of 0.59 events per trip from the naturalistic cycling study data; most drivers were found to not look in the direction of the bicyclist before opening their vehicle doors.
Schepers and Wolt (2012) investigated the single-bicycle crash types and their characteristics using a questionnaire survey conducted in the Netherlands. The survey targeted bicycle crash victims treated at an Emergency Care Department. The questionnaire had two types of questions: open-ended questions about the crash, and closed-ended questions focusing on possible direct causes, crash characteristics, and circumstances. About half of all single-bicycle crashes were found to be related to infrastructure: collision with an obstacle, run-off-road, bicycle skidding due to slippery road surface, the bicyclist was unable to stabilize the bicycle or stay on the bicycle because of an uneven road surface. Loss of control at low speed, forcing on the front wheel, poor or risky riding behavior, bicycle defects, and gust of wind were the other main contributing factors.
2.2.1.4 Combination of Methods
This section focuses on recent studies that have applied a combination of spatial methods and regression techniques in analyzing bicycle crash frequency and severity, and identifying bicycle crash causes, patterns, and contributing factors.
Hamann et al. (2014) examined bicycle crashes at intersections and non-intersections in Iowa for the period 2001-2011 to identify the influence of person, crash, environment, and population characteristics. The study employed descriptive statistics,