Borgonovi, F. and J. Pál (2016), “A Framework for the
Analysis of Student Well-Being in the Pisa 2015 Study: Being
15 In 2015”,
OECD Education Working Papers
, No. 140,
OECD Publishing, Paris.
http://dx.doi.org/10.1787/5jlpszwghvvb-en
OECD Education Working Papers
No. 140
A Framework for the
Analysis of Student
Well-Being in the Pisa 2015 Study
BEING 15 IN 2015
Organisation de Coopération et de Développement Économiques
Organisation for Economic Co-operation and Development 30-Sep-2016
___________________________________________________________________________________________
_____________ English - Or. English
DIRECTORATE FOR EDUCATION AND SKILLS
A FRAMEWORK FOR THE ANALYSIS OF STUDENT WELL-BEING IN THE PISA 2015 STUDY: BEING 15 IN 2015
Education Working Paper No. 140 By Francesca Borgonovi and Judit Pál
This working paper has been authorised by Andreas Schleicher, Director of the Directorate for Education and Skills, OECD.
Francesca Borgonovi, Analyst, EDU/SBS ([email protected]) Judit Pál, Statistician, EDU/ECS ([email protected])
JT03401754
Complete document available on OLIS in its original format
This document and any map included herein are without prejudice to the status of or sovereignty over any territory, to the delimitation of international frontiers and boundaries and to the name of any territory, city or area.
EDU /WK P (2016 )14 Unclassi fie d E ng lis h - O r. E
OECD EDUCATION WORKING PAPERS SERIES
OECD Working Papers should not be reported as representing the official views of the OECD or of its member countries. The opinions expressed and arguments employed herein are those of the author(s).
Working Papers describe preliminary results or research in progress by the author(s) and are published to stimulate discussion on a broad range of issues on which the OECD works. Comments on Working Papers are welcome, and may be sent to the Directorate for Education and Skills, OECD, 2 rue André-Pascal, 75775 Paris Cedex 16, France.
This document and any map included herein are without prejudice to the status of or sovereignty over any territory, to the delimitation of international frontiers and boundaries and to the name of any territory, city or area.
You can copy, download or print OECD content for your own use, and you can include excerpts from OECD publications, databases and multimedia products in your own documents, presentations, blogs, websites and teaching materials, provided that suitable acknowledgement of OECD as source and copyright owner is given. All requests for public or commercial use and translation rights should be submitted to [email protected].
Comment on the series is welcome, and should be sent to [email protected].
This working paper has been authorised by Andreas Schleicher, Director of the Directorate for Education and Skills, OECD.
--- www.oecd.org/edu/workingpapers
--- Copyright © OECD 2016
ACKNOWLEDGEMENTS
The authors would like to thank Andreas Schleicher, Yuri Belfali, Miyako Ikeda, Mario Piacentini, Esther Carvalhaes, Pablo Fraser, Willem Adema, Marco Mira-D’Ercole, Conal Smith, and Olivier Thevenon for valuable feedback on earlier drafts of this paper.
This paper was prepared by Francesca Borgonovi and Judit Pál from the OECD Directorate for Education and Skills, and edited by Rose Bolognini. Editorial and administrative support was provided by Marika Boiron, Hélène Guillou, and Camilla Lorentzen.
ABSTRACT
In 2015, PISA (the Programme for International Student Assessment) asked students to describe their well-being in addition to collecting information on students’ subject-specific skills. This paper provides a comprehensive overview and details the policy relevance of the following five dimensions of well-being covered in PISA 2015: cognitive, psychological, social, physical and material well-being. In addition, the paper outlines the underlying indicators of each dimension and their theoretical and analytical value for education policy. This paper concludes by identifying data gaps within the indicators and exploring how future cycles of PISA could bridge these gaps in order to provide a more comprehensive portrait of students’ well-being.
RÉSUMÉ
En 2015, PISA (le Programme international pour le suivi des acquis des élèves) a interrogé les élèves sur leur bien-être, en plus de sa collecte de données sur leurs compétences dans des matières spécifiques. Ce document propose un aperçu complet et une analyse détaillée de la pertinence stratégique des cinq dimensions du bien-être couvertes dans l’enquête PISA 2015 : le bien-être cognitif, psychologique, social, physique et matériel. En outre, il examine les indicateurs sous-tendant chacune de ces dimensions, ainsi que leur valeur théorique et analytique pour les politiques d’éducation. Enfin, il identifie les lacunes dans les données des indicateurs et étudie les possibilités d’y remédier dans les prochains cycles PISA afin de dresser un portrait plus exhaustif du bien-être des élèves.
TABLE OF CONTENTS
ACKNOWLEDGEMENTS ... 3
ABSTRACT ... 4
RÉSUMÉ ... 4
INTRODUCTION: THE IMPORTANCE OF STUDENTS’ WELL-BEING FOR EDUCATION POLICY ... 7
FRAMEWORK FOR THE ANALYSIS OF STUDENTS’ WELL-BEING IN PISA 2015 ... 11
THE COGNITIVE DIMENSION OF STUDENTS’ WELL-BEING ... 12
Subject-specific skills ... 12
Science self-beliefs ... 15
THE PSYCHOLOGICAL DIMENSION OF STUDENTS’ WELL-BEING ... 18
Overall life satisfaction ... 18
Students’ career and educational expectations ... 19
Achievement motivation ... 21
Test and learning anxiety ... 22
THE PHYSICAL DIMENSION OF STUDENTS' WELL-BEING ... 24
Physical activities ... 25
Eating habits ... 26
THE SOCIAL DIMENSION OF STUDENTS’ WELL-BEING... 29
Belongingness at school: Sense of belonging ... 29
Social learning interactions at school: Cooperative learning spirit ... 30
Relationship with teachers: Students’ perception of their teachers’ attitudes ... 31
Relationship with peers: Engagement with friends ... 32
Relationship with peers: Bullying ... 33
Relationship with parents: Parental support ... 35
Relationship with parents: Engagement with parents and guardians ... 36
THE MATERIAL DIMENSION OF STUDENTS’ WELL-BEING ... 37
The household environment ... 38
School resources: Human resources ... 41
Material resources at school: Physical infrastructure and learning resources ... 42
School environment: Extracurricular activities ... 46
A ROADMAP FOR FUTURE DEVELOPMENTS OF WELL-BEING MEASURES ... 49
Figures
Figure 1. Well-being dimensions in PISA 2015 ... 9
Figure 2. The cognitive dimension of students’ well-being ... 12
Figure 3. Instruments, science self-beliefs ... 16
Figure 4. The psychological dimension of students’ well-being ... 18
Figure 5. Instrument, overall life satisfaction ... 19
Figure 6. Instruments, students’ career and educational expectations ... 21
Figure 7. Instruments, achievement motivation ... 22
Figure 8. Instruments, test and learning anxiety ... 23
Figure 9. The physical dimension of students’ well-being ... 24
Figure 10. Instruments, physical activities ... 26
Figure 11. Instruments, eating habits ... 28
Figure 12. The social dimension of students’ well-being ... 29
Figure 13. Instruments, sense of belonging at school ... 30
Figure 14. Instruments, cooperative learning spirit ... 31
Figure 15. Instruments, students’ perception of their teachers’ attitudes ... 32
Figure 16. Instruments, engagement with friends ... 33
Figure 17. Instruments, bullying from the victim perspective ... 35
Figure 18. Instruments, parental support ... 36
Figure 19. Instruments, parental communication ... 37
Figure 20. The material dimension of students’ well-being ... 38
Figure 21. Instruments, parental occupation ... 39
Figure 22. Instruments, students’ home possession ... 40
Figure 23. Instruments, work in the household/work for pay ... 41
Figure 24. Instruments, teacher shortage ... 42
Figure 25. Instruments, teacher’s qualification ... 42
Figure 26. Instruments, physical infrastructure and educational resources ... 45
Figure 27. Instruments, computer availability ... 46
A FRAMEWORK FOR THE ANALYSIS OF STUDENT WELL-BEING IN
THE PISA 2015 STUDY:
BEING 15 IN 2015
INTRODUCTION: THE IMPORTANCE OF STUDENTS’ WELL-BEING FOR EDUCATION POLICY
1. As the world prepared to celebrate a new millennium, all the while fearing the collapse of the digital infrastructure, a cohort of children sat the very first PISA test and the children who would take part in PISA 2015 were born. The first PISA assessment in 2000 represented a milestone. The assessment frameworks in reading, maths and science highlighted the need for students to be able to apply the knowledge that they had acquired in and outside of school in order to solve problems set in new situations. 2. In 2015, PISA went even further than assessing subject-specific problem-solving competencies. It collected information on students’ ability to solve financial problems, on their collaborative problem-solving skills and, -- more importantly for the present study -- asked students about their experience as teenagers: the struggles they face, their future expectations, how they relate to their peers, parents and teachers, and their satisfaction with their life as a whole. As such, PISA 2015 provides one of the most comprehensive portraits of students’ well-being around the world to date.
3. Over the past decade, there has been growing interest in students’ well-being and in comparing countries, not only in terms of how well students fare academically, but also in how well education systems promote students’ overall development and quality of life. Research shows that high levels of well-being among students are associated with positive and fulfilling life-experiences, while low levels of well-being are associated with just the opposite (Pollard and Lee, 2003).
4. Children in school spend a considerable amount of time in their classrooms, socialising with classmates and interacting with teachers and other staff members. What happens in school is therefore key to understanding if students enjoy good physical and mental health, how happy and satisfied they are with different aspects of their life, how connected they feel to others and the aspirations and expectations they have for their future (Adamson, 2013; Bradshaw et al., 2007; Currie et al., 2012; OECD, 2009; Rees and Main, 2015). Overall, students who enjoy high levels of well-being are generally less involved in risky behaviours (Currie et al., 2012) and perform better at school (Gutman and Vorhaus, 2012).
5. Even though longitudinal studies suggest that students’ scores on PISA are correlated with how well students will do later on in life (OECD, 2012; OECD, 2010), strong performance on standardised assessments can only explain so much of how well they will do later in life (Stankov, 1999; Sternberg, 1998).
6. Monitoring the well-being of 15-year-old students, the target population of PISA, is important as students at this age are in a key transition phase of physical and emotional development; hence, how students feel at this stage may have more long-term consequences than would otherwise be the case
(American Psychological Association, 2002). Feeling well, developing decision-making skills and psychological coping mechanisms lay the foundations for self-awareness and relationship building – key competencies if individuals are to lead meaningful lives.
7. As research on children’s well-being in school gains momentum, the term is being used to characterise different aspects of students’ lives. In this paper well-being is described as “a dynamic state
characterised by students experiencing the ability and opportunity to fulfil their personal and social goals. It encompasses multiple dimensions of students’ lives, including: cognitive, psychological, physical, social and material. It can be measured through subjective and objective indicators of competencies, perceptions, expectations and life conditions.” This definition puts an emphasis on the multidimensionality of students’ well-being, which encompasses both students’ states and outcomes at the age of 15, as well developmental processes that may act as risk or protective factors shaping well-being in later life. However, as context dependency comes into play, students’ responses on their level of well-being are closely tied with the specific circumstances that 15-year-olds experience at home and at school at the time of the PISA test. 8. The OECD’s work on child well-being (OECD, 2015b) identifies two distinct approaches to its conceptualisation and measurement:
The developmental approach underscores the importance of building human capital and social skills for the future (Bronfenbrenner, 1979); valuing children’s well-being today influences adults’ well-being tomorrow.
The children’s rights approach recognises children as human beings, focusing on their well-being “here-and-now”, and relies on their direct input regarding what aspects are important to them and how they might be measured (Casas, 1997; Ben-Arieh, 2010).
9. PISA has traditionally combined a developmental perspective, highlighting the instrumental value students’ skills at the age of 15 have for their future, with a subjective, child-centred view of students’ well-being, stressing the importance that information processing skills and social integration have for their everyday life. The number of dimensions of well-being covered by PISA and the depth of such coverage has expanded significantly since the first PISA assessment in 2000. Since its inception, PISA stressed the importance for students to acquire knowledge and develop habits and social skills that can benefit them in the future (Bronfenbrenner, 1979). However, PISA also anchors its very definition of what it means to be proficient in reading, mathematics and science in students’ ability to solve problems and situations that 15-year-olds may encounter in their daily lives.
10. The multidimensional definition of students’ well-being used by PISA 2015 stresses the role of both objective aspects – material conditions that ensure students’ basic human needs and rights -and subjective aspects – i.e. how students evaluate their life, their feelings and emotions (Alatartseva and Barysheva, 2015). This multidimensional approach to students’ well-being is well aligned with the one used in the OECD’s Better Life Initiative (OECD, 2015b)1 by bringing together students' academic performance with what they think about the quality of their lives both in and outside school.
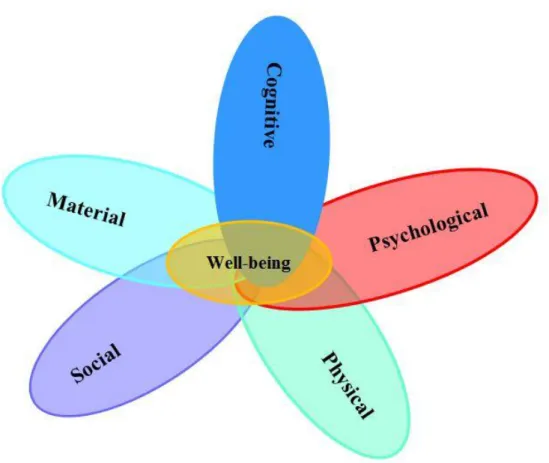
11. Figure 1 shows the five domains of well-being identified in PISA 2015 which are distinct but also closely related and contribute to determining students’ overall optimal functioning and satisfaction. Each dimension can be considered both as an outcome and as an enabling condition with respect to other dimensions and ultimately with students’ overall evaluations of the quality of their lives.
1
Because the focus of PISA is on students’ well-being, the outcomes discussed in this paper differ from those identified by the Sen, Stiglitz and Fitoussi (SSF) and adopted by the OECD in its Better Life Initiative. However, the five dimensions identified map closely onto the SSF.
12. The five dimensions of students’ well-being captured in PISA 2015 are:
Cognitive well-being. The cognitive dimension of students’ well-being refers to the skills and foundations students have to participate effectively in today's society, as lifelong learners, effective workers and engaged citizens. It comprises students’ proficiency in academic subjects, their ability to collaborate with others to solve problems and their sense of mastery in-school subjects. It incorporates actions and behaviours that may promote the acquisition of knowledge, skills or information that may aid them when they are faced with new, complex ideas and problems (Pollard and Lee, 2003).
Psychological well-being. The psychological dimension of students’ well-being includes students’ evaluations and views about life, their engagement with school, and the goals and ambitions they have for their future.
Physical well-being. The physical dimension of students’ well-being refers to students’ health status, engagement in physical exercise and the adoption of healthy eating habits (Statham and Chase, 2010).
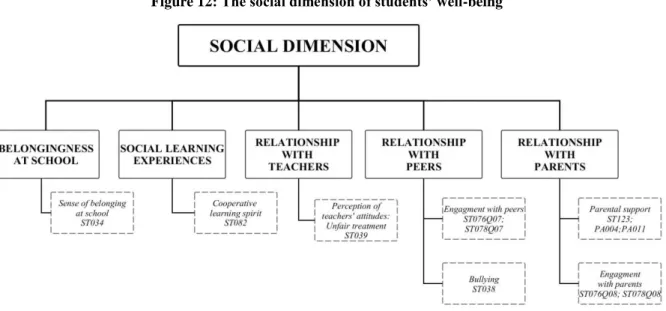
Social well-being. The social dimension of students’ well-being the quality of their social lives (Rath et al., 2010) including their relationship with their family, their peers and their teachers (positive or negative), and how they perceive their social life in school (positive or negative), and how they perceive their social life in school (Pollard and Lee, 2003).
Material well-being. Material resources make it possible for families to better provide for their children’s needs and for schools to support students’ learning and healthy development. Households who live in poverty find it difficult to ensure that their children have access to the educational and cultural resources they need to thrive in school and to realise their potential. Children who live in poverty – with poor housing conditions and poor diets – are more likely to have health problems (Aber et al., 1997), perform poorly in school (OECD, 2013a) and earn less as a middle-aged adult (Case et al., 2005).
13. PISA 2015 collected several indicators for each dimension of well-being. All the indicators discussed in this paper – except those for academic performance in the cognitive dimension of well-being, which are based on the PISA assessment – are constructed from information collected through students’ (STQ) self-reports in the background PISA questionnaires and from information provided by school principals (SCQ) whose schools participated in PISA. Indicators are also derived from the optional parental questionnaire (PA)2 and the educational career questionnaires (EC).
14. Many well-being instruments presented are based on students and school principals’ self-reports which are, by their very nature, context-dependent, If students in different countries use different response styles or understand questions differently, empirical findings may reflect differences in reporting rather than veritable underlying associations, associations although it is difficult to find robust evidence of a large effect of response styles (Exton et al., 2015). A number of questions based on self-reports in previous editions of PISA can also be used to monitor trends over time. Students’ and school principals’ reports were designed to measure latent constructs described in this paper. However, the relationship between these measures instruments and the latent constructs can vary through time, which limit the possibility of making temporal comparisons.
15. This paper provides a framework for the analysis of students’ well-being in PISA 2015, describing the indicators used and presenting previous empirical and theoretical research on child well-being that is relevant for the analysis of the PISA 2015 data.
16. By monitoring several dimensions of students’ well-being among a large sample of students in a large number of education systems, PISA 2015 provides a unique opportunity to assess distributional aspects of students’ well-being both across and within-countries. PISA provides answers to questions, such as: (i) Are students in some countries or in some population subgroups more at risk of reporting low levels of being in its several dimensions? (ii) Are some factors associated with low and high levels of well-being common across all dimensions of well-well-being or do they differ by dimension? (iii) Do positive and negative aspects of the five well-being dimensions differ by population subgroups or by the way in which education systems are organised?
17. Although PISA in 2015 contains instruments to measure several dimensions of well-being, it is and remains first and foremost a study of students’ learning outcomes. The extent of well-being dimensions covered in PISA 2015 will enable educators, policy makers, students and their families to better understand how the different dimensions of students’ well-being are associated with students’ ability to successfully solve real-life problems in mathematics, science and reading comprehension and solve problems collaboratively.
FRAMEWORK FOR THE ANALYSIS OF STUDENTS’ WELL-BEING IN PISA 2015
18. This paper maps the different dimensions of students’ well-being as well as the instruments used to measure the underlying constructs in the sixth round of PISA. For each dimension it highlights key constructs that were measured in PISA, and details the specific indicators and instruments (question numbers) that were used to assess each construct. This framework maps students’ well-being within the broader context of research and policy dialogues on the nature of well-being among teenagers, and highlights how the features that characterise the PISA 2015 round can help policy makers, educators, parents and researchers improve students’ lives at school and beyond.
THE COGNITIVE DIMENSION OF STUDENTS’ WELL-BEING
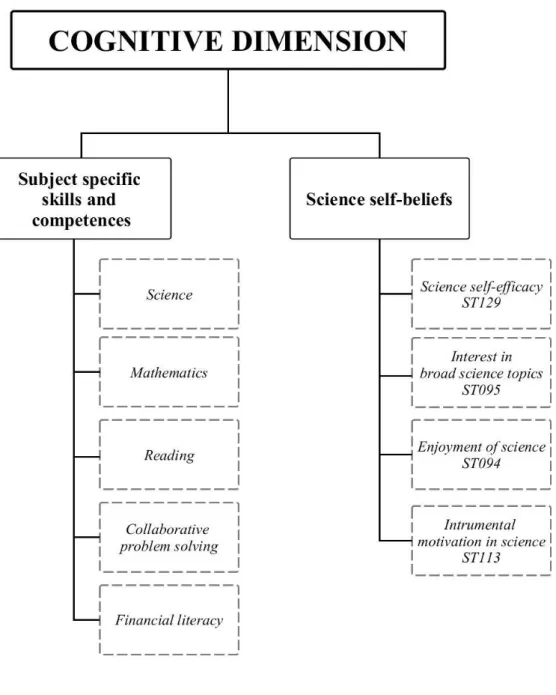
19. The cognitive dimension of students’ well-being encompasses the level of subject-specific skills students have acquired and their self-beliefs in those subjects. Figure 2 illustrates the different assessment areas covered in PISA 2015.
Figure 2: The cognitive dimension of students’ well-being
Subject-specific skills
20. PISA is based on a dynamic and forward-looking model of lifelong learning, exploring the knowledge and skills students need to adapt successfully to a changing world and apply their knowledge and experience to real issues. For example, in order to understand and evaluate scientific advice on nutrition, an adult would not only need to know some basic facts about the composition of nutrients but also to be able to apply that information to real-life contexts. This model reflects changes in the goals and
objectives of participating countries with regards to curricula in schools. Educators focus increasingly on what students can do with what they learn at school (OECD, 2001).
21. PISA also recognises that fifteen-year-olds cannot be expected to have learned everything they will need to know as adults, but in order to continue learning and applying what they learned to different situations they need to understand elementary processes and principles. Thus, PISA assesses the ability to complete tasks relating to real life – depending on a broad understanding of key concepts rather than assessing specific knowledge. The skills students have acquired up to age 15 are the product of a complex inter-relationship of their experience as students in different schools and classes, their life within their close and extended family and their interaction with peers and acquaintances. Competency at age 15 is the result of the sum of the infinite number of experiences that children have accumulated over the years. 22. International experts defined each of the competency domains that were examined in PISA 2015: science, reading, mathematics, collaborative problem solving, and financial literacy3 and drafted the frameworks for assessing them. Competency is not something that an individual either does or does not have, but is measured on a continuum. There is no precise dividing line between a person who is fully competent and one who is not. However, it is necessary for measurement purposes to define at which level of competencies students are able to participate effectively in society. (In PISA, international experts set the baseline at Level 2 on the PISA proficiency scales.)
23. In addition to assessing competencies in the three core domains of reading, mathematics and science, PISA has progressively examined competencies across disciplines and modes of delivery. For example, in 2003, PISA delivered an assessment of static problem solving, and in 2012, both an assessment of financial literacy and creative problem solving.
24. Until 2006 all PISA assessment instruments were delivered as paper-and-pencil booklets, but, starting in 2006, PISA experimented with the delivery of computer-based assessments. In PISA 2015, the delivery mode of the main assessment has shifted to a computer platform, which enables a better assessment of students’ problem-solving strategies and of collaborative problem solving. The shift from a paper to a computer-based assessment platform follows the increasing relevance of digital technologies for learning and the importance that students’ capacity to solve problems on line have for their long-term success and integration in the economic and social life of their countries.
25. The repeated cross-national nature of PISA leads to a tension between the willingness to monitor trends in performance across different birth-cohorts and the willingness to adjust the assessment instruments to the evolving nature of what skills are relevant for labour markets, social integration and success. PISA 2015 assesses students’ competencies in the following domains (see OECD, 2016 for a detailed description of the PISA assessment frameworks):
26. Science: PISA 2015 defines scientific literacy as “the ability to engage with science-related issues, and with the ideas of science, as a reflective citizen” (OECD, 2016, p. 20) A scientifically competent person is willing to engage in reasoned discourse about science and technology which requires the competencies to: explain phenomena scientifically – recognising, offering and evaluating explanations for a range of natural and technological phenomena; evaluate and design scientific enquiry – describing and appraising scientific investigations, and proposing ways to address questions scientifically; and interpret data and evidence scientifically – analysing and evaluating data, claims and arguments in a variety of representations, and drawing appropriate scientific conclusions.
27. Reading: Reading literacy in PISA 2015 is defined as “understanding, using, reflecting on and engaging with written texts, in order to achieve one’s goals, to develop one’s knowledge and potential, and to participate in society” (OECD, 2016, p. 49). In the Reading framework for PISA 2009, ‘print texts’ and ‘electronic texts’ were aligned with the delivery mode of the assessment. Print texts were delivered on paper and electronic texts were delivered on computers. As computers are the mode of delivery in 2015, this alignment has been breached as all ‘print’ units are delivered on screen, but retain the main features of texts that were labelled ‘print-medium texts’. For PISA 2015, the term ‘text display space’ is used instead of ‘medium’ to describe the features of the space - fixed or dynamic - and not the mode in which the text is presented. Fixed texts usually appear on paper in forms such as single sheets, brochures, magazines and books but tend to appear more and more on screen in PDFs and e-readers. Dynamic texts only appear on screens and are synonymous with hypertext: a text or texts with navigation tools and features that allow for and indeed even require non-sequential reading. Each reader constructs a “customised” text from the information encountered at the links he or she follows. In essence, such texts have an unfixed, dynamic existence. In dynamic texts, typically only a fraction of the available text can be seen at any one time, and often the extent of text available is unknown.
28. Mathematics: Understanding mathematics is central to a young person’s preparedness for life in
modern society. A growing proportion of problems and situations encountered in daily life, including professional contexts, require some level of understanding of mathematics, mathematical reasoning and mathematical tools. In PISA 2015, mathematical literacy is defined as “an individual’s capacity to formulate, employ, and interpret mathematics in a variety of contexts. It includes reasoning mathematically and using mathematical concepts, procedures, facts and tools to describe, explain and predict phenomena. It assists individuals to recognise the role that mathematics plays in the world and to make the well-founded judgments and decisions needed by constructive, engaged and reflective citizens” (OECD, 2016, p. 65).
29. Collaborative problem solving: Students’ proficiency in an innovative domain is also assessed.
In 2012 this domain was problem solving, while in 2015, this domain is collaborative problem solving. The framework for the assessment of collaborative problem solving – and the results of that assessment – will be published upon completion of a validation study in 2017.
30. Financial literacy: In recent years, developed and emerging countries and economies have become increasingly concerned about the level of financial literacy among their citizens, especially young people (OECD/INFE, 2015). Finance is a part of everyday life for many 15-year-old students: they have bank accounts with access to online transactions, and as they near the end of compulsory education, students will also face complex and challenging financial choices, such as whether to continue with formal education and how to finance their studies. Financial literacy is thus an essential life skill, and high on the global policy agenda (OECD, 2014a). PISA 2012 was the first large-scale international study to assess the financial literacy of young people. The assessment found wide variations in levels of financial literacy within and across countries (OECD, 2014b). The PISA 2015 assessment provides information about trends for countries that participated in this optional assessment in 2012 as well as new data from countries that did not participate in 2012. Financial literacy is defined in PISA as “knowledge and understanding of financial concepts and risks, and the skills, motivation and confidence to apply such knowledge and understanding in order to make effective decisions across a range of financial contexts, to improve the financial well-being of individuals and society, and to enable participation in economic life” (OECD, 2016, p. 85).
Instruments
31. In the vast majority of the countries and economies that took part in the PISA 2015 assessment, the cognitive test was administered on a computer platform. The computer-based test was designed to take around 120 minutes to complete and contained a range of new and trend questions in science, in reading and mathematics and, in the majority of countries, collaborative problem solving. The items were organised in clusters in the same subject and each cluster was designed to take 30 minutes to complete. Six clusters of new science questions were developed, three clusters of new collaborative problem-solving material were developed and six clusters of trend material in science, reading and mathematics were administered (more details on the PISA 2015 design and sample questions are available in the PISA 2015 Technical Report (OECD, forthcoming).
Science self-beliefs
32. On top of the core domains assessed through a cognitive test, PISA measures students’ self-beliefs which comprise a range of students’ attitudes and dispositions towards learning such as subject-specific motivation and self-efficacy using questionnaires. As science is the main domain in PISA 2015, questions regarding students’ self-beliefs relate to science. How students think and feel about themselves shapes their behaviour, especially when facing challenging circumstances (Bandura, 1977). Education systems are successful when they equip students with the ability to influence their own lives (Bandura, 2002). Self-beliefs have an impact on learning and performance on several levels: cognitive, motivational, affective and decision-making. They determine how well students motivate themselves and persevere in the face of difficulties, they influence students’ emotional life, and they affect the choices students make about coursework, additional classes, and even education and career paths (Bandura, 1997; Wigfield and Eccles, 2000).
33. While students’ science self-beliefs are partly the product of students’ past performance in biology, physics and chemistry, science self-beliefs influence how students function when confronted with scientific problems. In addition, they have an independent effect on life choices and decisions. Students who perform similarly in science-related classes usually choose different courses, education pathways, and ultimately different careers, partly depending on how they perceive themselves as science learners, the interest they have in science and the importance they feel science has for society (Bong and Skaalvik, 2003; Wang et al., 2013).
34. In 2015, PISA measured the following science-related self-beliefs: science self-efficacy, broad interest in science, interest in broad science topics, and instrumental motivation to lean science.
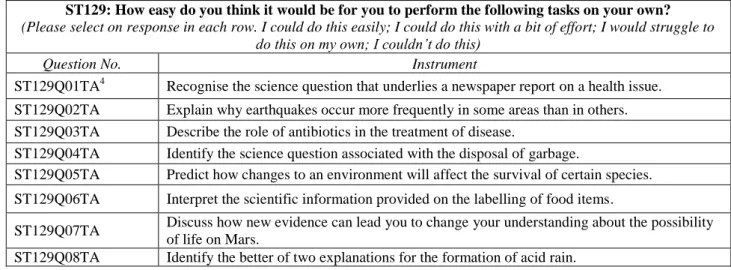
35. Scienceself-efficacy: Students were asked to report whether they believed they could perform a series of tasks either easily or with a bit of effort. These tasks included explaining why earthquakes occur more frequently in some areas than in others; recognising the science question that underlies a newspaper report on a health issue; interpreting the scientific information provided on packages of food; predicting how changes to an environment will affect the survival of certain species; identifying the science question associated with the disposal of garbage; describing the role of antibiotics in treating disease; identifying the better of two explanations of how acid rain is formed; and discussing how new evidence can lead to a change of understanding about the possibility of life on Mars. Students’ responses to questions were used to create an index of science self-efficacy, which identifies students’ level of self-efficacy in science. The index was standardised to have a mean of 0 and a standard deviation of 1 across OECD countries.
36. Interest in broad science topics: Interest in a subject can influence the intensity and continuity of student engagement in learning situations. In turn, strong engagement with a subject deepens students’
understanding of that subject. The way that science is taught can vary in many ways among classes, among schools and among countries. Therefore, in order to measure students’ general interest in science subjects PISA 2015 asked students a set of questions on: their level of interest in different subjects, including human biology, astronomy, chemistry, physics, the biology of plants and geology; their general interest in the ways in which scientists design experiments; and their understanding of what is required for scientific explanations.
37. Enjoyment of science: Students who enjoy learning science tend to be emotionally attached to learning and perceive learning science as a meaningful activity (Laukenmann et al., 2003). In turn, these students are more likely to regulate their learning and to solve problems creatively (Pekrun et al., 2002). 38. Instrumental motivation to learn science: Beyond the general interest in science, how do 15-year-olds assess the relevance of science to their own life and how does external motivation influence their science performance? Instrumental motivation has been found to be an important predictor for course selection, career choice and performance (Eccles, 1994; Eccles and Wigfield 1995; Wigfield et al., 1998). Given the shortage of students following science in higher education in many countries, policy makers should look at whether or not this trend will likely continue.
Instruments
39. Figure 3 summarises the self-reported instruments for measuring science self-beliefs included in the PISA 2015 student questionnaire.
Figure 3: Instruments, science self-beliefs
Science self-efficacy
ST129: How easy do you think it would be for you to perform the following tasks on your own?
(Please select on response in each row. I could do this easily; I could do this with a bit of effort; I would struggle to do this on my own; I couldn’t do this)
Question No. Instrument
ST129Q01TA4 Recognise the science question that underlies a newspaper report on a health issue. ST129Q02TA Explain why earthquakes occur more frequently in some areas than in others. ST129Q03TA Describe the role of antibiotics in the treatment of disease.
ST129Q04TA Identify the science question associated with the disposal of garbage.
ST129Q05TA Predict how changes to an environment will affect the survival of certain species. ST129Q06TA Interpret the scientific information provided on the labelling of food items.
ST129Q07TA Discuss how new evidence can lead you to change your understanding about the possibility of life on Mars.
ST129Q08TA Identify the better of two explanations for the formation of acid rain.
4 The question number codes, such as “ST129Q01TA”, are comprised of four parts. ST indicates that the question is from the student background questionnaire; 129 is the set of instruments; Q01 is the first item in the set; TA indicates that it is a trend question (i.e. it appeared at least once before in PISA). Questions that never appeared in previous PISA cycles are denoted by the suffix NA.
Interest in broad science topics
ST095: To what extent are you interested in the following <broad science> topics?
(Please select on response in each row. Not interested; Hardly interested; Interested; Highly interested; I don’t know what this is)
Question No. Instrument
ST095Q04NA Biosphere (e.g. ecosystem services, sustainability)
ST095Q07NA Motion and forces (e.g. velocity, friction, magnetic and gravitational forces) ST095Q08NA Energy and its transformation (e.g. conservation, chemical reactions) ST095Q13NA The Universe and its history
ST095Q15NA How science can help us prevent disease
Enjoyment of science
ST094: How much do you disagree or agree with the statements about yourself below?
(Please select on response in each row. Strongly disagree; Disagree; Agree; Strongly agree)
Question No. Instrument
ST094Q01NA I generally have fun when I am learning <broad science> topics. ST094Q02NA I like reading about <broad science>.
ST094Q03NA I am happy working on <broad science> topics. ST094Q04NA I enjoy acquiring new knowledge in <broad science>. ST094Q05NA I am interested in learning about <broad science>.
Instrumental motivation in science
ST113: How much do you disagree or agree with the statements about yourself below?
(Please select on response in each row. Strongly agree; Agree; Disagree; Strongly disagree)
Question No. Instrument
ST113Q01TA Making an effort in my <school science> subject(s) is worth it because this will help me in the work I want to do later on.
ST113Q02TA What I learn in my <school science> subject(s) is important for me because I need this for what I want to do later on.
ST113Q03TA Studying my <school science> subject(s) is worthwhile for me because what I learn will improve my career prospects.
THE PSYCHOLOGICAL DIMENSION OF STUDENTS’ WELL-BEING
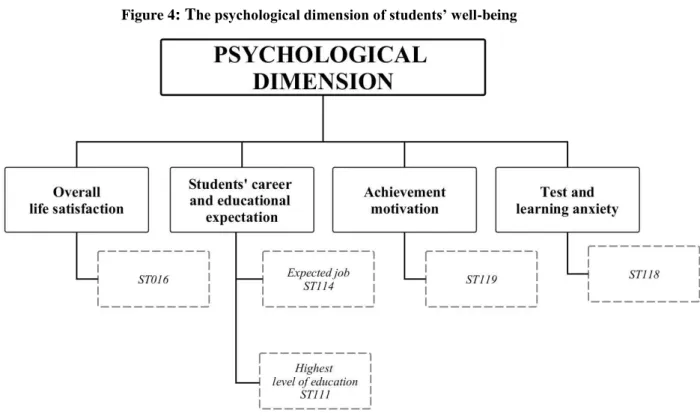
40. The psychological dimension of students’ well-being in PISA 2015 describes students’ self-reported psychological functioning, and covers life satisfaction – students’ overall evaluation about life in general – and three aspects of education related to psychological functioning. The first is the goal setting and emotions related to students’ career and educational expectations; the second is achievement motivation related to students’ appreciation of the educational opportunities they have, an engagement with learning and an interest in acquiring knowledge; and the third one is test and learning anxiety. Figure 4 details the four aspects of psychological well-being that are monitored in PISA 2015.
Figure 4: The psychological dimension of students’ well-being
Overall life satisfaction
41. Life satisfaction is a subjective aspect of psychological well-being. By definition, global life satisfaction is “an evaluation that an individual makes about his or her perceived quality of life overall according to his or her chosen criteria” (Shin and Johnson, 1978 cited in Neto, 1993, p. 126). Although good health or a stable financial situation may be necessary for being satisfied, individuals might not value them in the same way. Hence, the criteria for satisfaction would be based on personal standards (Neto, 1993), not upon criteria that are important to a select few (Neto, 1993; Diener, 1984).
The evidence suggests that overall life satisfaction is influenced by multiple aspects in individuals’ lives, including health status, economic standing, amount of education, environmental quality, social contact, civic participation and governance, and personal security (OECD, 2013b).
42. However, adolescents’ life satisfaction is partly different from adults, and is likely to be heavily influenced by experiences and relationships with their family, peers and school (Henry, 1994). Among teenagers, high levels of life satisfaction are associated with positive physical and cognitive development, social and coping skills that lead to more positive outcomes in adulthood (Currie et al., 2012). Bullying and
2004; Huebner et al., 2000) can cause low levels of life satisfaction and are related to substance abuse, delinquency and engaging in problem behaviour (Sun and Shek, 2009). Supportive family and peers, and strong relationships can help students deal with challenging situations (Currie et al., 2012). The school environment also plays an important role; developing academic skills is a goal for adolescents, which in turn has a strong positive effect on life satisfaction (Suldo et al., 2006).
Instrument
43. Figure 5 highlights how PISA 2015 asked students to report on how satisfied they are with their lives overall. Measures of overall life satisfaction are based on self-reports, and include both single item and multi-item measurement instruments (Huebner and Gilman, 2014; Myers and Diener, 1995). PISA 2015, similarly to the OECD core competency framework (OECD, 2016) below is based on the widely used question, which asks students to rate their current life satisfaction level, from ‘0’ - not all satisfied’ to ‘10’ - completely satisfied (see Figure 5).
Figure 5: Instrument, overall life satisfaction
ST016Q01NA: The following question asks how satisfied you feel about your life, on a scale from “0” to “10”. Zero means you feel ‘not at all satisfied’ and “10” means ‘completely satisfied’. Overall, how satisfied are you
with your life as a whole these days?
(Please move the slider to the appropriate number.)
Students’ career and educational expectations
44. As their lives are unfolding before them, teenagers think and plan for their future. The effort they put in to developing their skills, relationships and emotional maturity, the vision they have for themselves and their goals can guide their actions as teenagers. The present is the foundation upon which the future can be built, but the future informs and shapes the present by giving meaning to the learning process and the effort it requires. Therefore, in 2015, PISA asked students to report the expectations they have for their future careers and studies, reflecting academic success and students’ skills, and the attitudes that promote academic excellence and skills acquisition. Students who expect to complete a university degree and to work in professional and managerial careers are more likely to choose more demanding courses and invest more time and effort in school than students who expect to complete their studies with lower qualifications or to work in jobs that do not require individuals to be proficient in academic domains. Students’ expectations are, in part, self-fulfilling prophecies, as the effort students invest to meet their expectations usually pays off. For example, when comparing students of similar socio-economic backgrounds and academic achievement, students who expect to graduate from university are more likely to complete these degrees than their peers who do not have such high expectations. Conversely, students who expect to drop out of school without qualifications are more likely to do so (Campbell, 1983; Carbonaro et al., 2011; Morgan, 2005; Perna, 2000; Sewell et al., 2003).
45. Education systems have a duty to provide learning opportunities to all students, promote civic values, offer a common knowledge base, and help students to fulfil their full potential. They also play a crucial role in channelling skills and talent into the labour market and helping young people make the transition from adolescence into adulthood. By effectively managing students’ education and career aspirations and expectations through the institutional, social and economic conditions that shape them, education systems can ensure that students’ skills and interests find a suitable match in the economy. School systems must strike a careful balance between creating high expectations to motivate students and ensuring that students have the skills to meet the demands of an economy that requires an increasingly
skilled workforce. Social and institutional constraints help to explain how and why the expectations of 15-year-old students for their future studies and occupations vary considerably both within and across countries (Buchmann and Dalton 2002; Matějŭ et al., 2007; Sewell et al., 2003).
46. Looking at students’ expectations for their future reveals why some students with great potential fail to continue on with their education or transition successfully into the labour market or, conversely, how and why students with mediocre performance in secondary school become economic and social assets for their communities. By linking expectations and student performance, policy makers can formulate policy and direct resources not only towards developing skills but also towards providing information and incentives so that potential skills are fully realised and effectively used. Policies that provide in-school information campaigns on education and career opportunities can promote the development of students’ non-cognitive skills, motivation and attitudes towards learning, and work ethic (Hanson, 1994). Because expectations help motivate students to invest more in learning and in acquiring skills, understanding inequalities in expectations can also reveal some of the inequalities underlying the motivation to learn and to achieve.
Instruments
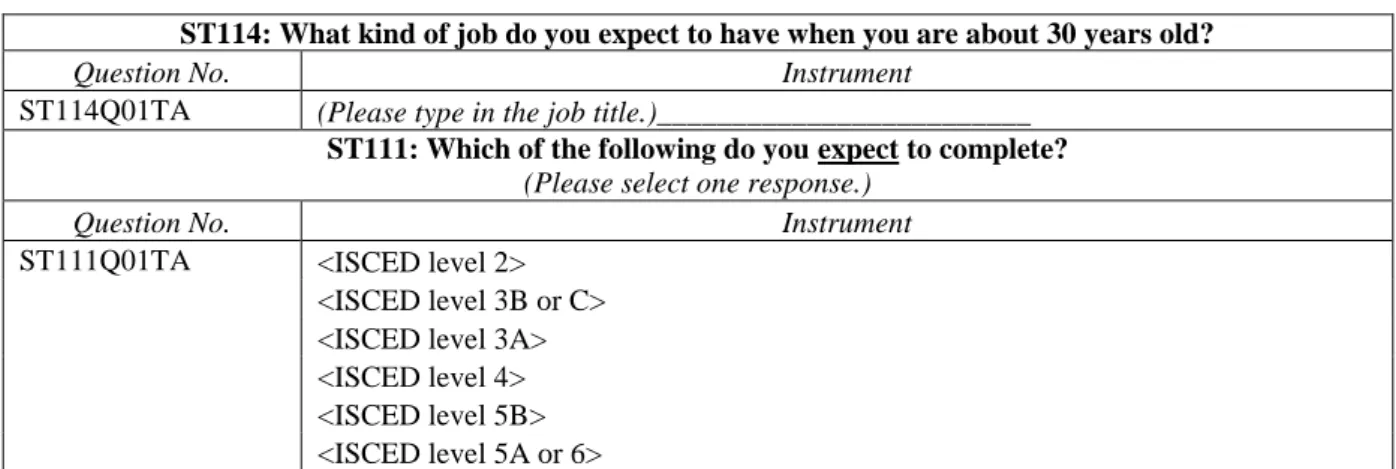
47. In 2015, PISA monitored students’ expectations by asking them what careers they expect to have as young adults through the open question “What occupation do you expect to be working in at the age of 30?” Answers to the question were coded using the ISCO-08 (International Standard of Classification of Occupations) classification of occupations at the 4-digit level. The 4-digit ISCO classification has a level of detail that allows for developing measures of how ambitious students’ expectations are, using the ISEI index (Socio-Economic Index of Occupational Status) of occupational prestige (Ganzeboom, 2010; Ganzeboom et al., 1992). It also allows for examining if students expect to work in particular occupations, for example if they expect to work in occupations that are deemed crucial for economic development and long-term prosperity such as STEM (science, technology, engineering, and mathematics) occupations or teaching. Students’ career expectations were first asked in PISA 2000 and then again in 2003 and 2006, thus allowing for analyses that map trends in students’ occupational expectations and how these relate to students’ socio-economic and demographic profiles, as well as their performance in different academic subjects. Students were also asked to report on what level of education they expected to complete. Students were presented national specific courses and educational programmes, which were converted into ISCED-97 (International Standard Classification of Education) classification of educational programmes.
Figure 6: Instruments, students’ career and educational expectations ST114: What kind of job do you expect to have when you are about 30 years old?
Question No. Instrument
ST114Q01TA (Please type in the job title.)_________________________
ST111: Which of the following do you expect to complete?
(Please select one response.)
Question No. Instrument
ST111Q01TA <ISCED level 2> <ISCED level 3B or C> <ISCED level 3A> <ISCED level 4> <ISCED level 5B> <ISCED level 5A or 6>
Achievement motivation
48. McClelland’s theory of achievement motivation defines the need for achievement as “the goal of individuals to be successful in terms of competition with some standard of excellence” (McClelland, 1958, p.181). Individuals’ need for achievement is associated with dominant behaviour and perseverance. The need for affiliation represents the unconscious concern for building and maintaining close personal relationships (Daft, 2008; Lussier and Achua, 2007; McClelland, 1961). People differ in the degree to which their need for power, achievement and affiliation guide their behaviour and the relative balance between fulfilling these three needs (McClelland, 1958), and are the result of people’s experiences and interaction with their environment.
49. Individual differences in achievement motivation can predict academic performance, career choice and job performance (McClelland, 1972; McClelland, 1965). People with high levels of motivation are more likely to choose occupations that allow more control over outcomes, offer more direct and immediate performance feedback and are of moderate risk level. Achievement motivation captures both students’ desire to outperform others, their desire to work hard to master a task or their desire to perform (Elliot and McGregor, 2001; Elliot and Thrash, 2001; Helmreich et al., 1978).
Instruments
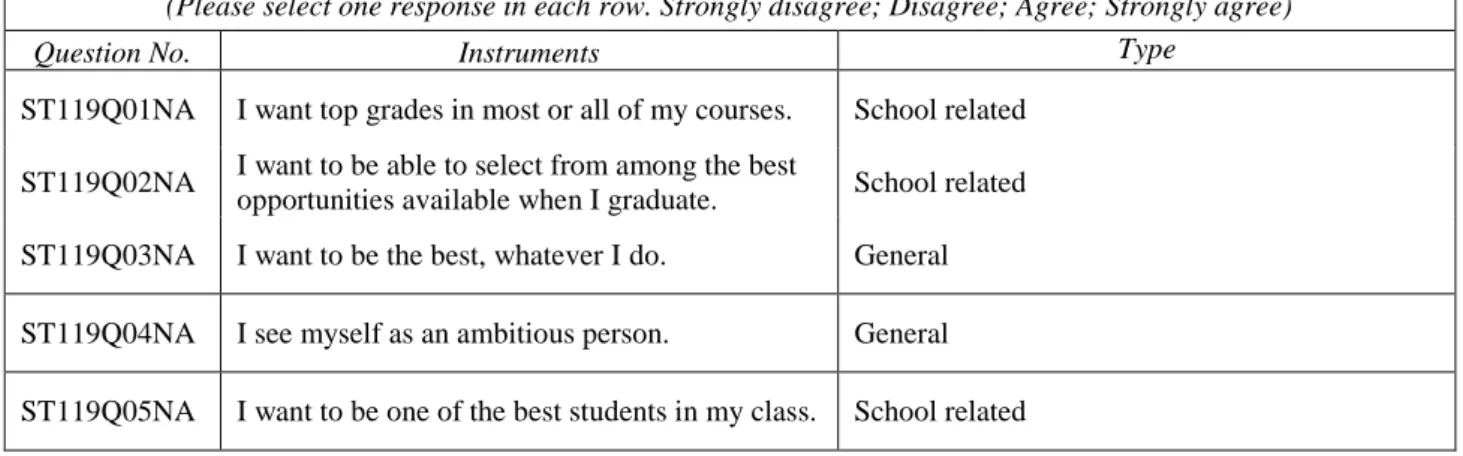
50. In PISA 2015, five questions using a 4-point Likert scale were administered to students to monitor their level of achievement motivation. These items measure general motivation and school-related motivation, by looking at if students are motivated because they want to achieve their academic goals or they have other aims in life that motivate them. Figure 7 summarises these items.
Figure 7: Instruments, achievement motivation
ST119: To what extent do you disagree or agree with the following statements about yourself?
(Please select one response in each row. Strongly disagree; Disagree; Agree; Strongly agree)
Question No. Instruments Type
ST119Q01NA I want top grades in most or all of my courses. School related ST119Q02NA I want to be able to select from among the best
opportunities available when I graduate. School related ST119Q03NA I want to be the best, whatever I do. General ST119Q04NA I see myself as an ambitious person. General ST119Q05NA I want to be one of the best students in my class. School related
Test and learning anxiety
51. Anxiety towards assessment and test taking in school refers to “phenomenological, physiological and behavioural responses” (Zeidner, 2007, p. 166). It is a subjective emotional state experienced before or during tests as a result of the very act of undergoing the test. It leads to uneasiness, worry, apprehension, distress or depression (McDonald, 2001). It has two components characterising the different cognitive and physiological symptoms among anxious individuals: worry and emotionality (Cassady and Johnson, 2002; Spielberger and Vagg, 1995). Worry is the cognitive component of anxiety at school reflecting the debilitating thoughts and concerns that learners experience before or during a test. The emotionality component refers to the heightened stress and associated physiological and affective responses that accompany evaluations in schools.
52. Anxiety can create significant barriers to learning and performance because when students are anxious about tests, they cannot focus on solving tasks but, rather, are occupied worrying about such tasks. Highly anxious students tend to perform lower academically (when performance is measured in test situations) than their peers who do not suffer from anxiety (Ackerman and Heggestad, 1997; Hembree, 1988; Seipp, 1991). In addition to work conducted in educational settings, negative correlations between anxiety towards evaluations and test performance have also been shown in real and simulated employee selection contexts (Fletcher et al., 1997; McCarthy and Goffin, 2005; Schmit and Ryan, 1992) which suggests that anxiety towards evaluations can have important long-term consequences for individuals beyond their effect on selection and evaluation mechanisms in school settings. Anxiety towards evaluations can also have broader consequences, negatively affecting a student's social, emotional and behavioural development, and their feelings about themselves and school.
53. Studies that assess the frequency and the severity of anxiety towards evaluations in school have followed two approaches: 1) comparing the anxiety students experience when taking tests and other potentially stressful events; and 2) examining the proportion of students who, on measures of test anxiety, experience levels of anxiety above a certain threshold (McDonald, 2001).
54. In many countries the frequency of and the consequences testing has on students increases as children move through the school system, leading to greater pressure from parents and schools to perform well. Parental and peer pressure is associated with greater worry, test irrelevant thoughts, and more intense physical symptoms related to test anxiety (Putwain and Best, 2011; Putwain et al., 2010).
55. Low-achieving students may fear tests because they are compared with their peers. High-achieving students may fear “losing” their status as a top-performing student by failing a test. Anxiety towards evaluations in schools may ultimately affect students whose grades drop because they did not perform well on one test, and in consequence will no longer be given the same opportunities.
56. In general, girls appear to be more susceptible to test anxiety than boys (Araki, 1992; Di Maria and Di Nuovo, 1990). This finding matches the higher likelihood that women suffer from anxiety disorders than men. Children from more disadvantaged socio-economic backgrounds and students whose mother tongue is not the language of the assessment appear to experience higher levels of test anxiety than other students (Hodge et al., 1997). This could be because students from more disadvantaged socio-economic backgrounds, particularly those whose parents have low educational attainment, have little support at home regarding how to behave in test-like situations and how to successfully negotiate good outcomes in case they fail their exams. Students who feel that their language skills are not as strong as others may also fear that language problems may jeopardise their performance on the test, for example because they may not be able to understand directions or the test terms.
Instruments
57. In PISA 2015, feeling anxious about sitting a test, fear of failing, and level of worry and apprehension when studying were measured using a 4-point Likert scale. These indicators refer to anxiety towards three types of school-related evaluation processes (the formal test, the out-of-school independent problem-solving experience and the in-school problem-solving experience). The three aspects of evaluation anxiety measured in PISA may differ with respect to the stakes that are associated with performance in these three settings and the level of public exposure of performance among a group of peers (see
Figure 8).
Figure 8: Instruments, test and learning anxiety
ST118: To what extent do you disagree or agree with the following statements about yourself?
(Please select one response in each row. Strongly disagree; Disagree; Agree; Strongly agree)
Question No. Instruments
ST118Q01NA I often worry that it will be difficult for me taking a test. ST118Q02NA I worry that I will get poor <grades> at school.
ST118Q03NA Even if I am well prepared for a test I feel very anxious. ST118Q04NA I get very tense when I study.
THE PHYSICAL DIMENSION OF STUDENTS' WELL-BEING
58. The Latins emphasised the importance of a harmonious development of both cognitive and physical skills with the saying mens sana in corpore sano. And a holistic approach to schooling and education stems from the same idea –that a sound mind inhabits a sound body. The teenage years mark an important developmental stage. Students must be allowed to understand their bodies in order to fully develop. The adoption of healthy practices and lifestyles is as much of a pre-requisite as acquiring academic knowledge and skills for positive economic and social outcomes. Moreover, students’ overall physical fitness is also a pre-requisite for academic achievement and being socially and emotionally stable. Therefore, it is important for policy makers to monitor and understand the physical conditions of 15-year-olds. Students’ health and fitness levels also depend on their socio-economic background and schooling just as much as students’ academic achievement does. Schools’ facilities and the activities local communities offer play an important role in students’ physical well-being.
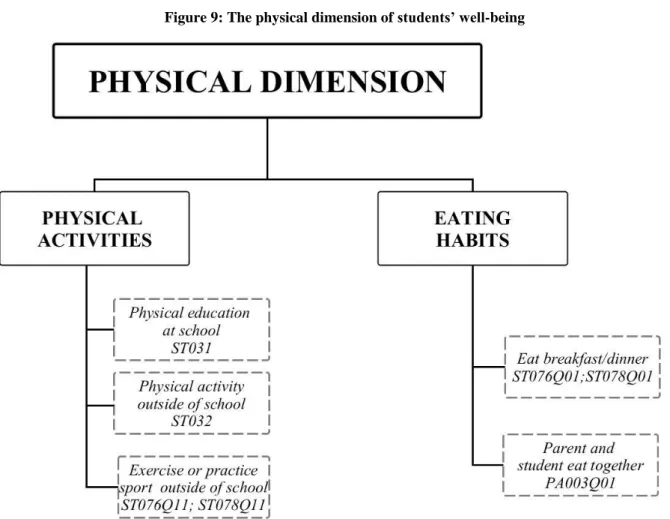
59. The PISA 2015 student questionnaire covers two aspects of students’ lifestyles. First, students were asked to report how much and the level of physical activity they engage in, both in and outside of school. Secondly, PISA asked students to report if they eat breakfast and dinner and asked parents if they eat at least one meal together with their children in order to monitor students’ general eating habits. These indicators shed light on 15 years-old students’ lifestyles even if PISA does not measure health status as such. Figure 9 illustrates two aspects of the physical domain of students’ well-being that can be analysed using the PISA 2015 assessment.
Physical activities
60. Physical activity is described as any movement that requires expending energy (Centers for Disease Control and Prevention, n.d.) and can be categorised by the amount of effort required to move the body (or parts of) (WHO, n.d.). Physical activities such as walking and cycling can be considered
moderate if they raise individuals’ heart rate and break into a sweat (WHO, n.d.). Hiking, jogging, playing tennis or football are considered vigorous if breathing becomes hard and fast, and the heart rate increases rapidly (Centers for Disease Control and Prevention, n.d.). Engaging in moderate and vigorous physical activity is beneficial for people’s general health. According to specialists, 14-18 year old students should practice at least 60 minutes of moderate to vigorous physical activity per day (Strong et al., 2005), and at least three days of vigorous physical activity per week to strengthen their muscles and bones (Janssen and LeBlanc, 2010).
61. Fifteen-year-old students engage in moderate and vigorous physical activity through physical education (P.E.) classes at school and sports activities practiced outside of school. Just as schools’ mathematics curriculum promote students’ mathematics skills and their ability and willingness to engage with problems requiring numeracy in the future, physical education aims at developing and promoting students’ physical competencies, healthy lifestyles, and students’ ability to transfer such skills and knowledge to perform in a range of physical activities (Bailey, 2006). Healthy habits developed during adolescence often carry through to adulthood (Bailey, 2006). Therefore, physical education comprises
behavioural components (practicing different activities) and knowledge components (acquiring and internalising the rules and principles governing the practice of different sports, understanding the effects of active lifestyles and eating habits and the risks associated with consuming artificial stimulants such as drugs, alcohol and tobacco).
62. Effective physical education programmes require schools to have infrastructures like gyms or partnerships with local facilities. This allows students to choose from a variety of activities and sports, and use different parts of the body and the brain in team or individual sports that focus more on endurance or speed, tactic or body strength, or even different muscles.
63. űEducation policy makers, practitioners, students and their families also need to recognise that physical education is not in competition with academic classes, but are complementary. In some countries, parents, students and teachers worry that physical education in school take away time and energy from students, resulting in lower academic performance (Bailey, 2006). However, a comprehensive review by Bailey (2006) shows that physical education, and individual and collective sports are associated with better physical, emotional, social, cognitive and healthy development overall.
64. Individuals who regularly exercise are less likely to suffer from diabetes, cardiovascular diseases and obesity (Haskell et al., 2007) and to be in better overall health (Penedo and Dahn, 2005). There is strong evidence that participating in physical activities reduces depression and anxiety disorders, and raises self-esteem, at least for a short term (Biddle and Asare, 2011); regular physical activity also appears to increase memory retention, perseverance and self-regulation (Biddle and Asare, 2011).
65. Moreover, P.E. classes and extracurricular sports activities such as tournaments and training sessions organised by schools and/or networks of schools, allow students from different socio-economic backgrounds and academic abilities to interact and to develop feelings of trust and respect for each other, and a strong sense of belonging to their school community (Bailey, 2005; Moody, 2001). Cross-national evidence on 15-year-old students’ engagement in moderate to vigorous physical activity suggests that boys and socio-economically advantaged students are more likely to report engaging in physical activity and to practice sports than girls and socio-economically disadvantaged students (Currie et al., 2012).
Instruments
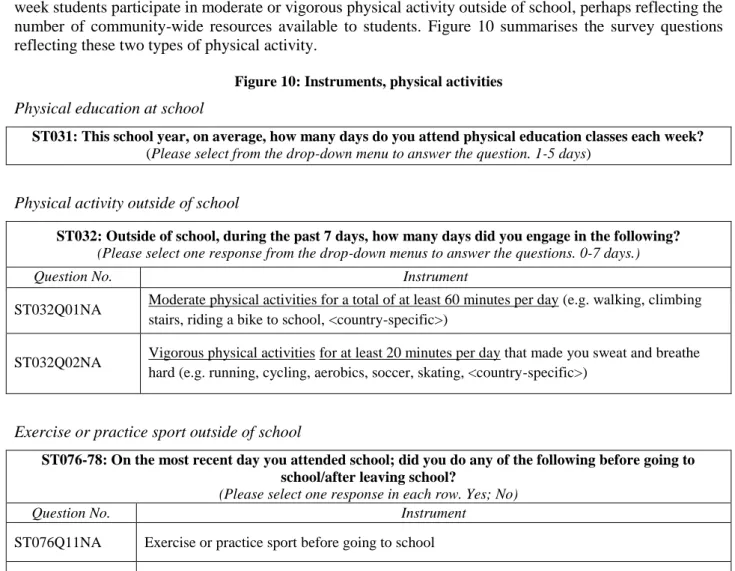
66. PISA 2015 monitors the frequency of physical activity in or outside of school. The first instrument examines how education systems introduce physical education into the curricula by measuring the amount of P.E. lessons that students have at school. The second instrument monitors how many days a week students participate in moderate or vigorous physical activity outside of school, perhaps reflecting the number of community-wide resources available to students. Figure 10 summarises the survey questions reflecting these two types of physical activity.
Figure 10: Instruments, physical activities
Physical education at school
ST031: This school year, on average, how many days do you attend physical education classes each week?
(Please select from the drop-down menu to answer the question. 1-5 days)
Physical activity outside of school
ST032: Outside of school, during the past 7 days, how many days did you engage in the following?
(Please select one response from the drop-down menus to answer the questions. 0-7 days.)
Question No. Instrument
ST032Q01NA Moderate physical activities for a total of at least 60 minutes per day (e.g. walking, climbing stairs, riding a bike to school, <country-specific>)
ST032Q02NA Vigorous physical activities for at least 20 minutes per day that made you sweat and breathe hard (e.g. running, cycling, aerobics, soccer, skating, <country-specific>)
Exercise or practice sport outside of school
ST076-78: On the most recent day you attended school; did you do any of the following before going to school/after leaving school?
(Please select one response in each row. Yes; No)
Question No. Instrument
ST076Q11NA Exercise or practice sport before going to school ST078Q11NA Exercise or practice sport after leaving school
Eating habits
67. Eating habits play an important role in students’ physical well-being, psychological well-being, cognitive function and academic performance (Cooper et al., 2011). Research shows that eating patterns affect teenagers’ quality of life in three ways: first, they promote a healthy lifestyle; second, they promote healthy growth and cognitive development (Birch et al., 2007); and third, eating habits formed during adolescence carry through to adulthood, influencing health and emotional well-being later on (Kemm, 1987; Nicklas et al., 1988; Videon and Manning, 2003). For example, the prevalence of type II diabetes among children and teenagers, as well as other conditions associated with obesity have increased over the past 40 years due to changes in eating habits and lifestyles (Cavadini et al., 2000).
68. An appropriate diet for teenagers is defined as the overall intake of the amount of energy and the type and variety of nutrients. People’s diets are largely determined by cultural habits and traditions, as well as health concerns. But they also can be influenced by internal and external factors such as family and peer influences, body weight perception, food preferences and availability (Videon and Manning, 2003). During the transition from childhood into adolescence, eating habits can change dramatically. First, teenagers become conscious of their own body and how it is perceived by others. As a result they modify their diet and eating habits in order to meet peers’ expectations and their social environment. Moreover, adolescents are allowed more and more autonomy (Neumark-Sztainer et al., 1999). They can decide how much time they want to spend eating, when to eat and what to eat. (Neumark-Sztainer et al., 1999). Many teenagers skip breakfast, some because they want to sleep longer in the morning, others as a way to limit their calorie intake.
69. Adolescents’ eating patterns show a large socio-demographic variation. A study, which uses the Add Health Data, The National Longitudinal Study of Adolescents Health from the U.S., shows that as many as one in five students from the U. S. skips their breakfast (Videon and Manning, 2003). Another study from HSBC shows that daily breakfast consumption from age 11 to 15 declined significantly among boys and girls in almost all examined countries and regions (Currie et al., 2012). Teenage girls are more likely to skip breakfast than boys, which may reflect preoccupations with body image. Adolescents with affluent socio-demographic background were significantly more likely to report eating breakfast (Currie et al., 2012).
70. Evidence suggests that teenagers who regularly eat breakfast in the morning are more likely to have a more balanced and nutritious diet containing fruits and vegetables, and are at a lower risk of being overweight (Morgan et al., 1986; Shaw, 1998; Videon and Manning, 2003). Moreover students who eat breakfast have a higher cognitive function, positively reflected in improved memory, higher test grades, and more regular school attendance (Rampersaud et al., 2005). Teenagers who repeatedly skip breakfast do not tend to prioritise healthy eating habits (Shaw, 1998; Morgan et al., 1986; Videon and Manning, 2003). 71. As parents do not have a lot of influence on what and when adolescents eat during the day, the evening family meal can ensure that teenagers get enough fruits, vegetables and dairy products as well as reduce the likelihood of skipping breakfast (Videon and Manning, 2003) – essential for maintaining and developing healthy nutrition intake. Findings also suggest that in households where families eat dinner together, teenagers tend to enjoy better physical and emotional well-being, possibly because dinner is a time for informal discussions and parents can promote healthy eating habits (Videon and Manning, 2003).
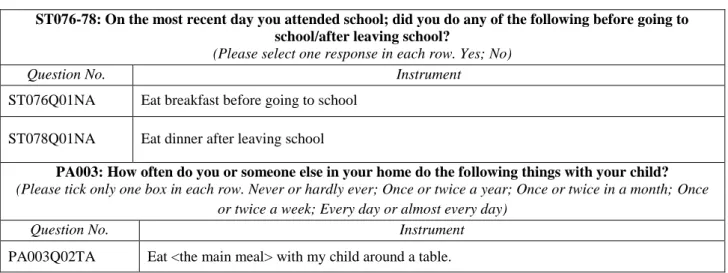
Instruments
72. PISA 2015 monitors two aspects of teenage eating habits: whether students eat breakfast and whether they eat dinner. While the PISA 2015 questionnaires does not provide any information about the specific diet students might follow nor about parental presence at meals, the literature suggests that these two meals are associated with more balanced eating habits and improved physical and emotional well-being. Regular eating habits are also identified by looking at the parental questionnaire, which asks parents to report on how often they eat together with their children. Figure 11 summarises these survey questions.