Lawrence Berkeley National Laboratory
Recent Work
Title
A comparative energy analysis of three electrochromic glazing technologies in commercial and residential buildings
Permalink
https://escholarship.org/uc/item/5vk8c6vvJournal
Applied Energy, 192ISSN
0306-2619Authors
DeForest, N Shehabi, A Selkowitz, S et al.Publication Date
2017DOI
10.1016/j.apenergy.2017.02.007 Peer reviewedeScholarship.org Powered by the California Digital Library University of California
1
Manuscript for Applied Energy
A Comparative Energy Analysis of Three Electrochromic Glazing Technologies in Commercial and Residential Buildings
Authors:
Nicholas DeForest1, Arman Shehabi1, Stephen Selkowitz1, Delia J. Milliron2
Affiliations: 1
Energy Technologies Area, Lawrence Berkeley National Laboratory, 1 Cyclotron Road, Building 90R4000, Berkeley, California, USA, 94720.
2McKetta Department of Chemical Engineering, University of Texas at Austin, Austin, Texas, USA, 78712. *Correspondence to: [email protected] 1 Cyclotron Road MS: 90-1121 Bldg 90 Room 1139 Berkeley, CA 94720 Phone: 510-486-6188 Fax: 510-486-4089 Keywords:
Dynamic windows; electrochromic glazings; visible light switching; NIR switching; energy savings; solar heat gain
Highlights
We model a novel dual-band electrochromic window glazing in three building types.
Results are generated for 16 cities to determine energy, cost, and carbon savings.
Performance is compared with other static and dynamic window technologies.
Results indicate modest savings from novel window in most locations and buildings.
2
Abstract
This paper presents a simulation study of three dynamic electrochromic window glazings, including a novel glazing capable of independently modulating its optical properties in both the visible and near-infrared spectrums. This capability allows this so-called “dual-band” technology to actively manage the solar heat and visible light transmitted into a building’s interior, and creates the potential for heating, cooling, and lighting savings vis-à-vis competing window technologies. In this study EnergyPlus is used to simulate annual energy performance of the dual-band electrochromic (DBEC) glazing in three building types and 16 U.S. climate regions. The savings potential of DBEC windows are presented relative to a conventional electrochromic glazing; a visibly transparent, near-infrared switching electrochromic glazings; and several static alternatives, including ASHRAE 90-2010 standard compliant windows.
Results indicate that the DBEC glazings are capable of outperforming alternatives in a diverse set of locations and building types, including both heating and cooling-dominated regions. Relative to code-compliant static windows, the DBEC is capable of achieving annual primary energy savings between 6 and 30 kWh/ft2 of window area from reduced heating, cooling, and lighting demand. Relative to other advanced glazings, the savings are significantly lower, ranging from 0 to 1.2 kWh/ft2. Regional DBEC energy cost savings versus high performance static windows are presented to identify early potential market entries based on energy savings.. Finally, the impacts of widespread deployment of high-efficiency LED lighting on DBEC energy savings potentials are also presented.
Introduction
U.S. buildings currently consume approximately 14.4 quads (15.2 EJ) annually, including 73% of national electricity consumption [1]. Much of this energy is consumed by lighting, heating,
3 ventilation, and air-conditioning (HVAC), which are each end-uses affected by the thermal and optical properties of a building’s windows. Investigations on this topic have consistently shown the significant impact of window thermal and optical properties on building energy consumption [2]–[6], particular in locales with hot climates [7]. Dynamic window technologies, whose
properties can be controlled actively or changed passively due to environmental conditions, are a promising category of advanced building technologies that can contribute to reducing energy use in buildings [8], [9], particularly if they are capable and quick and responsive switching [10]. Prominent dynamic window technologies include electrochromic glazings, whose optical
properties undergo reversible changes under and applied voltage [11], [12]; thermochromic glazings, whose optical properties undergo reversible changes under changes in temperature [13], [14]; and photovoltachromic glazings, which incorporate solar energy collection to self-power switching of optical properties [15], [16]. Among dynamic window technologies,
electrochromic (EC) glazings have emerged as a viable advancement over static technologies, with several manufactures bringing EC window products to the U.S. market [8], [17]. In a building window application, electrochromic materials can be actively modulated in order to control the transmittance of visible and near-infrared solar energy [18]. In so doing, EC glazings can selectively block or transmit solar heat and light to optimize building energy use. While many lighting and HVAC functions in buildings are still manually controlled, EC control strategies are likely to be driven by data from thermal and lighting sensors in response to lighting and HVAC set points to ensure effective operation.
EC glazings of various types have been in development for decades, and have been the focus of many studies related to their underlying material properties, as well as their suitability for deployment in building window applications [12] [19]. For established EC technologies, dynamic glazing properties and their resulting building energy impacts are reasonably well understood. Recent advances in material science has created the potential for new EC technologies that
4 exhibit dramatically different dynamic optical properties and switching ranges [19]. For these new, novel glazings, the potential energy benefit versus either static or other dynamic glazings is not currently known. An enhanced understanding of these new glazings’ energy performance and quantification of the relative value of EC switching across the visible and near infrared (NIR) spectrums would allow researchers to target material properties of EC glazings that maximize their effectiveness in building applications. The objective of this paper is to compare the energy performance of two novel EC glazings (near-infrared EC and dual-band EC) to a
well-established EC glazing (conventional EC) and several high performance static windows.
Conventional Electrochromic Glazings
Electrochromic glazings based on tungsten oxide films have been in development for decades and are currently available as commercial products from a number of window and glass
manufacturers [8]. These glazings, denoted as “conventional” electrochromic (CEC) glazings in this paper, exhibit broadband switching, meaning their transmission of near-infrared (NIR) and visible light are reduced in unison when switching states [11] [12]. Current commercially available coatings reduce transmission by absorption although prototypes of reflective devices have been demonstrated [20]. This functionality gives CEC glazings the potential to be highly effective at blocking solar heat and mitigating glare [4]. Typically, the CEC blocks some portion of near-infrared heat in both states. When transitioning to a “dark” state, the CEC reduces transmission of both NIR and visible light, resulting in a visually perceptible darkening.
The energy and occupant comfort benefits of CEC have been investigated extensively and are the focus of a number of simulation and experimental studies. Findings suggest that when deployed with appropriate controls, CEC glazings can be highly effective at reducing peak cooling loads, and in modulating daylight so as to capture electric lighting savings while still reducing glare. A simulation of U.S. commercial building stock shows primary energy savings
5 potentials of 10%-20% in perimeter zones from CEC deployment [21]. Simulations of CEC glazings in Mediterranean climates demonstrate savings as high as 37 kWh/m2 of glass for east and west facing facades [22], and annual energy savings as high as 54% [23]. Another
simulation study found dynamic glazings applied to a split-pane window produced lighting savings of 37%-48% versus static window with occupant controlled blinds [24].Dynamic glazings have been simulated or experimentally evaluated in a number of additional studies [25]–[32], many of which suggest variable but positive energy impacts of CEC deployment. Several papers reviewing the current state of advanced window technologies, including CEC and other dynamic glazings have also been published recently [8], [17], [33]. Research on tungsten oxide based EC glazings is ongoing [34], and their manufacturing cost [35], durability [36], and other properties [37] continue to improve incrementally.
NIR-switching Electrochromic Glazings
In the past several years a transparent electrochromic film capable of modulating NIR transmission without affecting visible light transmission has been developed [38] [39]. This feature may give the transparent NIR-switching electrochromic (NEC) glazing an aesthetic advantage over conventional electrochromic glazings in a variety of building applications and climates. Current NEC glazings are based on a plasmonic electrochromic effect that
dynamically modulates the localized surface plasmon resonance of doped semiconducting nanocrystals [40]. Additionally, because of the novel coating design, NEC glazings have the potential to be manufactured using lower cost methods, including spray or slot die coating of a nanocrystal based ink, followed by an annealing process to fix the film to the substrate [41], as opposed to conventional dynamic coatings, which today use more complex and expensive vacuum-based sputter coating processes to manufacture [18]. Although recent research has uncovered lower-cost manufacturing techniques for CEC glazings [35], these are not currently used for commercially available products. Consequently, the potential for manufacturing cost
6 savings could increase the market competitiveness of NEC glazings. Furthermore, the reduced energy intensity of manufacturing means that NEC glazings can achieve life-cycle energy impacts 15%-21% lower than comparable CEC glazings [42].
A previous study simulated a broad range of performance characteristics in south-facing building zones. It found that high performing NEC glazings could produce energy savings ranging from 6-11% for commercial buildings and 8-15% for residential buildings, primarily in middle and northern U.S. regions, relative to high performing static glazings [43]. That analysis found NEC savings in hot, cooling-dominated regions to be less significant, as the NEC
transmitted more insolation than optimal during portions of the year. Additional simulations of multiple commercial building types found that a hypothetical NEC glazing outperformed commercially available CEC glazings, but relied on improved thermal properties to do so [44].
Dual-band Electrochromic Glazings
More recently, research efforts have been focused on developing a composite glazing that embodies the properties and switching ranges of both CEC and NEC glazings. The first demonstrated so-called “dual-band” electrochromic (DBEC) relies on a synergistic interaction between indium tin oxide (ITO) nanocrystals and niobium oxide (NbOx) glass [45][46]. Both of these materials exhibit electrochromic properties, however in different regions of the spectrum. This combination allows for an ITO-NbOx composite glazing to independently modulate
transmission in both the NIR (ITO) and visible (NbOx) regions. A DBEC material with improved modulation range is under development using tungsten oxide (WO3-x) nanocrystals instead of ITO in combination again with NbOx glass [47]. As with the NEC, these nanocrystal coatings can be applied to glass through a lower capital cost process and less energy intensive application and annealing process [45], meaning the manufacturing cost of the coated glazing may be lower relative to sputtered glazings.
7 Dynamic switching of the DBEC glazing can be understood by referring to Figures 1 and 2. Figure 1 provides a simplified illustration of the functionality of each EC state. The DBEC
modeled in this investigation can be understood as being composed of three EC states. Each of these states is defined such that it embodies properties archetypal to a specific operational mode. I.e. the “bright” EC state has been defined to be highly transparent in the visible and NIR spectrums; the “cool” state transparent in the visible and blocking in the NIR; while the “dark” state is blocking in both spectrums. Figure 2, shows the optical properties of and possible transitions between each state. Solar heat gain coefficient (SHGC) represents the fraction of total insolation that is transmitted through the window unit; while Tvis is the fraction of visible light transmitted. In these figures, CEC can be understood as consisting of the “cool” state and “dark” state, as well as the intermediate states between these two, while the NEC can be understood as consisting of the “cool” and “bright” states, which modulate NIR transmission without impacting visible light transmission.
Contribution to Knowledge Base
Recent advances in material science mean that new dynamic window technologies, like DBEC glazings, are close to becoming commercially available, at scale for deployment in buildings throughout the world. Despite the proximity to market availability, the performance benefits of the DBEC over competing technologies have not been quantified beyond preliminary scoping studies in building test cells [48]. Furthermore, there are no published findings of how various external factors (e.g. climate, building geometry, and occupancy and use patterns) will affect the potential benefits of dual-band switching. Given the potential of DBEC glazings to reduce
building energy consumption, an analysis quantifying the energy performance is a valuable contribution to the body of knowledge related to building technologies. As the properties and performance of dynamic windows grow more complex, such analyses have proven valuable for decision-making related to development and deployment [49].
8 This paper presents an analysis of the energy benefits of a dual-band electrochromic glazing deployed in two commercial building types and one residential, in each of the 16 climate zones that compose the United States. This investigation draws on well-vetted methods using building energy modeling software Energy Plus, and utilizes type-representative building reference models developed by the U.S. Department of Energy. This analysis expands on previous simulation work, which assessed the energy performance of NIR electrochromic relative to conventional electrochromic and high performance static glazings.
In this paper, the performance of each of these technologies will be compared to that of a novel, dual-band electrochromic glazing. The results are used to assess the added benefit of selective NIR and visible spectrum switching enabled by DBEC adoption in each region and building type. Furthermore, both energy and energy costs savings are explored to identify market segments within the U.S. where the DBEC glazings achieve the highest savings, which helps inform decision-making related to the ongoing development and future deployment of this technology.
Methodology
Dynamic Window Properties
A hypothetical DBEC can be defined by the properties of its three archetypal states. In this investigation, the optical properties have been based on projected values for the fully developed DBEC product, although these have not necessarily been achieved yet in prototypes. The intention of this investigation is to illustrate the technical potential of a hypothetical, high performance DBEC glazing, as opposed to the research glazing as it currently exists. In the simulation each window is defined by three parameters: SHGC, Tvis, and U-factor. U-factor correlates to thermal transfer through the window between the room and the outside
9 many other metrics by which to characterize a window’s performance [50], these are selected for their compatability with EnergyPlus.
Previous work simulating conventional and NEC glazings emphasized the importance of window thermal properties (e.g. U-factor) when comparing window technologies [44]. In many cases thermal properties had comparable or greater influence on building energy use vis-à-vis window optical properties. To focus this analysis on the impact of variable and dynamic optical
properties, the U-factors for all dynamic and high-performance window glazings are set to a constant 1.9 W/m2-K (0.33 Btu/hr-ft2 °F). This represents the center-of-glass value instead of the whole-window U-factor, which considers also the thermal influence of window frames and spacers that typically increase the overall U-factor. This thermal performance level is achievable by many high-performance window glazings currently on the market in a double glazed
configuration using low-E coatings and gas fills, and exceeds the building code requirements for all US climate zones investigated [51].
While this paper focuses on comparisons among the three dynamic EC technologies, additional comparisons are made to static glazings. These static technologies include ASHRAE code compliant windows [52], a typical high performance static glazing, as well as various static windows whose properties mirror single states of the EC glazing. The typical high-performance glazing is modeled after a commonly deployed technology with properties that favor the
transmission of visible light and blocking of NIR [53]. The static EC states are meant to illustrate the overall energy performance of the glazing without any dynamic functionality. Each of these is defined to have the same U-factor as the dynamic EC glazings. For static windows described as only ASHRAE compliant, U-factors are defined by the local requirements and vary by region and building type. In each region, the U-factor for ASHRAE windows are worse performing than the 1.9 W/m2-K used in all other windows [52].
10 All properties are estimated as part of a two-pane, air filled window unit with low-e coating applied. Center-of-glass thermal and optical properties for advanced window glazings are provided in Table 1. Some electrochromic controls used in this investigation employ
intermediate “dark” states, indicated by a numerical suffix 0-100. These states are modeled as a linear interpolation between the “cool” and “dark” states. For instance, “dark-50” would represent a 50% interpolation between these two bounding states, while “dark-75” represents a darker, 75% interpolation towards the lowest transmission state.
Climate Zones
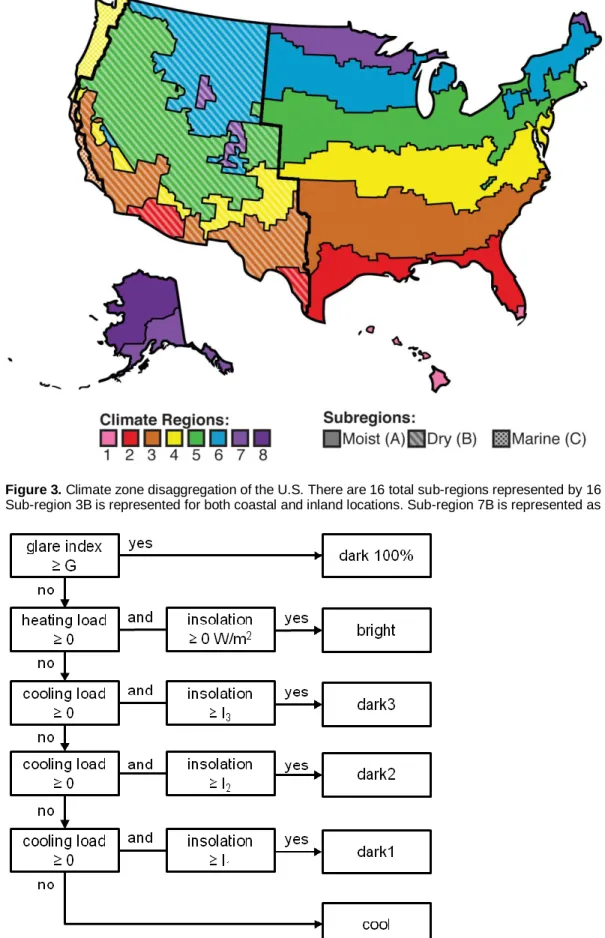
To capture the diversity in climate across the U.S., the country has been spatially disaggregated based on climate zones defined by the International Energy Conservation Code [51]. A map of these zones is given in Figure 3, and consists of 8 regions, containing up to 3 sub-region types: dry, humid and marine. In total, this study considers 16 sub-regions. Each of these sub-regions is modeled by one of 16 U.S. cities. The 7B sub-region has not been modeled separately, as it is geographically insignificant and contains less than 0.06% of the national population. Instead buildings in this region are represented by the 7A reference city. Given the high population of the Los Angeles metropolitan area, sub-region 3B has been divided into coastal (3Bc) and inland (3B) subsets.
Building Models
Building energy simulations are performed using EnergyPlus 7.2 [54], [11]. Building models have been selected from reference models developed by the Commercial Building Initiative at the U.S. Department of Energy (USDOE) [56], [57]. EnergyPlus is a publicly available simulation tool for modeling thermal and electrical loads and performing annual energy analysis of whole buildings or building zones at hourly time increments. EnergyPlus models are defined by
11 characteristics and occupancy and HVAC setpoint schedules. The tool has been developed over the past 20 years and is commonly applied to building energy simulation and analysis [11], [58]. EnergyPlus has been extensively tested and validated, with additional details of methods and results available on the USDOE website [57].
DOE reference models have been developed to represent realistic building characteristics for each of 16 building types. For this analysis, three building types have been targeted as
particularly suitable for early adoption of EC glazings: large offices, medium offices, and midrise residential buildings. Only the models defined as “new construction” were selected, as this market segment is assumed to be the most likely to initially invest in advanced window
technologies. Geometric characteristics for these three reference building models are outlined in Table 2, and include total floorspace, total window area, wall ratio (WWR), window-floorspace ratio, and the fraction of window-floorspace in building zones with external windows. Additional data to define each building type are required, including mechanical system properties as well as thermostat setpoint, lighting setpoints, plug loads and occupancy schedules. DOE provides a complete inventory of the building characteristics and definitions along with the latest model files [57]. While the DOE test buildings are designed to be broadly representative, deviations of façade geometry and orientation have not been explored in this study. Previous works suggest the influence of such factors is also important to consider [59].
Each building file is modified to include new glazing technologies in all windows. Interior shades, such as horizontal blinds, have not been applied to the building models.Dynamic window states are actuated by several control schemes, which are outlined in the following section. Automated daylighting controls have also been added to daylit zones in each commercial building model. The daylighting control uses continuous dimming to maintain the specified minimum illuminance for a reference point at a height of 0.8 m in the center of each perimeter zone. The depth of the reference point depends on the size of the zone and is less than 5m in all building types. The
12 target illuminance at the reference point is 500 lux as required for typical office activities.
Daylighting control can reduce lighting output to 5% of maximum output with a minimum input power of 20%. Daylighting controls are only considered for commercial building types, as this technology is not commonly deployed in residential spaces.
Dynamic Control Strategies
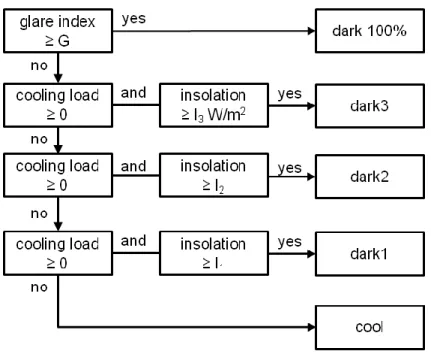
Dynamic windows are controlled on a zonal basis by several simple control schemes, which take into account the zone’s current state of heating load, cooling load, insolation, and glare index. The control schemes are implemented using the EMS functionality of EnergyPlus, which has previously validated as a viable method for modeling dynamic window technologies [60]. Previous simulation and experimental studies emphasize the importance of control scheme development on the overall performance of dynamic windows [61], [62].
Flow diagrams given in Figure 4-Figure 6 illustrate the switching logic for the DBEC, CEC, and NEC glazing respectively for commercial buildings. Residential buildings employ a similar logic, however they do not control for glare. The structure of this control scheme was developed based on intuition about how the dynamic window should respond to zone conditions to meet occupant comfort needs and for energy efficiency. Within these structures, each control can be defined by a set of response states and the thresholds at which they switch to these states. Extensive sensitivity testing was conducted to determine the suitability of these schemes in several test building and locations. The key variables in defining this type of control scheme are the optical properties of the intermediate dark states and the insolation thresholds at which the control switches to these states. Additional testing was done to determine the appropriate values of these parameters, which are based in part on control thresholds modeled in previous studies [63]. In these tests, a series of controls are constructed with varying propensities to switch to darker states, i.e. by increasing the level of darkening and reducing the insolation
13 thresholds for intermediate dark states. As the prevalence of darker states increase, cooling loads fall, while heating and lighting loads increase, due to decreased access to daylight and solar heat. The final control parameters were selected at the point at which additional darkening no longer produced net energy benefits. Control parameters for the final DBEC and CEC
controls are provided in Table 3. Two separate control parameters have been simulated to capture a broader range of EC performance. For comparisons in following sections, for a given technology, building model, and location only the control with the higher performance is
considered.
The full results of the control sensitivity tests are not included in this paper. It should be noted that tests were not conducted for every building and location, and that the control thresholds have not been truly optimized. Within the range of values tested, overall building energy performance was not observed to be highly sensitive to small changes in control parameters. Control schemes have been developed generically and applied to multiple building types and locations; consequently, additional refinement of control schemes for specific cases could potentially produce small additional savings. The effect of slightly suboptimal control is discussed in following sections.
Technology Comparison
Individual simulations are conducted for each of three building types in each of 16 locations for seven static and nine dynamic glazings, resulting in a total of 768 annual simulations. Hourly facility data are generated for each relevant end-use, including electricity use for heating, cooling, ventilation, and interior lighting and natural gas use for heating. These data form the basis for comparisons between each window technology. Other end-uses not affected by window performance, including plug loads, are not considered in these comparisons, though they comprise a non-negligible fraction of overall building consumption.
14 To provide an equal basis on which to consider electricity and natural gas consumption, this analysis employs a number of metrics, namely primary energy (PE) consumption and annual energy costs. Primary energy is a metric that considers the total energy prior to any conversion processes required to serve loads, and is appropriate here given the disparate efficiencies of delivery natural gas and electricity to each building site. To calculate PE, this analysis assumes a U.S. national electricity grid conversion efficiency of 32% [1]. Annual energy costs are based on assumed average prices for electricity and natural gas. The prices of these can vary
significantly by region, sector, time of year, and potentially time of day. To avoid conflating the high variability of energy costs with the variation in regional performance, this analysis employs simplified average prices for electricity and natural gas, given in Table 4. These prices are based on population weighted averages of regional prices by fuel and sector (e.g. commercial and residential). Because dynamic windows have the potential to reduce peak cooling loads [21], [22] and thus electric load shape, more detailed economic analysis that considers time-of-use electricity tariff structures and demand charges could provide a more accurate estimate of energy cost savings. Additional metrics such as those related to occupant thermal and visual comfort may be relevant to glazing selection but are not used here.
Results & Discussion
Total Building Energy
The effect and magnitude of varying window thermal and optical properties can first be explored by examining total building energy use. Figure 7 presents the total building energy consumption by relevant end-uses for large office buildings and select climate zones: 2A, 4A, and 5A. The first two columns in these graphics show the local ASHRAE-compliant windows, with properties that vary by region. The first of the ASHRAE cases does not include daylighting control, while the second and all subsequent cases include identical daylighting controls, as described earlier.
15 The difference between the first two cases provides an estimate of the magnitude of energy savings exclusively from deploying daylighting controls. Note that only lighting consumption appears to change between these two cases. Cases 3-7 represent various static glazings. Each of these has the high performance U-factor of 1.9 W/m2-K, which is a significant improvement over all ASHRAE-compliant values. The U-factor improvement is apparent in the consistent drop in consumption between the ASHRAE base case with lighting control and cases 3-7.
Cases 3-7 include the high-performance static, as well as static “dark”, “cool”, and “bright” states derived from the states of the EC glazings. In addition to these, a so-called “opaque” static glazing has been modeled. This glazing has Tvis and SHGC properties of 0, with the same U-factor as the other advanced glazings (1.9 W/m2-K). Such a window obviously has no practical purpose and would be physically impossible; however it has been modeled here to illustrate an extreme case that bounds the potential for window optical properties to affect overall building energy performance. As it shows, the impact of allowing no insolation to pass through the window surfaces is less than either implementing daylighting controls or improving window U-factor. In the hotter region 2A (Houston), the opaque window performs comparably with the “dark” static glazing, while in colder region 5A (Chicago) it performs moderately worse.
Conversely, the “bright” static glazing produces relatively high energy consumption in the hotter region, and much better performance in the cooler region. This result is intuitive, as the relative value of solar heat varies significantly across climate zones.
The final three cases give the energy performance of the DBEC, CEC, and NEC glazings, respectively. For large office in these three locations, the performance of each dynamic glazing is similar. While the DBEC allows for the most dynamic switching, it produces only slightly lower total consumption. In general, the dynamic glazings are consistently the best performers among the simulated windows. However, the magnitude of savings from implementing daylighting
16 controls or significantly improving U-factor is larger than modifying window optical properties or deploying dynamic glazings.
Normalized Savings versus ASHRAE
The relative performance of the advanced glazings can be examined more closely by looking at differences in energy consumption normalized by total window area. This metric provides a clearer picture of performance by removing the impact of the geometry of the model buildings. Large Offices, for instance have only 29% of their total floorspace in zones with external
windows. This means that the energy consumption from a majority of the building floorspace will not be sensitive to window performance, regardless of the window properties. Figure 8Figure 10 provide the normalized PE savings for Large Office, Medium Office, and Midrise Residential, respectively for all 16 climate regions. The figures give savings relative to ASHRAE with daylighting controls for a subset of the simulated windows: DBEC, high performance static, CEC, and NEC. All values are normalized by total building window area, as opposed to Figure 7, which presents energy use normalized by total building floorspace.
As these figures show, across most regions and building types, the DBEC consistently has the highest savings. However, it is often matched in performance by another technology. In some cases, such as large and medium offices in the generally more southern regions 1-4, the comparable technology is the CEC. In these climates where cooling is a major load the addition of NIR-modulation is of marginal value. Additional solar heat is of little value when building cooling loads dominate overall building energy consumption. Alternatively, in the cases of midrise residential in the generally more northern regions 4-8, DBEC performance is matched more closely by the NEC glazing. In these contexts, additional solar heat gain has appreciable value due to factors such as colder external temperatures, longer heating hours, longer heating seasons, and lower internal heat gains.
17 It should be noted that the DBEC contains both the functionality of the CEC and NEC glazings. As such, under perfect control, it should always be capable of matching or exceeding the performance of either of the alternative dynamic glazings. In the instances here where the DBEC does not perform to this standard, inefficiencies in the control scheme as currently defined in Fig 4-6 are the cause. Additional tuning of the control parameters, or finer granularity of switching could be employed to increase DBEC performance.
DBEC Switching Profiles
The value of each of the DBEC’s dynamic switching ranges can be further understood by examining the switching behavior. When implemented with the control schemes outlined above, the operational state of an EC at a given point in time will depend on internal and external conditions, including heating, cooling, and lighting loads, as well as insolation levels and glare conditions. As such, EC states will vary by time of day, seasons, location, and orientation. To illustrate the variation in EC switching behavior to each of these factors, EC switching fraction profiles are given in Figure 11Figure 14. Each of these figures provides the fraction of time spent in a particular EC state by hour of the day, season and orientation for a single location, window, and building type.
Based on these figures, a number of observations can be made about the switching dynamics of the DBEC. Figure 12 shows the results for a medium office in Chicago (5A). This location experiences a substantial heating season, and as Figure 7 shows, heating represents one of the largest building end-uses in terms of PE. For east-facing windows, insolation values will peak in mid-morning hours based on the position of the sun. As such, it might be assumed that heat from morning insolation would be a valuable input, particularly during the winter season.
However, as east-facing, winter case of Figure 12 shows, a large portion of the time, the DBEC is switched to its darkest state. The reason for this behavior lies in the hierarchy of the control
18 scheme. The scheme prioritizes controlling for glare. As a result, it will tend to switch to very dark states when surface insolation is high, even when the insolation would otherwise be valuable to offset heating and lighting energy use. This dynamic is also apparent in other seasons, locations, and orientations. Glare induced darkening is observed in mid to late afternoon for west-facing windows, and throughout the day for south-facing windows, particularly in winter seasons when the angle of the sun is lower.
The overall effect of this dynamic is to reduce the energy impact of the “bright” state switching functionality of the DBEC in commercial buildings. At the times when the energy impact would be greatest, the control instead selects dark states to preserve occupant comfort. The effect also tends to reduce the difference in performance between the DBEC and CEC, which is identical but for its lack of a “bright” state. An improved control strategy for the real-world applications, but not tested here, would add an occupancy sensor to the control hierarchy. In modern office buildings some studies suggest that spaces are unoccupied for 30-40% of the working hours [64]. An occupancy sensor could override the glare control when the space was empty, allowing the extra solar gain to offset heating loads.
Continuing the examination of the region 5A medium office profiles, it can be observed that during daylight hours, the DBEC tends towards two states: the first and third dark states (dark1 and dark3). Recall that the third “dark” state is employed for glare control and when insolation is high. The first “dark” state is deployed when cooling loads are non-zero and insolation is low but non-zero. The prevalence of this first “dark” state implies that the interior space is frequently in a cooling mode, further undercutting the value of the “bright” state for commercial applications. Furthermore, when insolation is low, the overall energy impact of a window’s optical properties will be commensurately low. Office buildings often exhibit net cooling even in winter due to internal loads from people, lighting and plug loads, but these balances are changing. Lighting loads are falling as more efficient LED fixtures become common practice. Plug loads are also
19 being managed more efficiently e.g. turning off machines not in use or using Energy Star
equipment with low power sleep modes [65]. So it is possible that the value of the “bright” state feature could increase in the future. Additional simulation studies will be undertaken to further explore these effects.
Figure 14 provides EC state profiles for a residential building in the same region (5A). These profiles demonstrate significantly different behaviors in this sector, vis-à-vis commercial buildings. First it should be noted that glare controls have not been deployed in the residential models. Furthermore, the simulated daily occupancy schedules for residential buildings are substantially different, resulting in lower internal heat gains during daytime hours [43]. As such the value of solar heat is expected to be higher in residential buildings. This can be clearly observed in Figure 14, where the portion of time spent in the “bright” state is much higher throughout the day for fall and winter seasons. This finding is reinforced by the results shown in Figure 10. Here the normalized energy savings of the DBEC are 32% higher than those of the CEC, implying that the additional value of “bright” state switching is high in this context.
Figure 11Figure 13 show the EC state profiles for medium office and midrise residential building models for Houston (2A). Whereas region 5A had a substantial heating season, region 2A is dominated more by cooling loads. In the 2A commercial case, the “bright” state is rarely deployed, even in winter. In fact, during daylight hours, the DBEC is almost exclusively set to the first “dark” state, suggesting that some level of cooling is almost always being consumed. The results for the residential case look quite similar during summer and spring seasons. In these cases, the “bright” and “cool” states are rarely deployed during daylight hours. For fall and winter seasons, these states experience moderate use, in addition to the various “dark” states. Again, the impact of these profiles can be seen in the normalized annual energy savings (Figure 8Figure 10). For commercial and residential buildings in hot regions such as 2A, there is no
20 meaningful difference between the DBEC and CEC glazings, implying that NIR-switching is of low value for this combination of building type and climate.
Regional Energy Cost Savings
High variation in building operations as a function of occupancy type and climate, and consequently energy performance, mean that some U.S. market segments are much more suitable to DBEC deployment than others. To illustrate the geographic scope of these market segments, and the magnitude of their potential benefit from DBEC deployment, several maps have been generated. Figure 15Figure 17 show the cost savings per unit area of glazing for large office, medium office, and midrise residential models, respectively. These savings are given relative to the high performance static glazing, rather than ASHRAE windows, as was done in early sections. The high performance static glazing is used here because it is a better basis for comparison for deployment in an energy efficient building. In such a building, the high performance static represents a more realistic competitor to the DBEC or other advanced window technologies, rather than windows that are simply code-compliant.
These figures illustrate the additional energy cost value of the DBEC relative to static glazings, and therefore also provide some guidance about the upper bound of additional cost (capital cost, operations and maintenance, etc) that could be incurred by the DBEC while remaining cost competitive. More detailed analysis of the product over its operation lifetime would be necessary to accurately determine the true allowable marginal cost difference between DBEC and static glazings. Automated glare control will also provide a degree of visual comfort and perhaps even performance improvements that are “real” but difficult to quantify at this time.
In the case of large office buildings, savings intensity appears strongest in southern regions, with positive but diminishing savings in more northern regions. Because the DBEC is capable of reaching a lower SHGC in its darkest state than the high performance static, it will typically
21 outperform the static while the building is a cooling mode. Additionally, because the static
windows are modeled without blinds, the glare control of the DBEC may also increase occupant comfort over static windows, though this has not been directly investigated. Of greater
importance while the building codes don’t require interior shading virtually every building with windows has them to address visual and thermal comfort. Observation suggests that manually operated shades are rarely used optimally [66]. The classic use pattern is to lower them to address immediate glare conditions but often they are not raised after the glare source is gone. This real world operation is therefore unlikely to capture some of the winter solar gain assumed in our modeling and thus relative DBEC performance will look better than presented here. For southern regions where cooling dominates overall building energy use, the DBEC savings are most apparent. In regions with less predominant cooling loads, the savings are lower but remain positive. The largest observed savings intensity is $0.12 per ft2 of glass area annually in region 1A and 2A.
For medium office buildings, there does not appear to be as strong a regional trend, with many locations in the “humid” (A) subregion experiencing moderate savings. The regions with highest savings are those with a more balanced combination of heating and cooling loads, including high population regions 4A and 5A. The difference in trends between large and medium offices is driven primarily by differences in the building model definitions. While large offices utilize natural gas exclusively for heating, medium office models are defined such that they use a combination of natural gas and electricity for heating loads, including reheating. For both
primary energy and cost, the intensity of electricity consumption is 3-4 times higher than natural gas for all end-uses. By shifting some heating consumption to electricity, medium offices
increase the savings potential from reducing heating loads. As a result, locations with higher heating savings see increased performance relative to the high performance static. For medium
22 offices, the largest observed savings intensity ($0.14 per ft2) occurs in remote region 8, followed by a comparable $0.12 per ft2 in region 5A.
Midrise residential buildings include significantly different model definitions, use patterns, and requirements than the commercial models. As such, the savings trends exhibited in midrise models are also significantly different. In hot southern regions, savings are small, and in some regions slightly negative. With better control, the DBEC can theoretically outperform in these regions through increased darkening. In moderate regions, savings quickly increase and
outpace the savings observed in either commercial model. For midrise residential buildings, 7 of the 16 climate regions achieve higher savings intensities than the best performing commercial regions.
As described in earlier sections the occupancy and internal heat gains profiles of residential buildings increase the value of transmitting solar heat into the building interior. Furthermore, the lack of glare control in the EC switch algorithm means that solar heat can be more easily utilized when it is of value. Therefore, as regional heating consumption increases, the savings intensity of the DBEC versus static also increases, reaching a peak of $0.28 per ft2 in region 7. Regions 5A, 6A and 8 also exhibit strong performance with savings of $0.19, $0.24, and $0.22 per ft2, respectively.
Impact of Lighting Stock Improvement
Energy savings related to changes in building envelope (e.g. DBEC deployment) are driven by net changes to building end-uses such as lighting, heating, and cooling, and will also depend on the efficiencies of the technologies that serve each of these end-uses. Of these end-uses, lighting is currently poised to undergo significant change in the form of widespread deployment of high efficiency LEDs [67]. Because the DBEC derives some of its energy and cost saving
23 value from savings due to increased daylighting, changes to the U.S. lighting stock has the potential to impact DBEC savings over the course of the window’s 15-20 year operational life. To illustrate this potential impact, additional simulations have been conducted in building models where the average energy intensity for lighting has been reduced by approximately 73%,
representing an upgrade from typical T8 and T5 fluorescent lighting (80 lumen/W) to high efficiency LED lighting (300 lumen/W). The LED technology modeled is among the highest efficiency LED currently available [68], as is intended to represent an extreme case for lighting technology stock upgrade.
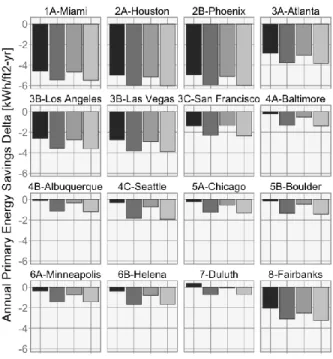
The medium office model is selected to illustrate the effect of this parameter change. The trends in the large office building type results are similar and have therefore been omitted. As with Figure 9, Figure 18 provides the annual PE savings intensity for each advanced window relative to ASHRAE compliant static windows. The differences between these two figures are subtle, so Figure 19 has also been provided. It shows the delta in the savings intensities created by upgrading the full lighting stock to LEDs. As this figure illustrates, for nearly all windows in all locations, the introduction of LED lighting reduces savings intensities. The magnitude of this decrease appears to be strongly linked to location, with large drops in southern regions, and less significant drops in colder, northern regions. For the hotter, southern regions, ASHRAE compliant windows are typically quite dark (SHGC and Tvis ≈ 0.25), whereas the DBEC and CEC, when not subject to high insolation, are in states with higher Tvis (0.3-0.4) and lower SHGC (0.18-0.22), resulting in savings from both lighting and cooling.. As the energy intensity of lighting falls through LED deployment, the energy value of daylighting also falls. For more northern regions, ASHRAE windows are less dark (SHGC=0.4). Consequently, a larger portion of savings from EC deployment are derived by heating and cooling rather than lighting.
24 It is also apparent in Figure 19 that for nearly all regions, the drop in savings for the DBEC and CEC are less than those of the high performance static and NEC glazings. The controls
employed in this simulation for the darkening DBEC and CEC glazings are structured to favor reducing cooling loads, sometimes at the expense of lighting loads. Because of this
prioritization, these two glazing are less adversely impacted than the non-darkening glazings, which derive a higher portion of their overall savings from lighting. The reduction in DBEC savings intensity relative to ASHRAE compliant static windows varies from approximately 36% in southern regions to typically below 10% in most other regions. The reduction in DBEC savings intensity relative to other advanced windows is much less significant, and in many cases positive, ranging from a 2% reduction to an approximate 10% increase.
Conclusions
This paper has presented a comparative analysis of three advanced dynamic, electrochromic window technologies: conventional EC, Near-infrared EC, and dual-band EC by simulating their energy performance in three building types and 16 climate zones representing the U.S. The results of these simulations are used to assess the relative value of each of the EC
technologies’ switching ranges, as well as their overall value relative to available static window alternatives. Several simple control schemes have been developed to simulated EC operation by linking the window state to local insolation, zonal heating and cooling loads, and glare.
Results indicate that the DBEC is capable of outperforming the alternative windows in nearly every building and climate region simulated on the basis of primary energy consumption. However, with specific combinations of building type and climate, the additional energy savings from the DBEC are small. For hot, southern regions the “bright” state is infrequently deployed, resulting in an energy performance comparable to the conventional EC, which lacks a “bright” state. For northern heating dominated regions, DBEC performance is matched more closely by
25 NEC performance, indicating the ability to increase transmission of NIR heat is of higher value than blocking visible light. While the NEC performs poorly in hot regions, and the conventional EC performs moderately worse in cool regions, the high switching range of the DBEC glazing makes it a versatile technology for both heating and cooling dominated regions. It is important to note that savings from DBEC and CEC glazings are influenced by their glare-control switching algorithm, which improves occupant comfort but does not produce direct energy benefits. To achieve comparable comfort levels NEC and some static glazings would require the deployment of blinds with either expensive automated control or continuous manual intervention. As noted earlier manual operation will often close blinds to address thermal and visual comfort when sun is present but do not reliably return to the open state when the sun is absent, thus reducing daylighting benefits and some winter thermal benefits.
This paper also investigated the impact of increased lighting efficiency assuming high-efficiency LED deployment which will reduce some of the previously calculated lighting savings. Results indicate that primary energy savings fall less than 10% in most cases, relative to ASHRAE compliant static windows due to reduced energy savings from daylighting. Relative to other advanced glazings, the impact is much less significant however. Under this comparison, some regions experience declines in primary energy savings of 2% or less, while others see savings from DBEC glazings increase by as much as 10%, indicating that non-DBEC glazings are more adversely impacted by high-efficiency lighting.
While the DBEC performs comparably well or better than all alternatives simulated in most locations and building types, the small margin savings means that the success of a
commercially available DBEC window will be heavily determined by other parameters, including capital cost of procurement and installation, system maintenance costs, and lifetime. Future work on DBEC windows should include more detailed economic modeling, particularly of time-dependent electricity costs. Additional effort should also be given to developing more finely
26 tuned control schemes based on a better understanding of occupant thermal and luminous comfort needs, to ensure that each dynamic window type is controlled optimally. These will likely build on the growing interest in “internet of things” based building controls which should offer new functionality at minimal cost. Finally, this investigation explores only typical geometries of standard designs for three new construction building types. The potential for savings and actual savings could be higher for certain building types and configurations, for example the common use of very highly glazed facades in modern urban office design. Future work should include exploring other, less typical, buildings or characteristics, such as atrium spaces and shopping malls, where the application of dynamic could yield greater savings.
Acknowledgements
Lawrence Berkeley National Laboratory is operated for US Department of Energy (DOE) under Contract Grant No. DE-AC02-05CH11231. This project was supported by a DOE ARPA-E grant to D.J.M.
References
[1] U. S. D. of E. EIA, Energy Information Administration, Office of Integrated and
International Energy Analysis, “Annual Energy Outlook 2015 with projections to 2040,” Washington, DC, 2015.
[2] H. Omrany and A. Marsono, “Optimization of Building Energy Performance through Passive Design Strategies,” Br. J. Appl. Sci. Technol., vol. 13, no. 6, pp. 1–16, 2016.
[3] S. D. Rezaei, S. Shannigrahi, and S. Ramakrishna, “A review of conventional, advanced, and smart glazing technologies and materials for improving indoor environment,” Sol. Energy Mater. Sol. Cells, vol. 159, pp. 26–51, 2017.
[4] S. B. Sadineni, S. Madala, and R. F. Boehm, “Passive building energy savings: A review of building envelope components,” Renew. Sustain. Energy Rev., vol. 15, no. 8, pp. 3617–3631, 2011.
[5] T. Ihara, A. Gustavsen, and B. P. Jelle, “Effect of facade components on energy efficiency in office buildings,” Appl. Energy, vol. 158, pp. 422–432, 2015.
[6] W. Platzer, “Switchable facade technology - energy efficient office buildings with smart facades,” in Solar World Congress, 2003, p. 6.
27 [7] M. A. Fasi and I. M. Budaiwi, “Energy performance of windows in office buildings
considering daylight integration and visual comfort in hot climates,” Energy Build., vol. 108, pp. 307–316, 2015.
[8] W. J. Hee, M. A. Alghoul, B. Bakhtyar, O. Elayeb, M. A. Shameri, M. S. Alrubaih, and K. Sopian, “The role of window glazing on daylighting and energy saving in buildings,”
Renewable and Sustainable Energy Reviews. 2015.
[9] R. C. G. M. Loonen, M. Trčka, D. Cóstola, and J. L. M. Hensen, “Climate adaptive
building shells: State-of-the-art and future challenges,” Renew. Sustain. Energy Rev., vol. 25, pp. 483–493, 2013.
[10] F. Favoino, M. Overend, and Q. Jin, “The optimal thermo-optical properties and energy saving potential of adaptive glazing technologies,” Appl. Energy, vol. 156, pp. 1–15,
2015.
[11] R. J. Mortimer, D. R. Rosseinsky, and P. M. S. Monk, Eds., Electrochromic Materials and Devices. Weinheim, Germany: Wiley-VCH Verlag GmbH & Co. KGaA, 2013.
[12] C. G. Granqvist, Handbook of Inorganic Electrochromic Materials. Amsterdam: Elsevier, 1995.
[13] M. Kamalisarvestani, R. Saidur, S. Mekhilef, and F. S. Javadi, “Performance, materials and coating technologies of thermochromic thin films on smart windows,” Renew. Sustain. Energy Rev., vol. 26, pp. 353–364, 2013.
[14] C. G. Granqvist, “Electrochromics and Thermochromics: Towards a New Paradigm for Energy Efficient Buildings,” Mater. Today Proc., vol. 3, no. Icfmd 2015, pp. S2–S11,
2016.
[15] J. J. Wu, M. Da Hsieh, W. P. Liao, W. T. Wu, and J. S. Chen, “Fast-switching
photovoltachromic cells with tunable transmittance,” ACS Nano, vol. 3, no. 8, pp. 2297–
2303, 2009.
[16] C. Bechinger, S. Ferrere, A. Zaban, J. Sprague, and B. A. Gregg, “Photoelectrochromic windows and displays,” Nature, vol. 383, no. 6601. pp. 608–610, 1996.
[17] R. Baetens, B. P. Jelle, and A. Gustavsen, “Properties, requirements and possibilities of smart windows for dynamic daylight and solar energy control in buildings: A state-of-the-art review,” Sol. Energy Mater. Sol. Cells, vol. 94, no. 2, pp. 87–105, Feb. 2010.
[18] C. G. Granqvist, “Switchable Glazing Technology: Electrochromic Fenestration for Energy-Efficient Buildings,” in Nearly Zero Energy Building Refurbishment, London: Springer, 2013, pp. 583–613.
[19] A. Cannavale, P. Cossari, G. E. Eperon, D. S. Colella, F. Fiorito, G. Gigli, J. Snaith, and A. Listorti, “Environmental Science Forthcoming perspectives of photoelectrochromic devices : a critical review,” Energy Environ. Sci., vol. 9, no. December 2015, pp. 2682–
28 [20] T. J. Richardson, “New electrochromic mirror systems,” Solid State Ionics, no. 165, pp.
305–308, 2003.
[21] E. S. Lee, M. Yazdanian, and S. Selkowitz, “The energy-savings potential of electrochromic windows in the US commercial buildings sector,” Berkeley, 2004.
[22] P. F. Tavares, A. R. Gaspar, A. G. Martins, and F. Frontini, “Evaluation of electrochromic windows impact in the energy performance of buildings in Mediterranean climates,”
Energy Policy, vol. 67, pp. 68–81, Apr. 2014.
[23] S. Papaefthimiou, E. Syrrakou, and P. Yianoulis, “Energy performance assessment of an electrochromic window,” Thin Solid Films, vol. 502, no. 1–2, pp. 257–264, Apr. 2006.
[24] L. L. Fernandes, E. S. Lee, and G. Ward, “Lighting energy savings potential of split-pane electrochromic windows controlled for daylighting with visual comfort,” Energy Build., vol. 61, pp. 8–20, Jun. 2013.
[25] J. Apte, D. Arasteh, and J. Y. Huang, “Future advanced windows for zero-energy homes,”
ASHRAE Trans., vol. 109, no. 2, Dec. 2002.
[26] Arasteh D, Selkowitz S E, Apte J, and LaFrance M, “Zero Energy Windows,” in ACEEE Summer Study, 2006.
[27] F. L. Lee ES, Selkowitz SE, Clear RD, DiBartolomeo DL, Klems JH, “Advancement of Electrochromic Windows,” 2006.
[28] E. S. Lee and A. Tavil, “Energy and visual comfort performance of electrochromic windows with overhangs,” Build. Environ., vol. 42, no. 6, pp. 2439–2449, Jun. 2007.
[29] D. B. Belzer, “An exploratory energy analysis of electrochromic windows in small and medium office buildings - simulated results using EnergyPlus,” Richland, WA, 2010. [30] N. L. Sbar, L. Podbelski, H. M. Yang, and B. Pease, “Electrochromic dynamic windows
for office buildings,” Int. J. Sustain. Built Environ., vol. 1, no. 1, pp. 125–139, Jun. 2012.
[31] Y. Ajaji and P. André, “Thermal Comfort and Visual Comfort in an Office Building
Equipped with Smart Electrochromic Glazing: An Experimental Study,” Energy Procedia, vol. 78, pp. 2464–2469, Nov. 2015.
[32] A. Aldawoud, “Conventional fixed shading devices in comparison to an electrochromic glazing system in hot, dry climate,” Energy Build., 2013.
[33] Y. Huang, J. lei Niu, and T. ming Chung, “Comprehensive analysis on thermal and daylighting performance of glazing and shading designs on office building envelope in cooling-dominant climates,” Appl. Energy, vol. 134, pp. 215–228, 2014.
[34] C. G. Granqvist, “Electrochromics for smart windows: Oxide-based thin films and devices,” Thin Solid Films. 2014.
29 [35] S. I. Park, S. Kim, J. O. Choi, J. H. Song, M. Taya, and S. H. Ahn, “Low-cost fabrication
of WO<inf>3</inf> films using a room temperature and low-vacuum air-spray based deposition system for inorganic electrochromic device applications,” Thin Solid Films, vol. 589, pp. 412–418, 2015.
[36] R. T. Wen, M. A. Arvizu, G. A. Niklasson, and C. G. Granqvist, “Electrochromics for energy efficient buildings: Towards long-term durability and materials rejuvenation,” Surf. Coatings Technol., vol. 278, pp. 121–125, 2015.
[37] A. Piccolo and F. Simone, “Performance requirements for electrochromic smart window,”
J. Build. Eng., vol. 3, pp. 94–103, 2015.
[38] G. Garcia, R. Buonsanti, E. L. Runnerstrom, R. J. Mendelsberg, A. Llordes, A. Anders, T. J. Richardson, and D. J. Milliron, “Dynamically modulating the surface plasmon
resonance of doped semiconductor nanocrystals.,” Nano Lett., vol. 11, no. 10, pp. 4415–
20, Oct. 2011.
[39] Y. Wang, E. L. Runnerstom, and D. J. Milliron, “Switchable Materials for Smart Windows,”
Annu. Rev. Chem. Biomol. Eng., vol. 7, no. 1, pp. annurev–chembioeng–080615–
034647, 2016.
[40] G. Garcia, R. Buonsanti, A. Llordes, E. L. Runnerstrom, A. Bergerud, and D. J. Milliron, “Near-Infrared Spectrally Selective Plasmonic Electrochromic Thin Films,” Adv. Opt. Mater., vol. 1, no. 3, pp. 215–220, Mar. 2013.
[41] E. L. Runnerstrom, A. Llordés, S. D. Lounis, and D. J. Milliron, “Nanostructured electrochromic smart windows: traditional materials and NIR-selective plasmonic nanocrystals.,” Chem. Commun. (Camb)., pp. 5–7, 2014.
[42] C. Baldassarri, A. Shehabi, F. Asdrubali, and E. Masanet, “Solar Energy Materials & Solar Cells Energy and emissions analysis of next generation electrochromic devices,”
Sol. Energy Mater. Sol. Cells, vol. 156, pp. 170–181, 2016.
[43] N. DeForest, A. Shehabi, G. Garcia, J. Greenblatt, E. Masanet, E. S. Lee, S. Selkowitz, and D. J. Milliron, “Regional performance targets for transparent near-infrared switching electrochromic window glazings,” Build. Environ., vol. 61, pp. 160–168, 2013.
[44] N. DeForest, A. Shehabi, J. O’Donnell, G. Garcia, J. Greenblatt, E. S. Lee, S. Selkowitz, and D. J. Milliron, “United States energy and CO2 savings potential from deployment of near-infrared electrochromic window glazings,” Build. Environ., vol. 89, pp. 107–117,
2015.
[45] B. A. Korgel, “Materials science: composite for smarter windows.,” Nature, vol. 500, no. 7462, pp. 278–9, Aug. 2013.
[46] A. Llordés, G. Garcia, J. Gazquez, and D. J. Milliron, “Tunable near-infrared and visible-light transmittance in nanocrystal-in-glass composites,” Nature, vol. 500, no. 7462, pp. 323–326, Aug. 2013.
30 [47] J. Kim, G. K. Ong, Y. Wang, G. LeBlanc, T. E. Williams, T. M. Mattox, B. A. Helms, and
D. J. Milliron, “Nanocomposite Architecture for Rapid, Spectrally-Selective Electrochromic Modulation of Solar Transmittance.,” Nano Lett., vol. 15, no. 8, pp. 5574–9, 2015.
[48] R. C. G. M. Loonen and J. L. M. Hensen, “Smart windows with dynamic spectral selectivity - a scoping study,” Proc. Build. Simul. 2015, pp. 2158 – 2165, 2015.
[49] R. C. G. M. Loonen, S. Singaravel, M. Trčka, D. Cóstola, and J. L. M. Hensen, “Simulation-based support for product development of innovative building envelope components,” Autom. Constr., vol. 45, pp. 86–95, 2014.
[50] B. P. Jelle, “Solar radiation glazing factors for window panes, glass structures and electrochromic windows in buildings - Measurement and calculation,” Sol. Energy Mater. Sol. Cells, vol. 116, no. 7465, pp. 291–323, 2013.
[51] “2009 IECC Climate Zone Map.” [Online]. Available:
https://energycode.pnl.gov/EnergyCodeReqs/. [Accessed: 05-May-2016].
[52] ASHRAE, “ANSI/ASHRAE/IES Standard 90.1-2013 -- Energy Standard for Buildings Except Low-Rise Residential Buildings.”
[53] “SOLARBAN® 60 Glass.” [Online]. Available: http://www.ppgideascapes.com/en- US/Glass/Products/Low-E-Glass/SOLARBAN-Solar-Control-Low-e/SOLARBAN-60-Glass.aspx. [Accessed: 05-May-2016].
[54] U. S. D. E. E. and R. E. Building Technologies Program, “EnergyPlus 7.2.” 2015.
[55] D. B. Crawley, L. K. Lawrie, F. C. Winkelmann, W. F. Buhl, Y. J. Huang, C. O. Pedersen, R. K. Strand, R. J. Liesen, D. E. Fisher, M. J. Witte, and J. Glazer, “EnergyPlus: creating a new-generation building energy simulation program,” Energy Build., vol. 33, no. 4, pp. 319–331, Apr. 2001.
[56] M. Deru, K. Field, D. Studer, K. Benne, B. Griffith, and P. Torcellini, “U.S. Department of Energy Commercial Reference Building Models of the National Building Stock,” 2011. [57] “Commercial Reference Buildings | Department of Energy.” [Online]. Available:
http://energy.gov/eere/buildings/commercial-reference-buildings. [Accessed: 05-May-2016].
[58] “Testing and Validation | EnergyPlus.” [Online]. Available: https://energyplus.net/testing. [Accessed: 05-May-2016].
[59] M. N. Assimakopoulos, A. Tsangrassoulis, M. Santamouris, and G. Guarracino,
“Optimum geometry and orientation of a building opening with an electro- chromic glazing (PDF Download Available),” in Passive and Low Energy Cooling for the Built
Environment, 2005.
[60] F. Favoino, Y. Cascone, L. Bianco, F. Goia, M. Zinzi, V. Serra, M. Perino, and F. Arts, “SIMULATING SWITCHABLE GLAZING WITH ENERGY PLUS : AN EMPIRICAL
31 VALIDATION AND CALIBRATION OF A THERMOTROPIC GLAZING MODEL gFT research group , Department of Engineering , University of Cambridge , UK . TEBE research group , DENERG , Faculty of Engineering ,” Build. Simul. Conf., pp. 2833–2840,
2015.
[61] F. Favoino, F. Fiorito, A. Cannavale, G. Ranzi, and M. Overend, “Optimal control and performance of photovoltachromic switchable glazing for building integration in temperate climates,” Appl. Energy, vol. 178, pp. 943–961, 2016.
[62] M. N. Assimakopoulos, A. Tsangrassoulis, M. Santamouris, and G. Guarracino,
“Comparing the energy performance of an electrochromic window under various control strategies,” Build. Environ., vol. 42, no. 8, pp. 2829–2834, 2007.
[63] P. Tavares, H. Bernardo, A. Gaspar, and A. Martins, “Control criteria of electrochromic glasses for energy savings in mediterranean buildings refurbishment,” Sol. Energy, vol. 134, pp. 236–250, 2016.
[64] C. Duarte, K. Van Den Wymelenberg, and C. Rieger, “Revealing occupancy patterns in an office building through the use of occupancy sensor data,” Energy Build., vol. 67, pp. 587–595, 2013.
[65] B. Acker, C. Duarte, and K. Van Den Wymelenberg, “Office Space Plug Load Profiles and Energy Saving Interventions,” in ACEEE Summer Study on Energy Efficiency in
Buildings, 2012.
[66] K. Van Den Wymelenberg, “Patterns of occupant interaction with window blinds: A literature review,” Energy Build., vol. 51, pp. 165–176, 2012.
[67] “Energy Savings Forecast of Solid-State Lighting in General Illumination Applications,” 2014.
[68] “Cree First to Break 300 Lumens-Per-Watt Barrier.” [Online]. Available:
32
Figures
Figure 1. Illustration of transmittance of dynamic window insulated glass units (IGU) in each operational state. Conventional ECs transition between states 2 and 3. NIR ECs transition between states 1 and 2. Dual-band ECs are capable of transitioning between each of the above states. Rejection of UV, NIR and visible light occurs primarily through absorption and re-radiation.
Figure 2. Optical properties visible transmittance fraction (Tvis) and solar heat gain coefficient (SHGC) determine the fraction of visible light and total solar radiation that pass through the window unit in each EC state.
33
Figure 3. Climate zone disaggregation of the U.S. There are 16 total sub-regions represented by 16 reference cities. Sub-region 3B is represented for both coastal and inland locations. Sub-region 7B is represented as part of 7A.
34
Figure 4. Switching control algorithm for the DBEC glazing. Switching behaviour will be determined by switching threshold for glare (G) and insolation (I1, I2, I3) and darkness values for intermediate dark states (dark1, dark2, dark3).
Figure 5. Switching control algorithm for the conventional EC glazing. Switching behaviour will be determined by switching threshold for glare (G) and insolation (I1, I2, I3) and darkness values for intermediate dark states (dark1,
dark2, dark3). Note conventional EC does not include “bright” state.
Figure 6. Switching control algorithm for the NEC glazing. Note this control structure does not utilize tuneable parameters as the other EC types do.
35
Figure 7. Annual energy consumption in large office buildings for all modeled windows in three select locations. Values include only end-uses relevant to window performance and are normalized by total building floorspace.
36
Figure 8. Annual primary energy savings for large offices relative to regional ASHRAE standard. Savings Intensities are normalized by total building window area
Figure 9. Annual primary energy savings for medium offices relative to regional ASHRAE standard. Savings Intensities are normalized by total building window area
37
Figure 10. Annual primary energy savings for midrise residential buildings relative to regional ASHRAE standard. Savings Intensities are normalized by total building window area
Figure 11. The EC state profile diagram illustrates which state the control typically based on local weather and building conditions for medium office in Houston (2A). Note commercial applications of the DBEC include darken to reduce glare.
38
Figure 12. The EC state profile diagram for medium office in Chicago (5A). Note commercial applications of the DBEC include darken to reduce glare.
Figure 13. The EC state profile diagram for midrise residential buildings in Houston (2A). Note residential applications of the DBEC do not include darkening to reduce interior glare.
39
Figure 14. The EC state profile diagram for midrise residential buildings in Chicago (5A). Note residential applications of the DBEC do not include darkening to reduce interior glare.
Figure 15. Annual energy cost savings per ft2 of window area for DBEC versus high performance static in Large Office buildings. Results are based on representative cities, and expanded to full climate zone.
40
Figure 16. Annual energy cost savings per ft2 of window area for DBEC versus high performance static in Medium Office buildings
41
Figure 17. Annual energy cost savings per ft2 of window area for DBEC versus high performance static in Midrise Residential building. Note: patterned areas indicate negative values.
Figure 18. Annual primary energy savings for advanced window technologies versus ASHRAE compliant windows under full LED deployment scenario.
Figure 19. Change in annual primary energy savings versus ASHRAE between standard fluorescent lighting stock and advanced LED stock.