Kim, Youngchul and Hyun Woo Lee (2010) Analyzing User Costs in a Hospital: Methodological Implication of Space Syntax to Support Whole-life Target Value Design Lean Construction Journal1 2010 pp 55-65
www.leanconstructionjournal.org
Analyzing User Costs In a Hospital: Methodological
Implication of Space Syntax to Support Whole-life
Target Value Design
Youngchul Kim2 and Hyun Woo Lee3
Abstract
Research Hypothesis: H1: Space Syntax analysis can be used to simulate a user’s experience and movement for investigating design alternatives in the design of healthcare facilities. H2: Space Syntax can efficiently be used to support Whole-life Target Value Design (TVD).
Purpose: This paper investigates a methodological implication of Space Syntax to Whole-life TVD in the design of healthcare facilities.
Research Design/Method: Three hypothetical hospital ward design alternatives are selected - shallow-plan, deep-plan, and courtyard-plan type - to analyze user costs in hospital design to determine which alternative is the most cost-efficient. These three hypothetical design alternatives are evaluated using a Space Syntax program, and then the findings are interpreted to determine user costs.
Findings: The study finds that the deep-plan type has four “low” scores, the shallow-plan type has three “high” and one “medium” score, and the courtyard type has two “high” scores and two “medium” scores. Thus, the deep-plan type is determined to be the lowest user cost type, and the shallow-plan type is expected to have the highest user costs.
Limitations: User costs are discussed in qualitative basis such as high, medium, or low with proportion to the simulation due to the lack of empirical evidence in financial value.
Implications: Space Syntax assures valid results of spatial analysis in relation to users’ movement within the built environment.
Value for practitioners: Space Syntax allows designers to visually compare design alternatives relating to space planning during set-based design using spatial analysis applications.
Keywords: Hospital, user cost, Whole-life Target Value Design, Space Syntax
Paper type: Full paper
1 This is a revised version of a paper first presented to the International Group for Lean Construction Conference in Haifa, Israel in July 2010 and included in the Proceedings of that Conference
2 Ph.D. Candidate in Architecture, Taubman College of Architecture and Urban Planning, the University of Michigan, 2000 Bonisteel Boulevard, Ann Arbor, MI 48109-2069, Phone +1 734/272-5905, FAX +1 734/763-2322, [email protected]
3 Ph.D. Candidate, Civil and Environmental Engineering Department, University of California, Berkeley, Phone +1 510/715-0175, [email protected]
Lean Construction Journal 2010 page 56 www.leanconstructionjournal.org
Introduction
Designing a hospital is a complicated and integrated process that requires architects, engineers, consultants, physicians and staff to cooperate with regards to interdisciplinary issues for total project success. Due to this interdisciplinary co-operation process,
healthcare facility projects have a tendency to utilize various simulation tests in order to efficiently deliver values to the customer more than other types of facilities - i.e.
residential, commercial and industrial facilities.
This paper investigates a methodological implication of Space Syntax to Whole-life Target Value Design (TVD) by investigating user costs in the design of healthcare facilities. Determining user costs in healthcare facilities is an emerging issue, and studies for
predicting the user costs are not yet prevalent in the field. Previous studies have revealed various systematic methods in a hospital design - including spatial and planning strategies - to save the lives of more patients and enhance user productivity (e.g., McCullough 2009; McKee and Healy 2002).
User cost analysis is gaining a significant status in the healthcare industry for
determining whole-life costs. Figure 1 illustrates the magnitude of user costs with regards to other whole-life costs. The value of user costs is nearly eight times greater than sum of operation, maintenance, construction and design costs. User costs appear to be driven by users experience in their surrounding environment. Users – patients, staff, nurses and physicians – experience and move about corridors, hallways and rooms of a hospital, and the spatial configuration has a significant correlation to the users’ experience in the facility.
Figure 1: Relative Costs of Hospital4
Thus, if designers understand the relationship between the users’ experience and the spatial configuration, users’ experience in a proposed facility can be predicted. This study seeks to demonstrate how Space Syntax analysis can be used to simulate a user’s
experience and movement, and evaluates the hypothesis that Space Syntax could
efficiently be adapted for investigating design alternatives in user cost analysis to support Whole-life Target Value Design.
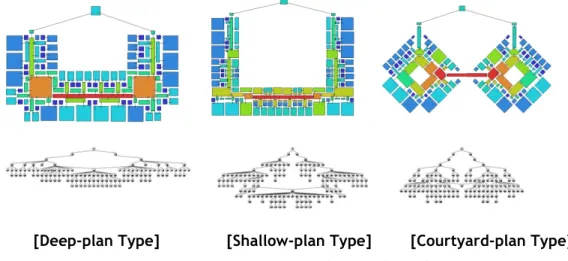
This paper investigates user costs of the three most common hospital ward design options (Figure 2: deep-plan, shallow-plan and courtyard-plan) as suggested in Weight (2005). Currie & Brown’s Live Options, a simulation software program, was used to generate life cycle cost data for two scenarios over 30 years of use. The deep-plan was set as the base option.
4
Diagram adapted from Ballard (2008), yet its original idea from Don Ward, Constructing Excellence & Anne King, BSRIA, and data from Evans et al (1998), Hughes et al (2004), Ive (2006).
Scenario 1: Changing the ward from deep-plan to shallow-plan
Scenario 2: Changing the ward from deep-plan to one with two courtyards
[Deep-plan Type] [Shallow-plan Type] [Courtyard-plan Type] Figure 2: Three Common Hospital Ward Designs (Figures from Weight 2005)
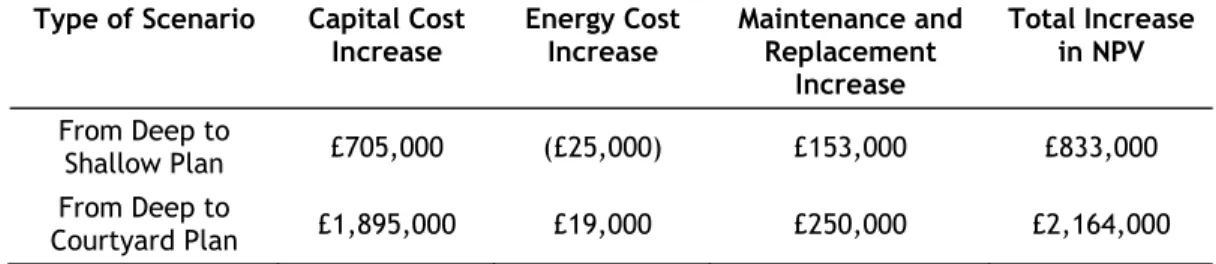
The simulation results are summarized in Table 1. It is apparent that the base plan of deep-plan is the most economical design alternative in terms of life cycle costs. However, this simulation did not consider user costs, and was therefore not a conclusive whole-life analysis.
Table 1: Simulation Results (Adapted from Weight 2005)
Type of Scenario Capital Cost
Increase Energy Cost Increase Maintenance and Replacement Increase Total Increase in NPV From Deep to Shallow Plan £705,000 (£25,000) £153,000 £833,000 From Deep to Courtyard Plan £1,895,000 £19,000 £250,000 £2,164,000
Whole-life target value design
Whole-life Target Value Design (TVD) is a broad application of TVD toward facility operation and management, and user costs beyond initial costs – such as design and construction costs. TVD is defined as a management practice that strives to eliminate waste, and deliver value by using a “design-to-cost” method. By setting a target cost, TVD process can best be described in Engineer Ohno’s advice to “Lower the river to reveal the rocks” for self-imposing necessity and spurring innovation within project constraints (Ballard 2009).
For years, TVD has allowed multiple projects to be completed on or below budget, on or ahead of schedule, all while ensuring delivery of values to customers. (Refer to Ballard 2004 and 2009 for examples). While the initial application of TVD to projects was limited to considering only the initial costs of facilities, more efforts have been initiated to broaden its application toward analyzing business operating costs and user costs with the consideration of whole-life cost concerns. Ballard (2008) argues that more attention ought to be paid in making facilities better fit for use, because user costs are found to be much more significant within the perspective of whole-life costs.
Whole-life TVD provides a systematic design tool to compare whole-life impacts of design alternatives in early stages of the design process and make sound decisions not only based on initial costs, but also on whole-life costs of each alternative being evaluated. Particularly in hospital design, Whole-life TVD promotes a deeper consideration of design
Lean Construction Journal 2010 page 58 www.leanconstructionjournal.org alternatives to improve users' productivity and safety in a given facility. The value of these costs significantly surpasses the initial costs and costs of operation and maintenance.
Space Syntax
Theoretical Background
Space Syntax is a theory that spatial configuration and users’ behaviours are correlated in terms of visual and spatial connectivity in the built environment. Unlike measuring space by its physical distance and area, measurement of spatial depth and configuration
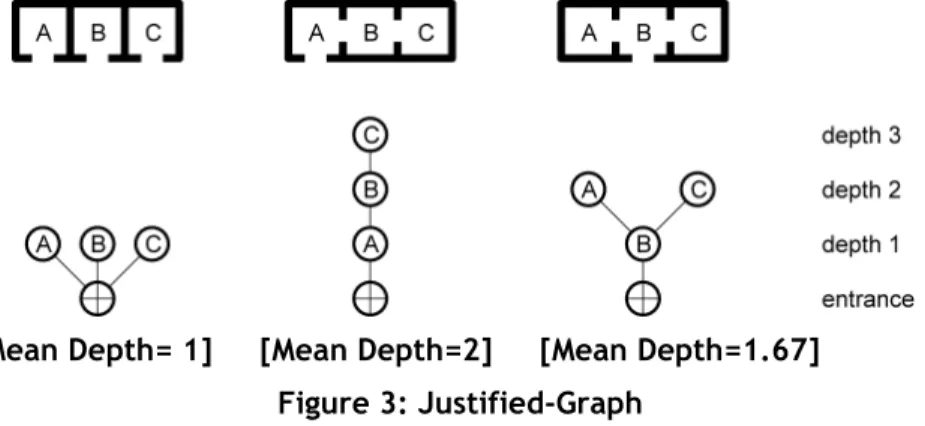
demonstrates correlation of users’ movement in the built environment (Hillier and Hanson 1984). According to Hillier and Hanson's book (1984), the three layouts in Figure 3 are different in terms of spatial configuration. Each consists of the same three rooms sizes, and they are attached in the same order. However, the rooms are connected differently. Hillier and Hanson evaluate these different configurations using "Justified graph (J-graph)."
[Mean Depth= 1] [Mean Depth=2] [Mean Depth=1.67] Figure 3: Justified-Graph
Many studies regarding Space Syntax demonstrate empirical evidence of significant correlation between a user’s movement pattern and the spatial configuration in the environment. Hanson states that social characteristics are correlated to spatial configuration in domestic spaces (Hanson 1998). In Kim and Lara (2009), changes in domestic spaces by Space Syntax analysis also demonstrate the enhancement of privacy in apartment housing developments in Korea. Similarly, studies of urban environments also reveal that more people are observed in highly integrated spaces than segregated spaces (e.g. Hillier et al. 1993; Read 1997). Thus, methodological implications of Space Syntax have been adapted for analyzing the built environment in relation to social characteristics.
Spatial Depth and Integration
In Space Syntax, integration is a topological measurement of accessibility in the built environment. Integration value is adapted as a significant index to analyze spatial configuration. A higher integration value represents spaces that are well integrated – where users can move easily and are therefore more likely to move about the
environment. The integration value of an environment is calculated using the mean depth. For example, in Figure 3, the left j-graph shows that there are three one spatial depths. Thus, the mean depth of the left j-graph at the entrance space is (1 x 3) / 3 = 1. Similarly, the mean depth of the middle j-graph is (1x1 + 2x1 + 3x1) / 3 = 2, and the mean depth of the right j-graph is (1x1 + 2x2) / 3 = 1.67. The shallowest space – the space on the left – has a low mean depth, and the deepest space – the middle one – has a high mean depth.
Integration is calculated from the reciprocal of the mean depth. Thus, since lower mean depth generates higher integration value, higher integration value represents a shallower and more accessible space. This relationship is evaluated in Hillier and Hanson’s book (1984). Hiller and Hanson developed the concept of integration value and found that integration value has a significant relationship with social characteristics in the built environment. The strengths of Space Syntax analysis are summarized as below:
Topological measurement rather than metric calculation to evaluate spatial characteristics
Quantitative value of formal connectivity
Visual representative of spatial configuration
By using Space Syntax, designers can quantitatively analyze spatial configurations, and accordingly, they can use Space Syntax as a tool for analyzing user costs in healthcare facilities.
Method
From Weight’s paper (2005), three hypothetical hospital ward design alternatives are selected - shallow-plan, deep-plan, and courtyard-plan type - to analyze user costs in hospital design to determine which alternative is the most cost-efficient. In order to verify the impacts of Space Syntax, these three hypothetical hospital ward design alternatives are evaluated using Depthmap – a Space Syntax program developed by University College of London. The three ward design alternatives are redrawn. Then, using the Space Syntax application, the wards are analyzed based on convex maps, j-graphs, spatial integration values and grid patterns. The findings are interpreted to determine user costs.
By doing so, the efficiency of design alternatives is evaluated, and methods used allow designers to estimate user costs. In order to quantify the exact monetary value of user costs, a study would require empirical data collection that involves a case study of healthcare facilities. However, a narrative analysis of user costs in this paper will provide a qualitative understanding to the correlation of Space Syntax and user costs and a methodological approach to estimate user costs in ward design alternatives.
Results
Convex map and J-graph Analysis
It is assumed that both ends of the corridors in each of the three ward design alternatives in Figure 2 - deep-plan, shallow-plan and courtyard-plan - are connected to the outside area and are available to users as an entrance. Therefore, the users’ experience begins at the entrance to each ward layout design alternative. The uppermost diagrams in Figure 4 show the convex map analysis of each of the ward designs. Each space is divided with convex polygons to represent each space - patient rooms, corridors, halls, nurse stations and utility rooms. The convex map analyses visually illustrate corridors in the middle of each ward design alternative as a highly integrated spatial arrangement (the red area). Corridors are expected to be crowded and require visual observation from nurse stations. Nurse stations in the deep-plan type are visually integrated from these corridors.
Lean Construction Journal 2010 page 60 www.leanconstructionjournal.org integrated corridor (the red area). In both the shallow-plan and the courtyard-plan types, nurse stations are less integrated into the entire ward layout.
J-graph diagrams are illustrated in the lower portion of Figure 4. In terms of spatial depth, the deep-plan type actually shallower than others. The deep-plan type has seven depths; the shallow-plan type has eleven depths, and courtyard-plan type has ten depths.
[Deep-plan Type] [Shallow-plan Type] [Courtyard-plan Type] Figure 4: Convex Map and J-Graph Analysis
Integration values also demonstrate that the deep-plan type is more integrated than the other two plans analyzed. In Table 2, the mean integration value in the deep-plan type is higher by 30% as compared to the shallow-plan type, and is higher than the courtyard-plan type by 47%. The more integrated spatial configuration in the deep-plan type is believed to reduce the costs associated with controlling users’ behaviours. In addition, Table 2 shows that the intelligibility in the deep-plan type is higher than those of the shallow-plan and the courtyard-plan types. The intelligibility is a correlation index between overall and local spatial accessibility (Hillier 1996). Higher values of the intelligibility represent a facility where users’ movements are more predictable based on overall spatial
configuration because the facility is easily navigable. Thus, in the deep-plan type, users are able to perceive overall spatial characteristic and this reduces costs associated with way-finding.
Table 2: Comparison of Overall Spaces
Type of Ward Mean Integration Intelligibility Depth
Deep-plan 1.12 0.90 7
Shallow-plan 0.85 0.79 11
Courtyard-plan 0.76 0.70 10
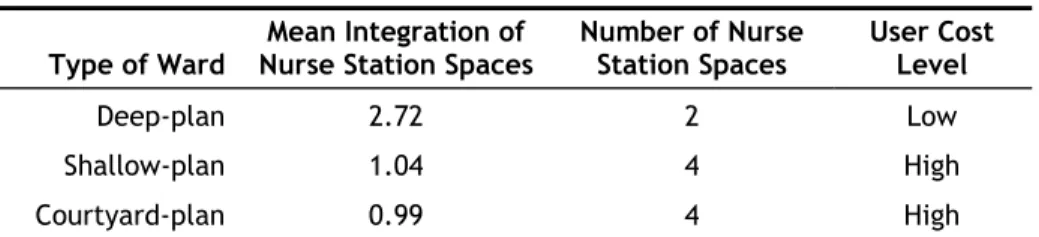
Focusing on nurse station spaces, it is determined that the deep-plan type has a higher integration value at the nurse station spaces (Table 3). This is due to the fewer number of nurse station spaces and the fact that the nurse station spaces are located in the more integrated spaces. This demonstrates that the nurse stations in the deep-plan type are located in crowded areas. Such locations enable physicians to easily access nurse station and staff, which allows them greater control of users in the facility. Thus, user costs in terms of accessibility to nurse stations and controllability of users’ behaviours is lower in
the deep-plan type than in the shallow-plan and the courtyard-plan types. Based on the same set of principles, user costs in the shallow-plan type are lower than user costs in the courtyard-plan type.
Table 3: Comparison of Nurse Station Spaces
Type of Ward Nurse Station Spaces Mean Integration of Number of Nurse Station Spaces User Cost Level
Deep-plan 2.72 2 Low
Shallow-plan 1.04 4 High
Courtyard-plan 0.99 4 High
Investigating corridors as shared space by users, and patient rooms as controlled spaces by physicians and staff, it is determined that the corridors and patient rooms are more integrated in the deep-plan type than other types (Table 4). There are three corridor spaces in the deep-plan type, nine corridor spaces in the shallow-plan type, and five corridor spaces in the courtyard-plan type. Each plan type has 36 patient rooms. Although the shallow-plan type has more corridors, these corridors in the shallow-plan type are more accessible than corridors in the courtyard-plan type. Patient rooms need to be easily controlled by physicians and nurses. More integrated patient rooms are more accessible than segregated patient rooms.
Table 4: Comparison of Corridor and Patient Rooms
Type of Ward Mean Integration of Corridor Spaces Mean Integration of Patient’s Room User Cost Level Deep-plan 1.77 1.05 Low Shallow-plan 1.12 0.82 Medium Courtyard-plan 0.92 0.71 High
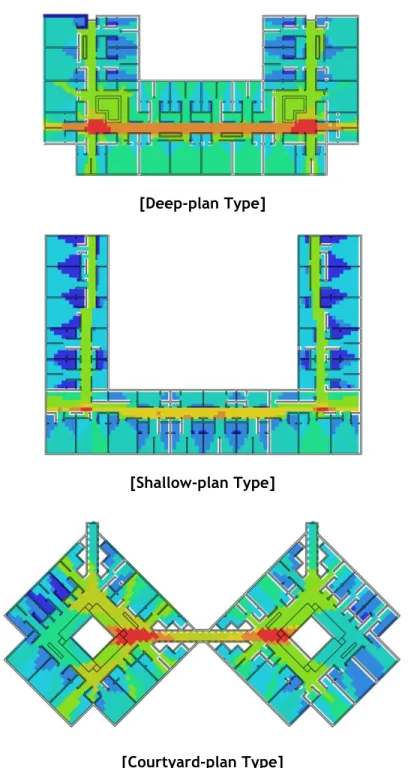
Grid Analysis
All three hypothetical ward design alternatives are evaluated using the visual graph analysis in Depthmap, called grid analysis. In order to do so, each space is divided into a specific grid and then analyzed in relation to the visual connection between grids. In the three visual integration maps, areas shaded in red are the most integrated spaces.
In the deep-plan type, the most integrated spaces are located in the vicinity of the nurse stations. This is the consistent to the findings from the convex map and j-graph analysis (Table 5). However, the nurse station spaces in the shallow-plan types have fewer integrated areas than those in the courtyard-plan type. In the courtyard-plan type, two nurse stations are located in blue coloured areas while two other nurse stations are located within red coloured areas. User productivity in terms of nurse station efficiency is high in the deep-plan type, medium in the courtyard-plan type, and low in the shallow-plan type. Thus, user costs for enhancing user productivity is low in the deep-shallow-plan type, high in the shallow-plan type, and medium in the courtyard-plan type.
Additionally, in the shallow-plan type, blue coloured areas are more prevalent than in other types. Since more blue coloured areas exist in the plan type, the shallow-plan type is more visually segregated and requires more observation activity in these
Lean Construction Journal 2010 page 62 www.leanconstructionjournal.org segregated spaces. Thus, the shallow-plan type would require more supervision and
therefore spending to eliminate security dead spots. Hospitals are required to have proper provisions to reduce the areas that lack visual supervision because they need to protect their patients from any harms.
[Deep-plan Type]
[Shallow-plan Type]
[Courtyard-plan Type]
Figure 5: Grid Analysis of Deep-plan, Shallow-plan, and Courtyard-plan Types (Red areas = more integrated spaces)
User costs are summarized in Table 5. According to the convex map and j-graph analysis, the deep-plan type has two “low” scores, the shallow-plan type has one “high” and one “medium” score, and the courtyard type has two “high” scores. In addition, according to the grid analysis, the deep-plan type has two “low” scores, the shallow-plan type has two “high” scores, and the courtyard-plan type has two “medium” scores. Using the
assumption that each factor has the same weight for decision of user costs, the deep-plan type is determined to be the lowest user cost type, and the shallow-plan type is expected to have the highest user costs.
Table 5: Summary of User Cost Levels
Type of Ward Level at A User Cost Level at B User Cost Level at C User Cost Level at D User Cost Total User Cost Level
Deep-plan Low Low Low Low Low
Shallow-plan High Medium High High High
Courtyard-plan High High Medium Medium Medium
A: Nurse stations (from Convex Map and J-Graph Analysis) B: Corridor space and patient’s room
C: Nurse stations (from Grid Analysis) D: Security dead spots
Discussion
The paper demonstrates the effectiveness of spatial analysis by using Space Syntax for user experience simulation in hospital ward design alternatives in order to compare user costs. The results of spatial configuration analysis are found to identify the best value design among the three alternative ward configurations in terms of user costs. This paper also demonstrates how designers can benefit from Space Syntax as an effective visual representation tool for set-based design.
Future research should be conducted with video-taping or radio-frequency identification (RFID) observation in order to verify correlations between the analysis results from Space Syntax, real movement of users and associated user costs. This paper assumes that the simulation results from Space Syntax can represent significant
correlations with user costs, although it is not evaluated in terms of financial value due to the current limitations of empirical evidence. For that reason, user costs are discussed in qualitative basis such as high, medium, or low with proportion to the simulation results. Despite the preliminary limitation of its implication, this study suggests that this
methodological implication of Space Syntax may be a useful and effective approach to support user cost analysis in Whole-life Target Value Design.
Conclusion
Customer values are better delivered by lowering user costs in hospital designs. Lower user costs can be obtained by using better designed built environments, represented by different levels of spatial integration.
The Space Syntax simulation results demonstrate that the deep-plan type represents the most economical design alternative in terms of user cost analysis. The deep-plan type has ideal spatial arrangement of nurse stations, corridors and patient rooms, and is found to be more efficient with regard to user productivity and security dead spots.
Lean Construction Journal 2010 page 64 www.leanconstructionjournal.org It is therefore concluded that this methodological implication of Space Syntax is
successfully tested to support Whole-life Target Value Design.
Space Syntax assures valid results of spatial analysis in relation to users’ movement within the built environment.
This approach allows designers to visually compare design alternatives relating to space planning during set-based design using spatial analysis applications such as Depthmap.
Most importantly, spatial analysis by Space Syntax helps reduce user costs by enhancing user productivity and reducing security dead spots.
Acknowledgments
We would like to express our gratitude to reviewers 4 and 5 and Prof. Kenneth Walsh for their comments and advices that enabled us to successfully complete our initial study in a hospital and to effectively establish the long-term plan for our interdisciplinary research.
References
Ballard, G. (2008). “The Lean Project Delivery System: An Update.” Lean Construction Journal 2008, 1-19.
Ballard, G. (2009). “How to Lower the River to Reveal the Rocks without Putting a Hole in Your Boat.” 2009 Construction Research Congress, 1029-1047.
Ballard, G. and Reiser, P. (2004). “The St. Olaf College Fieldhouse Project: A Case Study in Designing to Target Cost.” Proc. for the 12th Annual Conference of the International Group for Lean Construction (IGLC 12), August, Elsinore, Denmark, 234-249.
Evans, R., Haryott, R., Haste, N., and Jones, A. (1998). "The Long Term Costs of Owning and Using Buildings." The Royal Academy of Engineering, London, UK.
Hanson, J. (1998). Decoding Homes and Houses. Cambridge University Press, New York, NY, 328 pp.
Hillier, B. (1996). Space is the Machine: A Configurational Theory of Architecture. Cambridge University Press, New York, NY, 480 pp.
Hillier, B., and Hanson, J. (1984). The Social Logic of Space. Cambridge University Press, New York, NY, 296 pp.
Hillier, B., Penn, A., Hanson, J., Grajewski, T., and Xu, J. (1993). “Natural Movement: or, Configuration and Attraction in Urban Pedestrian Movement.” Environment and Planning B: Planning and Design, 20(1), 29-66.
Hughes, W., Ancell, D., Gruneberg, S. and Hirst, L. (2004) “Exposing the myth of the 1:5:200 ratio relating initial cost, maintenance and staffing costs of office buildings.” Paper presented at the ARCOM conference.
Ive, Graham (2006) “Re-examining the costs and value ratios of owning and occupying buildings.” Building Research & Information 34(3), 230-245.
Kim, Y. and Lara, F. (2009). “Changes in Korean Apartment Unit Plans from the 1990s to the 2000s: An Analysis of Spatial Configuration and Socio-cultural Implications of Apartment Units in Korea.” Proceedings of the 7th International Space Syntax Symposium, Edited by Daniel Koch, Lars Marcus and Jesper Steen, Stockholm, KTH, 056:1-056:12.
McCullough, C. (editor) (2009). Evidence-based Design for Healthcare Facilities. Sigma Theta Tau International, Indianapolis, IN, 288 pp.
McKee, M., and Healy, J. (editor) (2002). Hospitals in a Changing Europe. Open University Press, Buckingham, UK, 288 pp.
Read, S. (1997). “Space Syntax and the Dutch City.” Proceedings of the First International Space Syntax Conference, 02.01-02.13.
Weight, D. (2005). “Whole-life Costs: Hospital Design.” Building, Issue 38. (available at http://www.building.co.uk/story.asp?storycode=3056536).