Medical Malpractice Reform, the Supply of Physicians,
and Adverse Selection
Ethan M.J. Lieber
∗Revised October, 2013
Abstract
Malpractice reforms tend to reduce physician liability for harming patients. Because these reforms are passed at the state level, the costs of harming patients vary widely by geographic location. In this paper, I test whether malpractice reforms affect where physicians choose to practice and whether physicians who relocate in response to reforms are particularly prone to commit malpractice. Because a state’s own reforms can not separately identify moral hazard from adverse selection and because those reforms are likely to have direct impacts on measures of malpractice via the legal market, I focus attention on neighboring states’ reforms. I find that when a state’s neighbor passes a cap on noneconomic damages, both the physician to population ratio and the malpractice rate fall. This suggests that physicians who relocate in response to noneconomic damages caps are more likely to commit malpractice.
∗I would like to thank Gary Becker, Steve Cicala, Jonathan Hall, Devon Haskell, William Hubbard, Steve Levitt, Lee Lockwood, Anup Malani, Casey Mulligan, Derek Neal, Emily Oster, Genny Pham-Kanter, Mark Phillips, Jesse Shapiro, Andy Zuppann, seminar participants at the University of Chicago, and two referees for helpful comments and discussions.
Medical malpractice reform has been the subject of both public and academic debate since the 1970s. The American Medical Association portrays the liability system as arbitrary and physicians as constantly subjected to frivolous lawsuits. The American Association for Justice, the largest association of plaintiffs’ counsel, portrays physicians as more dangerous than auto accidents or guns.
Between 1970 and 2001, 45 of the 48 contiguous states in the U.S. passed at least one medical malpractice reform. In principal, reforms reduce physician liability (malpractice pressure) by limiting the probability of having to pay a malpractice claim and by censoring the right tail of the award distribution. The empirical evidence on the link between malprac-tice pressure and costs is somewhat mixed (e.g. Baicker and Chandra 2005b, Mello 2006), but Avraham (2007) found that reforms are associated with a 10 percent to 13 percent drop in the number of paid claims per doctor and Danzon (1986) found a 20 percent drop in the dollar value of the payment with reforms.1 These changes suggest that reforms might reduce physicians’ expected malpractice costs considerably.
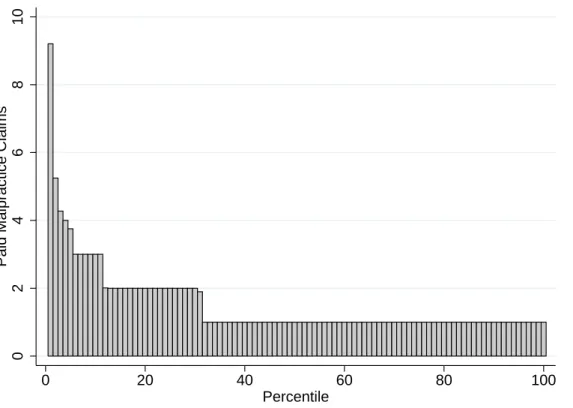
Is this necessarily a good thing? The reduction in malpractice costs will likely attract physicians, but will it attract physicians that the state wants? Figure 1 shows that of physi-cians who had at least one paid malpractice claim between 1990 and 2002, the distribution of paid malpractice claims is extremely skewed. Physicians in the bottom percentile paid 9.2 malpractice claims over the 13 year period while physicians from the 32nd percentile and up paid only one malpractice claim over the same period. Paid malpractice claims is one measure of actual malpractice that is likely to be positively correlated with the true, unob-servable amount of malpractice.2 Even if only a handful of physicians move in response to malpractice reforms, they might have large effects on the aggregate amount of malpractice in their area. This opens up the possibility that adverse selection is serious issue in the context of medical malpractice reform.
1Kessler and McClellan (2002a) find that the growth rates in claims per doctor are also reduced in states
that pass malpractice reforms.
2As shown in Section 5, estimated probabilities from other studies imply that the probability of
Simply regressing paid claims per doctor on measures of a state’s reform status is prob-lematic for a number of reasons. First, reforms affect not only physician behavior (probability of committing malpractice) and sorting (practicing in areas with favorable malpractice laws), but also patients’ decisions about filing malpractice claims. For a given amount of actual malpractice committed, fewer claims will be filed when reforms are put into place because those reforms reduce the expected payout of a claim. This will tend to cause a negative bias in a regression of paid claims per doctor on state’s reforms. Second, this regression would not be able to separate out the moral hazard from adverse selection impacts. In principal, reducing a physician’s liability for malpractice might reduce the costly effort that physicians must exert in order for their care to be above the malpractice threshold. Evidence on this behavioral impact is mixed. A series of papers on defensive medicine by Daniel Kessler and Mark McClellan argue that physicians over-provide medical care out of fear of legal liability (Kessler and McClellan 1996, Kessler and McClellan 2002a, Kessler and McClellan 2002b). Empirically, they find that reducing physician liability reduces the use of medical care and that there is no corresponding increase in deaths. However, Currie and MacLeod (2008) find that reductions in liability are associated with increases in preventable adverse outcomes and Iizuka (2013) finds that reforms increase preventable medical complications.
Instead of simply regressing paid claims per doctor on a state’s reform status, I use re-forms passed by adjacent states. As an example, consider Illinois, Indiana, and California. The costs of moving a medical practice to Indiana from Illinois are lower than from Cali-fornia. When Indiana passes a malpractice reform, physicians in Illinois will be more likely to relocate their practice to Indiana than physicians from California. For physicians who practice near the Illinois-Indiana border, they might not even have to move their residence, just their practice. If the physicians who stop practicing in Illinois are more likely to commit malpractice than the average doctor in Illinois, Illinois’s malpractice rate will fall. In Illinois, neither the incentives to commit malpractice (moral hazard) nor the incentives to file a claim have been altered by Indiana’s reform–only the composition of physicians changed. Thus
any change in the malpractice rate observed when Indiana passes a reform can be attributed to adverse or positive selection induced by the reform.
My empirical analysis proceeds in two stages. First, I show that physicians relocate their practice in response to nearby states’ malpractice reforms. Second, I test whether the malpractice rate in a state changes after one of its neighboring states passes a reform.
To demonstrate that neighboring states’ malpractice reforms affect where physicians prac-tice, I regress the supply of physicians in counties that border another state on those neigh-boring states’ malpractice reforms. For example, consider Figure 2. Physicians in Cook county face lower costs of relocating their practices to Indiana than do physicians in White-side or Lee counties to the northwest. When Indiana passes a reform, it is more likely that physicians from Cook county will relocate their practices to Indiana than physicians practic-ing in Whiteside or Lee counties. My analysis employs this logic for all counties that border other states. The majority of previous studies regress the supply of physicians in a state or county on that state’s own malpractice reforms (e.g. Hellinger and Encinosa 2003, Kessler, Sage and Becker 2005, Matsa 2007). Aside from the general concern that state laws may be correlated with unobservable factors that influence the state’s supply of physicians, a handful of authors have suggested more specific sources of endogeneity. Burghardt Jr. (1978) noticed that states that passed malpractice reforms tended to be states whose supply of physicians was growing more slowly; Danzon (2000) suggests that in recent years, states that adopted medical malpractice reforms may be those that adopted managed care to a greater degree; and Malani and Reif (2012) treat malpractice reforms as exogenous, but allow physicians to have anticipated the reforms and reacted to them prior to enactment.3 Although the pri-mary motivation for using neighboring states’ reforms is to provide a basis for the following analysis of malpractice rates, a lesser motivation is that a neighboring state’s reform is likely to provide a less biased estimate of the impact of reforms on physician supply.4 Although my
3Although malpractice reforms are exogenous in Malani and Reif (2012), the dynamic effects of
anticipa-tion will tend to create trends in physician supply around the date that reforms are passed. This could act like an omitted variable bias in static regression models.
strategy may provide a cleaner test of whether physicians relocate in response to malpractice reforms, it is still subject to a potential bias. If physicians from one border county move to an adjacent state and the initial state then passes a reform, my identification strategy will compare counties with an elevated level of physicians (treatment counties) to counties with a reduced level of physicians (control counties). My results suggest that when a county’s neighboring state passes a cap on noneconomic damages, the supply of physicians falls by 4 percent. While the estimates do not give the statewide change in the supply of physicians, they do show that the supply of physicians responds to malpractice reforms.
The second component of my empirical analysis examines the effect of neighbors’ reforms on the malpractice rate (henceforth referred to as the adverse selection analysis). The results suggest that the malpractice rate in a state falls by approximately 4 percent when a neighbor passes a cap on noneconomic damages. This result is robust to controlling for the composition of physicians, demand for medical care in the state, and a variety of specifications. These results suggest that the physicians who leave a state when its neighbor reforms are more likely to commit malpractice than those who stay behind. A back of the envelope calculation suggests that if all of a state’s neighbors were to pass caps on noneconomic damages, there would be 311 fewer deaths per year in that state. This calculation is subject to many caveats. It relies on a strong link between paid malpractice claims and deaths due to malpractice as well as a rough estimate of the rate of malpractice deaths per hospital discharge. In addition, if the extra physicians who moved to a state and commit malpractice also prevent a number of deaths from happening (because of the increased supply of physicians in the state), then the 311 figure clearly overstates the true change in deaths as a result of adverse selection. However, if true, the increased deaths due to malpractice would be comparable in magnitude to the number of homicides in the average state each year.
The remainder of the paper is laid out as follows. Background information on medical malpractice reforms is given in Section 1. Section 2 briefly describes the data. Section 3 bias implied for neighboring state’s reforms in the same regression.
describes the empirical strategy for the migration analysis. Section 4 reports the effects of neighbors’ malpractice reforms on physician location. Section 5 describes the empirical strategy for the adverse selection analysis. Section 6 analyzes the adverse selection results. Section 7 discusses the implications and concludes.
1
Background
Medical malpractice laws are passed at each state’s discretion. There have been no federal interventions. Because of this, there is considerable variation both across states and over time in the amount of protection that states offer physicians.5 Figure 3 maps the number of malpractice reforms in each state in 1970, 1980, 1990, and 2000. Darker states indicate a greater number of malpractice reforms in effect at that time. Very few states had reforms in 1970. By 2000, most states had reforms. The major wave of reforms occurred between 1980 and 1990. Not only did most states pass reforms, but many states passed multiple reforms in this time period.
The tort reforms used in this analysis are those passed most frequently by states and are largely aimed at reducing the payments physicians have to make. The reforms are:
• Cap on noneconomic damages: Noneconomic damages are awarded for non-monetary or quality of life losses, pain, and suffering. The cap limits the amount that will be paid to the plaintiff.
• Cap on punitive damages: Punitive damages are awarded to punish defendants.
• Cap on total damages: This cap limits the total dollar value of the award for all types of damages (economic, noneconomic, and punitive).
• Joint and several liability reform: In cases with multiple defendants, the reform of this common law rule stipulates that a defendant must have caused a large fraction of the
damages before she is responsible for paying the full amount of the damages awarded. The threshold required varies.
• Collateral source rule reform: The collateral source rule is another common law rule that bars using payments that the plaintiff received from other sources as evidence in court. The reform allows the payments to be admitted as evidence at the trial.
A review of empirical studies, Congressional Budget Office (2004), found noneconomic damages caps to be the most effective at reducing liability costs. As discussed in Currie and MacLeod (2008), the effect of the joint and several liability reform is less clear. Physicians who work at hospitals will be adversely affected by the reform because the hospital will no longer be the main target of the plaintiff. On the other hand, physicians in smaller practices will no longer be held liable for mistakes made by the nursing staff. Helland, Lakdawalla, Malani and Seabury (2011) studies the liability of prescription drug makers and suggests that punitive damages caps have important impacts on pharmaceutical companies’ liability. If relieving pharmaceuticals’ liability increases physician liability, then punitive damages caps might actually shift liability towards physicians, making it less clear how punitive damages caps will impact physician migration and malpractice. Given the findings in Congressional Budget Office (2004) and the issues discussed in Currie and MacLeod (2008) and Helland et al. (2011), the cap on punitive damages, joint and several liability reform, and the collateral source rule reform are not likely to have strong effects. They are included in the analysis for completeness.
As seen in Table 1, approximately half of the states had punitive damages caps, joint and several liability reform, and collateral source rule reform by 2000. One-third had noneco-nomic damages caps and ten percent had caps on total damages. Between 1990 and 2000, some of the reforms became less pervasive. This happened because state courts struck them down.
The response of physicians to medical malpractice reforms and malpractice insurance premiums has been studied previously. In Brennan, Mello and Studdert (2006), the authors
surveyed physicians in Pennsylvania and asked specifically if they intended to move their practice out of state to avoid the high malpractice costs. Approximately 4 percent of the physicians responded that they would definitely move their practice within two years while another 12 percent were very likely to move. Kessler et al. (2005) aggregate caps on total, noneconomic, and punitive damages with the collateral source rule reform and no manda-tory prejudgment interest into a single variable and find that three years after one of these reforms is passed, the supply of physicians in the state that passed the reform increased by approximately 3.3 percent relative to states that did not pass a reform. Hellinger and Encinosa (2003) finds positive effects of noneconomic damages caps on the long run supply of physicians. Matsa (2007) finds that damages caps have little overall effect, but increase the supply of specialists in rural areas. Klick and Stratmann (2007) addresses the endogeneity of a state’s malpractice reforms. The authors employ a triple difference strategy. They find that when a state passes a cap on noneconomic damages, the supply of physicians who are in specialties that have a high risk of malpractice claims increases somewhere between 4 and 6 percent more than physicians in low-risk specialties. Baicker and Chandra (2005b) and Baicker and Chandra (2005a) find no statistically significant effects of malpractice insurance premiums on the location decisions of physicians. However, even if malpractice insurance premiums do not affect physician location decisions, the time costs and emotional stress caused by being sued for malpractice will still provide an incentive to relocate one’s practice in response to reforms (Kessler and McClellan 2002a).
Another literature relates to the behavioral effects of malpractice reforms on physicians. There are many different behavioral effects induced by malpractice reform and relatively little is known about them. A series of papers by Kessler and McClellan (Kessler and McClellan 1996, Kessler and McClellan 2002a, Kessler and McClellan 2002b) test empirically whether physicians reduce the amount of health care they give each patient when malpractice liability is reduced. They interpret their findings to imply that physicians over-provide health care out of fear of liability. Currie and MacLeod (2008) find that on the margin, physicians
are not providing too much care or too high a quality of care. Their economic model implies that when physicians face less liability, they will reduce the quality of care provided (via reduced effort levels). More broadly, Klick and Stratmann (2007) and Lakdawalla and Seabury (2012) estimate the impact of medical malpractice reforms on death rates. Klick and Stratmann (2007) can not reject the null that reforms have no impact on infant mortality rates. Lakdawalla and Seabury (2012) find evidence that reducing malpractice costs would reduce medical care costs, but that that reduction is likely more than outweighed by an increase in mortality. To the extent of my knowledge, no papers have addressed the possibility of adverse or positive selection induced by medical malpractice reforms.
Because patients are able to travel to receive medical care, one might be concerned that a physician who relocates a short distance (just to the other side of the border) and sees some of her patients from her old location might be subject to the malpractice environment in the state she left. Symeonides (2006) and Symeonides (2008) show that in cases where the plaintiff traveled to another state for medical care, courts have applied the malpractice law of the state where the malpractice occurred, not the state in which the plaintiff resides.6 Thus, by moving their practices to new locations, physicians are able to take advantage of different legal environments.
2
Data
The majority of the data come from the 1993, 1998, and 2004 releases of the U.S. Department of Health and Human Services’ Area Resource File (ARF). The ARF is itself a collection of data from a large number of sources including the American Medical Association , the US Census Bureau, the Bureau of Labor Statistics, the National Center for Health Statistics, and many more. Although the ARFs are only from three years, they provide data from 1970 to 2001 at the county level. I use the counts of active, non-federal MDs involved in patient
6There has been one exception. Kentucky courts have applied Kentucky’s malpractice law to patients
who crossed into Indiana to receive medical care. Kentucky’s malpractice environment is more favorable to plaintiffs than is Indiana’s.
care (excluding those involved in research, residency programs, administrative positions, and so on) for the years 1970-2001 except for the years 1984, 1987 and 1991 because of missing data in those years. These data are drawn from the American Medical Association’s Physician Masterfile. Cherkin and Lawrence (1977) has found the Physician Masterfile to be an accurate source for physicians’ locations. Demographic information was not available for every year and was linearly interpolated for the relevant years.
There are at least three separate codings of malpractice reforms that have been used recently. Kessler and McClellan (1996) popularized the distinction between direct and in-direct reforms. In this coding, they collapse all damages caps, no mandatory prejudgment interest, and collateral-source-rule reforms into a single indicator and combine joint and caps on contingency fees, mandatory periodic payments, joint-and-several liability, and patient compensation funds into another. Although this approach has the benefit of adding few variables to the model, it forces any reform within each category to have the same impact (and no impact conditional on one of the other reforms being in place). The coding used by Currie and MacLeod (2008) creates indicators for the five most common malpractice reforms and allows them to enter the model separately. And finally, the extensive reform database Avraham (2011) tracks ten different tort reforms from 1980-2008. When choosing which coding to use, one must balance the advantages of having a sparse set of reform variables against the restrictions this places on the hetergeneity of impacts that different reforms could have. I choose to use the Currie and MacLeod coding because it allows some flexibility in reforms’ impacts while not including so many reforms that multicollinearity becomes a seri-ous issue (particularly for the adverse selection analysis in which there are a limited number of years). The malpractice reforms included are total damages caps, noneconomic damages caps, punitive damages caps, joint and several liability reform, and the collateral source rule reform. I have extended their measures back to the year 1970 relying on their available files supplemented with searches in legal databases.7
7Currie and MacLeod’s files are publicly available as described in Currie and MacLeod (2008). My coding
Data on the number of malpractice claims that received payment come from the National Practitioner Data Bank’s Public Use File (NPDB). Since 1990, federal law requires that the NPDB collect information on every payment made on behalf of a doctor resulting from a medical malpractice event. Although it is only available for a limited time frame, it is the most comprehensive dataset of paid medical malpractice claims available.8 The NPDB
includes claims against doctors as well as other health professionals. Since my analysis is focused on physicians, I only count those payments made on behalf of physicians. An advantage of the NPDB is that it contains not only the year the payment was made, but also the year of the event that led to the payment. Since I are interested in measuring actual malpractice (and not the resolution of malpractice claims per se), I use the year of the malpractice event. As mentioned in Avraham (2007), the relevant malpractice laws are those in place at the time of the injury, not the law in place at the date of filing or resolution. Additionally, some settlements are paid in multiple installments. For these cases, I only count the first payment of the series.
Medicare and Medicaid expenditure data from 1992 forward were gathered from the Centers for Medicare & Medicaid Services website. The data are personal health care ex-penditures on behalf of program enrollees to physicians.9
3
Physician Migration Empirical Strategy
To match the following adverse selection analysis, I look at counties that border other states before and after those neighboring states pass reforms. For example, consider Figure 2. Cook County in Illinois is adjacent to Lake County in Indiana. My identification strategy compares the stock of physicians in Cook County before and after Indiana passes reforms
8The NPDB contains not only paid malpractice claims, but counts of adverse actions taken against
physicians such as a state medical board restricting a physician’s license. A GAO report criticizes the NPDB, but mostly for it’s poor coverage of adverse actions taken against physicians (General Accounting Office 2000). As a result, I do not use the adverse action data.
9The data were accessible at http://www.cms.hhs.gov/NationalHealthExpendData/downloads/res-us.pdf
relative to counties that do not share a border with Indiana. So long as the costs of changing practice location are increasing with distance, physicians in Cook County are affected much more by Indiana’s reform than physicians in Whiteside County. A physician in Cook County would not have to move her home and family to practice medicine in Lake County while a physician in Whiteside County would. This logic is applied to the 1,129 counties in the contiguous United States that border other states.
Table 2 presents summary statistics for counties in the year before their neighbor passes a reform, as well as those same statistics for the neighboring county that will pass the reform the following year. As seen in the first row, although not statistically significant, the counties who are about to have reforming neighbors have a slightly elevated stock of physicians relative to the counties about to reform. This difference is consistent with the possibility that states pass reforms when their stock of physicians is falling: if some physicians leaving a state relocate just across the state border, then the stock of physicians in the county that is about to reform will be low relative to counties outside the state about to reform. To the extent that the observed difference is not just noise, it suggests a potential endogeneity issue for my identification strategy. On demographic characteristics such as gender, fraction urban, race, and age, the differences across the groups of counties are extremely small and nowhere near statistically distinguishable from zero. In Appendix A, I discuss identification further and show that even if neighbors’ reforms do not provide unbiased estimates of a reform’s impact, neighbors’ reforms do provide less biased estimates than a state’s own reforms.
To the extent that Whiteside County is treated, the results represent the migration from Cook County in excess of the migration from Whiteside County. The empirical analysis includes all counties in the continental United States that share a border with another state. Thus, I define neighbors to be counties in different states that share a common border.
The regression specification is
ln physiciansit populationit =Xitβ1+CitΓ1 +λt+λc+εit (1)
where i indexes the county, t indexes the year, X is a vector of variables indicating the reform status of the neighboring counties, C is a vector of control variables, λt is a set of
year fixed effects, andλc is a set of county fixed effects. The variables inC include controls
for population, per capita income, race, age, and urban status. These variables are included for county i as well as its neighbors. The main coefficients of interest are the β1s because
they indicate whether the number of physicians in county i decreases when a neighboring county’s state passes a malpractice reform. When neighbors are defined as counties that share a border, the X variables are a constant for counties on the interior of a state and so would not help to identify β1. When a county has multiple neighbors in other states,
population weighted averages of the reform status of those counties are used. Thus, the X variables lie between zero and one. As the variable approaches one, a larger fraction of the adjacent counties in other states have the particular reform in place. A state’s own reforms are excluded initially in equation (1) due to the endogeneity concerns, but their impact is assessed as part of the sensitivity analysis.
Standard errors are clustered by both adjacent state and own state using the multi-way clustering procedure described in Cameron, Gelbach and Miller (2010). It accounts for arbitrary autocorrelation for counties within a state as well as within a group of counties that all border a given state. Additionally, it adjusts the standard errors for the fact that malpractice reforms are passed at the state, not county, level (Moulton 1990).
4
Physician Migration Results
Column (1) of Table 3 reports estimates of equation (1). Only caps on neighbors’ noneco-nomic damages were found to be negative and statistically significant.10 The estimate implies
a 4.4 percent reduction in the physician supply when a neighboring state passes a cap on
10While not shown, all regressions that include a variable for the total damages cap also include a variable
that indicates whether there are exceptions to the rule. For example, in 1988, Colorado limited total damages to 1 million dollars with the exception that if a jury awarded economic damages greater than 1 million dollars, the court was allowed to award the full value of the economic damages suffered by the plaintiff.
noneconomic damages.11 As an example, if Indiana were to pass a cap on noneconomic
dam-ages, the counties in Illinois, Michigan, Ohio, and Kentucky that are adjacent to Indiana would see 4 percent declines in their stocks of physicians.
As mentioned previously, the Congressional Budget Office’s review of studies found that only noneconomic damages are consistently related to medical malpractice liability (Congressional Budget Office 2004). I find the same result here. Caps on total damages might be expected to be more effective than a cap on noneconomic damages (the raw point estimates imply as much), but I have very little statistical precision; only five states passed caps on total damages and only one of them was overturned (North Dakota’s). So with only 6 law changes, the estimate on total damages is less reliable than that on noneconomic damages that comes from more than 42 law changes. It is less clear whether I would expect neighbors’ caps on punitive damages to matter. As mentioned previously, Helland et al. (2011) suggests it is unclear whether the liability pressure physicians face after a punitive damages cap is implemented increases or decreases. Additionally, Eisenberg, Goerdt, Os-trom, Rottman and Wells (1997) provide evidence that punitive damages are rarely awarded in medical malpractice jury trials.
The estimated effects of neighbors’ reforms in (1) imply that physicians prefer to practice in states with reforms. In column (2), I include measures for a state’s own reform status. To the extent that these reforms are endogenous and correlated with outcomes and neighbors’ reforms, they will bias the estimates of neighboring state’s reforms. However, the results change very little from the first column to the second. The coefficients on state’s own reforms tend to be small in magnitude and statistically indistinguishable from zero. The exception is punitive damages caps. The two endogeneity stories discussed previously, that states may be passing reforms when their supply of physicians is falling or that they pass reforms as they are moving towards managed care, both suggest a downward bias in own-state reforms. In addition, it is possible that punitive damages caps actually increase physicians’ liability
11For expositional ease, I will refer to the physician to population ratio as the supply of physicians without
(Helland et al. 2011).12
If it is true that physicians relocate their practice to neighboring states when those neighbors pass reforms, there are a number of intuitive predictions. For example, if a county has a large population relative to neighboring counties, the effect of the neighboring state’s reform is going to be smaller than the average effect. The pair of columns in Table 3 labeled (3), show results from a regression in which a county’s population has been interacted with neighbors’ reform status. The main, or direct, effect of neighbors’ reforms are given in the column with subheading “main effect” with the interaction term in the next column. Because a neighbor’s noneconomic damages cap was the only reform found to be statistically significant in the basic specification, I focus attention on it here. The main effect is similar to the initial specification, changing from -0.044 to -0.040; the interaction effect is 0.012, though imprecisely estimated. The interaction implies that if I were to add fifty thousand residents to the average county whose neighbor had a noneconomic damages cap in place, the effect of the cap would go from a 3.9 percent decline in the physician population to a 3.4 percent decline.
As a county’s land area increases, the average distance a physician would have to travel to practice in the neighboring state increases. This suggests that the impact of neighbors’ reforms will decrease with county size. In the columns labeled (4) in Table 3, I display results where the effects of neighbors’ reforms are interacted with the county’s physical area (measured in thousands of square miles). Again, I find negative and statistically significant effects of a neighbor’s noneconomic damages cap. Evaluated at the average, a neighbor’s noneconomic damages cap reduces the stock of physicians in neighboring counties by 4.5 percent. If the county were to increase in size by one thousand square miles, the neighbor’s noneconomic damages cap would reduce the stock of physicians by 3.3 percent (p-value
12These estimates are not out of line with previous work. Studies have tended to either focus on total and
noneconomic damages (Hellinger and Encinosa 2003, Klick and Stratmann 2007, Matsa 2007, Sun 2006) or pool many reforms together into single variables (Kessler and McClellan 1996, Kessler and McClellan 2002b, Kessler and McClellan 2002a, Kessler et al. 2005). None of these studies have reported the coefficient for punitive damages separately, so it is difficult to ascertain whether my result is anomalous or not.
0.085).
The potential sources of endogeneity in the reforms discussed previously imply that a state’s own reforms could be related to underlying trends in its population of physicians. Is it also plausible that there are underlying trends in the stock of physicians reflected in neighbors’ malpractice reform status? To test whether there were any pretrends, I include a set of variables for each reform that indicate whether a county’s neighbor was going to pass that reform the following year, in two years, and so on up to four years in the future. If neighbors’ reforms reflect changes in the stock of physicians instead of causing it, we should find statistically significant effects on many of the pre-reform indicators. Table 4 shows that there is very little evidence for pretrends that might suggest neighbors’ reforms are reflecting trends instead of causing actual reductions in the supply of physicians to counties across the state border. Out of the twenty pre-reform indicators, only one is statistically distinguishable from zero.
Table 5 presents results from two more robustness checks. The first tests the effects of neighboring states reforms on counties adjacent to border counties and the second tests whether neighbors’ reforms are simply picking up migration trends in the overall population. Because the identification strategy uses counties that border other states, there is a natural robustness test using a subset of the interior counties. Instead of using counties that are directly adjacent to another state, I use counties that are adjacent to counties that border another state. I assign the reform status of border counties to these “near-border” counties. In Figure 2, Lee County Illinois is adjacent to Whiteside County which is in turn adjacent to Iowa. The test assigns Whiteside County’sX variables to the Lee County. When a near-border county is adjacent to multiple near-border counties, I use population weighted averages of the border counties’ Xs.
This specification will identify if there is still a distance gradient among the near-border counties. As seen in Table 5, the estimated coefficients on neighbors’ reforms tend to be closer to zero than their counterparts in the baseline specification. If the premise of the
identification strategy is true, one would expect that the estimates on the effects of neighbors’ reforms will be smaller for these interior counties because of the greater geographical distance from the reforming state. This is born out in the data.
One might be concerned that the neighbors’ reform variables are just picking up move-ments in the general population. To test this hypothesis, I regress the log of the population in a county against neighbors’ reform status and the list of covariates.13 If this story were true, then I should find that neighbors’ reforms have the same effect on population as they do on the population of physicians. The results from this regression are displayed in the second column of Table 5. None of the variables for neighbors’ reforms are statistically re-lated to movements in the general population and the point estimates tend to point in the wrong direction. For instance, even if the 0.005 point estimate on a neighbor’s noneconomic damages cap were true, it would imply that people are coming to the county at the same time that doctors are leaving.
5
Adverse Selection Empirical Strategy
Ideally, malpractice events would be observable at the individual level. However, those data do not exist for a national analysis. Instead, I use the number of paid malpractice claims per doctor in a given state and year. Note that I do not assume that a malpractice claim implies an actual instance of malpractice by a physician. I use only malpractice claims that received payment.14
As mentioned in Section 2, the measure of paid malpractice claims is only available at the state level. This necessitates that the adverse selection analysis be conducted at that level. I use the same basic strategy that was used in the migration analysis: examine the effect of a neighbor’s reform, not a state’s own reform. In particular, I study what I refer to as the malpractice rate, the number of paid claims in a state divided by the number of
13The log of the population is then excluded from the set of observable covariates.
14Calculations laid out in Appendix B imply that the probability of malpractice conditional on the claim
physicians in that state. As seen in Table 6, on average, there were about 2.5 paid claims per 100 doctors in the sample.
It would be problematic to analyze the malpractice rate in a state before and after that state passes reforms. In addition to the standard endogeneity concern, there are effects in the legal market and changes in the incentives physicians face. In the legal market, the reforms make it less profitable to file a claim. Since not all instances of medical malpractice are brought as claims (e.g. Brennan, Leape, Laird, Hebert, Localio, Lawthers, Newhouse, Weiler and Hiatt 1991, Leape, Brennan, Laird, Lawthers, Localio, Barnes, Hebert, Newhouse, Weiler and Hiatt 1991, White 1994), the fraction of malpractice events that turn into claims should drop. This in turn implies that the number of claims per doctor will fall. This is particularly noteworthy because it implies that an estimated impact of a state’s own reforms will not necessarily be of similar magnitude, but opposite in sign, of a neighbor’s reforms: The neighbor’s reform does not change patients’ incentives to file claims, but a state’s own reform does. In addition, for physicians, the costs of harming patients generally decreases when reforms are passed. Since not harming patients is costly, the decrease in the expected costs of harming patients will likely lead to an increase in malpractice. This should in turn lead to an increase in claims per doctor. These two forces push in opposite directions and make the effects of a state’s own reforms on malpractice rates ambiguous.
The proposed identification strategy is able to sidestep the problems just mentioned. For example, when Indiana passes a medical malpractice reform, I study the malpractice rate in Illinois. In this case, I do not have to worry about changes in incentives that doctors and lawyers face in Illinois because the legal malpractice environment in Illinois has not changed. All that has changed is the composition of physicians in Illinois, allowing us to interpret changes in the malpractice rate as representing the change in average quality of physicians in Illinois. As seen in Table 6, in the average state and year, approximately 39 percent of a state’s neighbors had a noneconomic damages cap in place.
My estimating equation is ln malpracticeit doctorsit =Xitβ2+CitΓ2+λt+λs+ρst+εit (2)
where i indexes the state, t indexes the year, X is a vector of variables indicating the reform status of the neighboring states, C is a vector of control variables, λt is a set of year
fixed effects, λs is a set of state fixed effects, and ρst is a set of state specific linear time
trends. The set of control variables used in the migration analysis as well as controls for the fraction of physicians who are general practitioners, surgeons, or other specialties are used in equation (2), but aggregated up to the state level. Basic summary statistics for these latter variables are presented in Table 6. The Xit are population weighted averages of the
reform status of states adjacent to state i. For example, Kansas shares parts of its border with Missouri, Nebraska, Colorado, and Oklahoma. The Xs for Kansas are the population weighted averages of the reform status of those four states. Again, the Xs range between zero and one. As a larger fraction of the states pass the reform, the particular X for that reform will approach one.
The main coefficients of interest are theβ2s because they indicate whether the malpractice
rate in state i decreases when a neighboring state passes a malpractice reform. Note that if states only shared a border with one other state, then a neighbor’s reform would not vary independently of a state’s own reform and so β2 would not be identified (at least not
separately from a state’s own reform). However, the average state neighbors between 4 and 5 other states. This allows neighbors’ reforms to vary independently from states’ own reforms and provides the identification. To find the percentage change in malpractice rates implied by the coefficients, I use: 100∗ (exp(β∆X)− 1). The data in this analysis range from 1990 to 2002 and Alaska, Hawaii, and Washington D.C. have been excluded. The measure of malpractice is the number of events in the state and year that eventually led to a malpractice claim and payment at some later date on behalf of the physician.
Studdert, Mello, Gawande, Gandhi, Kachalia, Yoon, Puopolo and Brennan (2006) find that the average malpractice claim lasts 5 years from the date of the potential malpractice event until resolution of the claim and that one in three lasts six years or more. To the extent that malpractice claims are unresolved many years later, the measured malpractice rate will understate the true malpractice rate. If states that process claims slowly happen to be near states that tend to pass reforms, then β2 will be biased up. To try to control for
this possibility, I include state-specific linear trends in the specification.
Standard errors are clustered by state, not adjacent state. Because each state has a unique set of adjacent states, one can not simply cluster on an “adjacent state” variable. Instead, I would have to create a unique variable for each state and set it equal to one when that state is an adjacent state to the current observation. Using the standard multi-way clustering method described in Cameron et al. (2010) would require 249−1 covariance
matrix calculations, a prohibitively large number. In an exploratory analysis, I estimated equation (2) and clustered the standard errors by state and four or five of the adjacent state variables (this was done multiple times with randomly chosen subsets of the 48 adjacent state variables). In each case, the resulting standard errors were actually smaller than the standard errors obtained when just clustering on own state.15 Because of these issues, I
cluster by own state but acknowledge there may be some remaining correlation in the error terms that bias the standard errors.
Note that only one state, South Dakota, passed a cap on total damages in the limited time frame available in the NPDB. As such, the estimated impact of that reform should be viewed with considerable caution.
15The reduction in the standard errors is likely due to a small sample bias introduced by the small number
6
Adverse Selection Results
Evidence of adverse selection will come in the form of neighbors’ reforms having negative effects on the malpractice rate in a state. If the malpractice rate in a state declines when neighbors pass reforms, that implies that physicians with high malpractice rates left. The opposite case holds for positive selection. Table 7 displays results from estimating versions of equation 2. In column (1), the estimated effects of a neighbor’s cap on noneconomic damages is -0.232 and statistically significant at the 5 percent level. The coefficients on the other reforms are not statistically distinguishable from zero at conventional levels. Because the average state has five neighbors, the coefficients in Table 7 should be multiplied by 0.2 and transformed; the resulting number implies the percentage change in the malpractice rate when a state’s neighbor passes the reform. The cap on noneconomic damages by a neighbor implies a reduction of 4.5 percent.
Certain physician specialties, e.g. surgeons, are more likely to have malpractice suits brought against them than other specialties. If neighbors’ malpractice reforms simply cause high-risk specialists to change their practice locations, that could cause a spurious reduction in the malpractice rate in a state. In the next column of Table 7, I include separate controls for the fraction of physicians who are general practitioners, surgeons, or have other specialties (the physician specialty data are at the state by year level). The results change very little suggesting that it was not simply that higher-risk categories of physicians left the state.
One might think that when a state’s neighbors pass malpractice reforms and physicians leave, the price of medical services goes up which leads to a decrease in the quantity con-sumed. In this scenario, the number of patient visits per doctor in the non-reform state might decrease. Then even without a change in the quality of physicians, the number of malpractice claims per doctor could decrease. Column (3) reports results from equation (2) in which the total expenditures on physicians in the state is held constant. While not ideal, the state level Medicare and Medicaid expenditure data go some distance toward controlling for changes in the consumption of physician services. The estimated effects are extremely
similar to those in column (1), the baseline specification.
Thus far, a state’s own reforms have been omitted from the regression equation due to concerns that they are endogenous. They are included in the specification reported in column (4) of Table 7. The estimated impact of noneconomic damages falls very slightly in magni-tude, but remains statistically distinguishable from zero at conventional levels. For the most part, the estimated impacts of neighbors’ reforms are very similar to the previous estimates. As mentioned in Section 5, own state reforms are separately identifiable from neighboring states’ reforms because 47 of the 48 contiguous states have more than 1 neighboring state (Maine is the exception).
It is difficult to interpret the estimated coefficients on a state’s own reforms presented in column (4). As mentioned previously, it is not obvious that they should be opposite in sign and of similar magnitude to neighbors’ reforms: a state’s own reforms reduce the incentives to file malpractice claims. This could explain the negative coefficient observed on state’s own noneconomic damages cap. The effects on the legal market are not present in the estimates of a neighbor’s reform and so will tend to push own-state reforms to be negative like neighbors’ reforms. As mentioned in section 5, only one state passed a cap on total damages between 1990 and 2002. Thus the estimated impact of a cap on total damages is based on a single observation and should be treated with skepticism.
Malpractice claims can take a long time to be resolved; the average claim takes five years to be resolved (Studdert et al. 2006). Thus far, I have used data from malpractice claims paid no later than 2002 and state specific time trends to try to avoid effects of the long tail of claims. In principle, if the duration of malpractice claims that take a long time to resolve are unaffected by neighbors’ reforms status, my results will be unaffected by the long tail. However, to test whether the malpractice cases that take a very long time to be resolved affect my results, I can restrict the sample to malpractice events that occurred in the first two-thirds of my sample, between 1990 and 1998. Since the NPDB data are from June 30, 2008, my restricted sample includes all paid malpractice claims that were resolved within
9.5 years of being filed. When I restrict the sample in this way, I find a slightly stronger effect of neighbors’ noneconomic damages caps, but the point estimate is not statistically distinguishable from my previous estimates. None of the other reforms are found to be statistically significant. These results imply that the long tail of malpractice claims is not biasing my results.
I also assess the importance of including the state-specific trends. For the full sample up to 2002, omitting the state-specific trends does push the point estimates towards zero as suggested in Section 5 (for noneconomic damage caps, the point estimate is -0.04). However, another way to examine the impact of differing claim processing speeds across states is to restrict the sample to 1998 or earlier and omit the state-specific trends. The idea is that by limiting the sample to the very early years, the number of unresolved claims generated by events that took place before 1998 is very small and so the malpractice rates will be good measures of true malpractce. For this sample, omitting state specific trends leads to a point estimate of -0.218 for noneconomic damages caps. This is very similar to our estimate for the full sample that includes state-specific linear trends (column (3) of Table 7). In addition, adding in state-specific higher order trends produces estimates extremely similar in magnitude to those that use simple state-specific linear trends and the full sample of data. For a fourth order polynomial, the coefficient on noneconomic damages caps is -0.18; for a fifth order polynomial, it is -0.21.
It is not obvious that a neighbor’s malpractice reform affects a state more than a non-neighboring state’s reform. For example, people in Southern California are probably just as affected by Washington state’s reforms as they are by Oregon’s. This line of thinking implies that states that have a greater land area will see smaller effects of reforms than states with a smaller land area. In the columns labeled (4) in Table 7, I report results from a regression where neighbors’ reforms have been interacted with how many square miles are in a state (measured in 10,000s of square miles). The direct effect of neighbors’ caps on noneconomic damages is still negative and statistically significant. The interaction term for noneconomic
damages suggests that as a state becomes larger, the effect of a neighbor’s reform falls. For instance, if a state were to increase in size by 10,000 square miles, the marginal effect of a neighbor’s reform would fall by approximately 2 percent.
7
Discussion
This paper examines whether medical malpractice reforms affect where physicians practice and whether the physicians who relocate in response to reforms are more or less likely to commit malpractice. I employ an identification strategy that disentangles the impact of adverse selection from those of moral hazard and changes in the incentives to file malpractice claims. I use the same identification strategy to test whether physicians do in fact relocate in response to reforms. My estimates suggest that physicians do relocate and that those who do are more likely to commit malpractice than physicians who do not move in response to malpractice reforms. I intepret this as evidence of adverse selection.
But even if the physicians who relocate are prone to malpractice, does it matter? The Harvard Medical Practice Study estimated that out of 2.6 million hospital discharges, there were 6,895 deaths due to medical malpractice in New York in 1984 (Brennan et al. 1991). That translates to one malpractice death per 377 discharges. If that rate were applied to the 31.7 million discharges from non-federal, short stay hospitals in 2000 (DeFrances, Cullen and Kozak 2007), it would imply that there are 81,201 deaths per year due to malpractice. If paid malpractice claims map directly into deaths due to malpractice, then a state’s malpractice deaths would fall by about 19 percent if all of its neighbors were to pass caps on noneconomic damages. That would reduce the number of malpractice deaths in the state by 311. For comparison, the average state had 335 homicides, 313 Parkinson’s deaths, and 290 HIV deaths in 2000. The reduction in malpractice would be the equivalent of preventing all homicide, Parkinson, or HIV deaths. Of course, this simple, back of the envelope, calculation has a number of important caveats. Because the Harvard Medical Practice Study is the only
large-scale study that provides an estimate of the rate of malpractice deaths, it is unlikely to be representative of the nation at large. The extrapolation to the total number of deaths then is quite speculative. In addition, attracting physicians, even those who are prone to malpractice, could lead to some lives being saved. Having more doctors per person is likely to increase access to care via shorter waiting times or lower prices in other forms. As long as the physicians who moved are not always committing malpractice, they could be saving lives as well. That would tend to balance out the physicians’ net impacts on deaths. Because of these reasons, it is difficult to gauge the welfare impacts due to adverse selection, let alone those of malpractice reforms more generally.
References
Avraham, Ronen, “An Empirical Study of the Impact of Tort Reforms on Medical Mal-practice Setllement Payments,” Journal of Legal Studies, June 2007,36, S183–S229.
, “Database of State Tort Law Reforms (3rd),” 2011.
Baicker, Katherine and Amitabh Chandra, “Defensive Medicine and Disappearing Doctors?,” Regulation, 2005,28 (3), 24 – 31.
and , “The Effect of Malpractice Liability on the Delivery of Health Care,”Forum for Health Economics & Policy, 2005, 8, 1 – 27.
Brennan, Troyen A., Lucian L. Leape, Nan Laird, Liesi Hebert, A. Russell Lo-calio, Ann G. Lawthers, Joseph P. Newhouse, Paul C. Weiler, and Howard Hiatt, “Incidence of Adverse Events and Negligence in Hospitalized Patients: Results of the Harvard Medical Practice Study I,”New England Journal of Medicine, 1991,324
(6), 370–376.
, Michelle M. Mello, and David M. Studdert, “Liability, Patient Safety, and De-fensive Medicine: What Does the Future Hold?,” in William M. Sage and Rogan Kersh,
eds., Medical Malpractice and the U.S. Health Care System, New York: Cambridge University Press, 2006, pp. 93 – 114.
Burghardt Jr., Galen, “Medical Malpractice and the Supply of Physicians,” in Simon Rottenberg, ed., The Economics of Medical Malpractice, Washington, D.C.: American Enterprise Insitute for Public Policy Research, 1978, pp. 103 – 154.
Cameron, Colin A., Jonah B. Gelbach, and Douglas L. Miller, “Robust Inference with Multi-way Clustering,” Journal of Business and Economic Statistics, 2010, forth-coming.
Cherkin, Dan and David Lawrence, “An Evaluation of the American Medical Associa-tion’s Physician Masterfile as a Data Source: Evidence from One State’s Experience,”
Medical Care, September 1977, 15(9), 767–779.
Congressional Budget Office,The Effects of Tort Reform: Evidence from the StatesJune 2004.
Currie, Janet and W. Bentley MacLeod, “First Do No Harm? Tort Reform and Birth Outcomes,” Quarterly Journal of Economics, May 2008, 123(2), 795–830.
Danzon, Patricia, “The Frequency and Severity of Medical Malpractice Claims: New Evidence,” Law and Contemporary Problems, 1986, 49 (2), 57–84.
Danzon, Patricia M., “Liability for Medical Malpractice,” in Anthony J. Culyer and Joseph P. Newhouse, eds., Handbook of Health Economics, Vol. 1, Elsevier B.V., 2000, pp. 1341–1404.
DeFrances, Carol J., Karen A. Cullen, and Lola Jean Kozak, “National
Hospi-tal Discharge Survey: 2005 Annual Summary With Detailed Diagnosis and Procedure Data,” Technical Report, National Center for Health Statistics December 2007.
Eisenberg, Theodore, John Goerdt, Brian Ostrom, David Rottman, and Mar-tin T. Wells, “The Predictability of Punitive Damages,”The Journal of Legal Studies, 1997, 26 (2), 623–661.
Farber, Henry S. and Michelle J. White, “Medical Malpractice: An Empirical Ex-amination of the Litigation Process,” The RAND Journal of Economics, 1991, 22 (2), 199–217.
General Accounting Office, “National Pracititioner Data Bank, Major Improvements are Needed to Enhance Data Bank’s Reliability,” November 2000.
Helland, Eric, Darius Lakdawalla, Anup Malani, and Seth Seabury, “Tort Liability and the Market for Prescription Drugs,” Available at SSRN 1883691, 2011.
Hellinger, Fred J. and William E. Encinosa, “The Impact of State Laws Limiting Malpractice Awards on the Geographic Distribution of Physicians,” Technical Report, Agency for Healthcare Research and Quality, Center for Organization and Delivery Studies July 2003.
Iizuka, Toshiaki, “Does Higher Malpractice Pressure Deter Medical Errors?,” Journal of Law and Economics, 2013, 56(1), 161–188.
Kauermann, G¨oran and Raymond J. Carroll, “A Note on the Efficiency of Sandwich Covariance Matrix Estimation,” Journal of the American Statistical Association, 2001,
96 (456), 1387–1396.
Kersh, Rogan, “Medical Malpractice and the New Politics of Health Care,” in William M. Sage and Rogan Kersh, eds., Medical Malpractice and the U.S. Health Care System, New York: Cambridge University Press, 2006, pp. 43 – 67.
Kessler, Daniel and Mark McClellan, “Do Doctors Practice Defensive Medicine?,”
and , “How Liability Law Effects Medical Productivity,” Journal of Health Eco-nomics, 2002,21, 931–955.
and , “Malpractice Law and Health Care Reform: Optimal Liability Policy in an Era of Managed Care,” Journal of Public Economics, 2002, 84, 175–197.
, William M. Sage, and David J. Becker, “Impact of Malpractice Reforms on the Supply of Physician Services,”Journal of the American Medical Association, June 2005,
293 (21), 2618–2625.
Klick, Jonathan and Thomas Stratmann, “Medical Malpractice Reform and Physicians in High Risk Specialties,” Journal of Legal Studies, June 2007, 36(S2), S121–S142.
Lakdawalla, Darius N and Seth A Seabury, “The welfare effects of medical malpractice liability,” International review of law and economics, 2012.
Leape, Lucian L., Troyen A. Brennan, Nan Laird, Ann G. Lawthers, A. Russell Localio, Benjamin A. Barnes, Liesi Hebert, Joseph P. Newhouse, Paul C. Weiler, and Howard Hiatt, “The Nature of Adverse Events in Hospitalized Patients: Results of the Harvard medical Practice Study II,” New England Journal of Medicine, 1991, 324 (5), 377–384.
Malani, Anup and Julian Reif, “Endogeneity or Anticipation? Evidence from the Effect of Tort Reform on Physician Supply,” January 2012.
Matsa, David A., “Does Malpractice Liability Keep the Doctor Away? Evidence From Tort Reform Damage Caps,”Journal of Legal Studies, June 2007, 36 (S2), S143–S182.
Mello, Michelle M., “Medical Malpractice: Impact of the Crisis and Effect of State Tort Reforms,” Technical Report, Robert Wood Johnson Foundation May 2006.
Moulton, Brent R., “An Illustration of a Pitfall in Estimating the Effects of Aggregate Variables on Micro Units,” The Review of Economics and Statistics, 1990,72 (2), 334– 338.
Sage, William M., “Malpractice Reform as a Health Policy Problem,” in William M. Sage and Rogan Kersh, eds., Medical Malpractice and the U.S. Health Care System, New York: Cambridge University Press, 2006, pp. 30 – 42.
Studdert, David M., Michelle M. Mello, Atul A. Gawande, Tejal K. Gandhi, Allen Kachalia, Catherine Yoon, Ann Louise Puopolo, and Troyen A. Bren-nan, “Claims, Errors, and Compensation Payments in Medical Malpractice Litigation,”
New England Journal of Medicine, May 2006, 354 (19), 2024–2033.
Sun, Eric C., “Essays on Product Liability and Medical Malpractice.” PhD dissertation, Graduate School of Business, University of Chicago December 2006.
Symeonides, Symeon C., “Choice of Law in the American Courts in 2006: Twentieth Annual Survey,” American Journal of Comparative Law, 2006,54, 697–788.
, “Choice of Law in the American Courts in 2007: Twenty-First Annual Survey,” Amer-ican Journal of Comparative Law, 2008,56, 243–319.
Taragin, M.I., Laura R. Willett, Adam P. Wilczek, Richard Trout, and Jeffrey L. Carson, “The Influence of Standard of Care and Severity of Injury on the Resolution of Medical Malpractice Claims,” Annals of Internal Medicine, 1992, 172, 780–784.
White, Michelle J., “The Value of Liability in Medical Malpractice,” Health Affairs, Fall 1994, pp. 75–87.
0 2 4 6 8 10
Paid Malpractice Claims
0 20 40 60 80 100
Percentile
® Figure 1: Distribution of Paid Malpractice Claims, 1990 - 2002
Number of Reforms 0 1 2 3 4 5
1970
1980
1990
2000
Table 1: Summary Statistics for Reforms
1970 1980 1990 2000
No. reforms in place 0.15 0.60 1.86 1.94
Fraction of States with Law in Effect:
Noneconomic damages cap 0.00 0.15 0.35 0.33
Total damages cap 0.00 0.06 0.10 0.08
Punitive damages cap 0.13 0.13 0.35 0.48
Joint and several liability 0.02 0.04 0.52 0.56
Collateral source rule 0.00 0.23 0.53 0.48
The unit of observation is the state in a given year. Alaska, Hawaii, and Washington D.C. have been excluded from the calculations. The values represent the fraction of states that have the reform in place except for those in the top row labeled "No. reforms in place" which gives the average
number of reforms in place in that year.
Table 2: Summary Statistics for Counties Neighbor reforms Reforming county p-value of difference
Doctors per 1,000 people 0.86 0.83 0.40
Fraction male 0.49 0.49 0.88 Fraction urban 0.39 0.38 0.42 Fraction white 0.89 0.89 0.64 Fraction black 0.07 0.08 0.78 Fraction age<20 0.33 0.33 0.63 Fraction 20<age<60 0.49 0.49 0.50
First column presents summary statistics for counties with a neighbor that will pass at least one reform in the following year. The second column gives means for the
corresponding reforming counties in the year prior to reform. The last column presents the p-value for the difference of the two means.
T able 3: Effects of Reforms on the Supply of Ph ysicians M ain ef fect In ter act io n: p op ula tio n M ain ef fect In ter act io n: la nd a rea (1) (2) N ei ghbors ' R ef orms N one conomi c D amage s Cap -0. 044** -0. 040* -0. 049** 0. 012 -0. 058* 0. 012 (0. 015) (0. 016) (0. 016) (0. 012) (0. 025) (0. 014) Total D amage s Cap -0. 052 -0. 051 -0. 055 0. 003 -0. 065 0. 016 (0. 036) (0. 035) (0. 032) (0. 003) (0. 046) (0. 055) Pu nit iv e D am ag es C ap -0. 016 -0. 018 -0. 023 0. 008 0 -0. 016 (0. 019) (0. 020) (0. 019) (0. 006) (0. 021) (0. 010) Jo in t a nd S ev er al L ia bilit y 0. 002 0. 003 -0. 006 0. 01 0. 014 -0. 008 (0. 022) (0. 021) (0. 021) (0. 008) (0. 024) (0. 009) C olla ter al S ou rce 0. 007 0. 006 -0. 002 0. 006 0. 009 -0. 004 (0. 016) (0. 017) (0. 019) (0. 008) (0. 019) (0. 007) Own State 's R ef orms N one conomi c D amage s Cap 0. 016 (0. 018) Total D amage s Cap 0. 012 (0. 046) Pu nit iv e D am ag es C ap -0. 049* (0. 022) Jo in t a nd S ev er al L ia bilit y -0. 004 (0. 021) C olla ter al S ou rce -0. 033 (0. 021) A dj . R -S qu ar ed 0. 86 0. 86 (3) (4) D epe nde nt v ari abl e i s l og phy sic ian- to-popul ati on rati o. D ata f rom 1970 to 2001 e xc ept 1984, 1987, and 1991. 31, 735 obs erv ati ons . Sampl e i nc lude s co un ties a dj acen t t o co un ties in a no th er s ta te. R eg res sio ns in clu de co va ria tes d es cr ib ed in t he t ex t a nd y ea r a nd co un ty fix ed ef fect s. S ta nd ar d er ro rs in br ack et s h av e b een clu st er ed b y a dj acen t s ta te a nd o wn s ta te. R eg res sio n ( 1) is b as elin e. R eg res sio n ( 2) a dd s o w n s ta te r ef or m s. R eg res sio n ( 3) in clu des in ter act io n b et w een n eig hb or s' r ef or m s a nd co un ty p op ula tio n ( 10 0,0 00 s) . R eg res sio n ( 4) in clu des in ter act io n o f n eig hb or s' r ef or m w ith co un ty 's la nd a rea (in 1, 000s of s quare mi le s). * p<. 05, ** p<. 01. 0. 86 0. 86
Table 4: Timing of Effects of Neighbors’ Reforms on Physician Migration Noneconomic Damages Cap Total Damages Cap Punitive Damages Cap Joint and Several Liability Collateral Source (1) (2) (3) (4) (5)
Neighbor will pass reform in:
4 years 0.009 -0.017 0.015 -0.003 -0.004 (0.017) (0.021) (0.016) (0.020) (0.021) 3 years -0.006 -0.021 -0.004 0.006 -0.002 (0.014) (0.019) (0.023) (0.018) (0.018) 2 years -0.016 -0.003 -0.002 0.005 -0.006 (0.021) (0.025) (0.025) (0.017) (0.018) 1 year -0.006 -0.068* -0.022 0.019 -0.011 (0.018) (0.031) (0.024) (0.017) (0.016) Reform in place -0.053* -0.070* -0.017 -0.002 0.006 (0.022) (0.029) (0.022) (0.021) (0.018)
Results are from a single regression that includes an indicator for whether the neighboring state has the specified reform in place as well as indicators for whether the neighbor will pass the reform in a given number of years (1-4). Regular covariates included. The number of observations is 27,231. Standard errors are
Table 5: Migration Analysis Falsification Tests
Adjacent to border
counties ln(population)
(1) (2)
Neighbors' Reforms
Noneconomic Damages Cap -0.035 0.005
(0.021) (0.013)
Total Damages Cap -0.002 -0.026
(0.030) (0.014)
Punitive Damages Cap -0.006 0.003
(0.018) -0.012
Joint and Several Liability 0.029 -0.010
(0.022) (0.013)
Collateral Source 0.002 0.009
(0.023) (0.010)
Column 1 uses the sample of interior counties. The number of observations in column 1 is 28,500. The data are from 1970 to 2001 with the exceptions of 1984, 1987, and 1991 because the number of doctors is missing for those years. Both columns include per capita income, percent urban, fractions of population white, male, younger than 20, and older than 59 and the same variables (averaged) for neighboring counties in other states. (1) restricts sample to counties adjacent to border counties (but are not border counties themselves). Dependent variable in (2) is the natural logarithm of the population for border counties. Standard errors clustered by own and adjacent state. * p<.05, ** p<.01.
Table 6: Summary Statistics for Adverse Selection Analysis
Mean Std. Dev.
Paid claims per 100 doctors 2.47 1.05
Number of adjacent states 4.48 1.61
Fraction of neighbors with reform:
Noneconomic damages cap 0.39 0.29
Total damages cap 0.09 0.13
Punitive damages cap 0.48 0.28
Joint and several liability 0.59 0.32
Collateral source 0.52 0.35
Doctors per 1000 population 1.99 0.45
Fraction doctors general practitioners 0.18 0.06
Fraction doctors surgeons 0.28 0.05
Fraction doctors other specialty 0.27 0.05
Summary statistics for data used in the adverse selection analysis. Data range from 1990-2002 for the 48 contiguous states. Omitted doctor specialty is internal medicine.
T able 7: Effects of Re forms on Malpractice Rate B as elin e Ph ys icia n sp ecia lty Total c are control In clu de o w n re forms Y ear <= 1998 M ain ef fect In ter act io n wit h la nd a rea (1) (2) (3) (4) (5) N ei ghbors ' R ef orms N one conomi c damage s c ap -0. 232* -0. 229* -0. 221* -0. 209* -0. 291* -0. 659** 0. 082* (0. 117) (0. 110) (0. 106) (0. 105) (0. 132) (0. 240) (0. 040) Total damage s c ap -0. 525 -0. 568 -0. 52 -0. 900 -0. 916 -0. 839 0. 104 (0. 535) (0. 492) (0. 502) (0. 481) (0. 676) (3. 430) (0. 236) Pu nit iv e d am ag es ca p 0. 068 0. 064 0. 051 0. 046 0. 026 0. 254 -0. 061 (0. 122) (0. 119) (0. 124) (0. 120) (0. 192) (0. 256) (0. 049) Jo in t a nd s ev er al lia bilit y 0. 155 0. 179 0. 168 0. 159 0. 275 0. 545 -0. 062 (0. 135) (0. 127) (0. 117) (0. 120) (0. 176) (0. 308) (0. 059) Col late ral s ourc e -0. 137 -0. 116 -0. 089 -0. 131 -0. 037 -0. 604 0. 114 (0. 128) (0. 126) (0. 126) (0. 128) (0. 197) (0. 351) (0. 061) Own R ef orms N one conomi c damage s c ap -0. 174* (0. 076) Total damage s c ap 0. 278** (0.080) Pu nit iv e d am ag es ca p -0. 150 (0. 087) Jo in t a nd s ev er al lia bilit y -0. 150 (0. 112) Col late ral s ourc e -0. 027 (0. 051) Ph ys icia n s pecia lty co nt ro ls x x x x Lo g o f ex pen dit ur es o n p hy sicia ns x x x A dj . R -s qu ar ed 0. 931 0. 932 0. 933 0. 936 0. 935 Obs erv ati ons 624 624 624 624 432 D ep en den t v ar ia ble is n at ur al lo g o f p aid cla im s f or ev en ts co m itt ed d ur in g t he y ea r ( res olv ed a t a la ter d at e) d iv id ed b y n um ber o f doc tors . D ata f rom 1990 to 2002. L and are a i n 10, 000s of s quare mi le s. Standard e rrors c lus te re d by s tate . * p<. 05, ** p<. 01. 0. 935 624 x x (6)
A
Identification: Own vs. Neighbors’ Reforms
For ease of exposition, I assume that the analysis happens at the state level and that controls for demographics, state fixed effects, year fixed effects have been partialed out of the data. Equation (3) describes the empirical relationship between a state’s supply of physicians (per capita), the state’s medical malpractice reform (suppose for simplicity that there is only one possible reform), the neighboring states’ reforms (again, there is a single reform a neighboring state can have), and an error term.
docsst =ownrefstα+neighrefstβ+εst (3)
wheredocsst is the per-capita number of doctors in states in yeart,ownrefst is an indicator
for whether a state has the medical malpractice reform in place, neighrefst indicates what
fraction of the state’s neighboring states have the medical malpractice reform in place, and εst is an error term. Suppose now that the supply of physicians in a state is affected both
by the malpractice pressure in the state as well as the pressure in the neighboring states. In other words,
εst =opressstγ1+npressstγ2+ηst (4)
where opressst is malpractice pressure in state s, npressst is malpractice pressure in the
neighboring state, andηstis an error term. Note thatγ1 <0 because having more malpractice
pressure will reduce the per-capita number of doctors in the state. On the other hand, γ2 is likely to be positive because physicians from a neighboring state might move away
from the neighboring state when npress is high. If some fraction of those doctors move to state s, then γ2 will tend to be positive. It is likely that Cov(ownref, opress) > 0 and
Cov(ownref, opress) > Cov(ownref, npress), that a state’s likelihood of having a reform is more closely related to malpractice pressure in the state than malpractice pressure in neighboring states.