1
The Analysis of Student Performance using Data Mining
Leo Willyanto Santoso, YuliaPetra Christian University, Surabaya, Indonesia [email protected]
Abstract. This paper presents the study of data mining in the education industry to model the performance for students enrolled in university. Two algorithms of data mining were used. Firstly, a descriptive task based on the K-means algorithm was utilized to select several student clusters. Secondly, a classification task supported two classification techniques, known as Decision Tree and Naïve Bayes, to predict the dropout because of poor performance in a student's first four semesters. The student academic data collected during the admission process of those students were used to train and test the models, which were assessed using a cross-validation technique. Experimental results show that the prediction of drop out student is improved, student performance is monitored when the data from the previous academic enrollment are added.
Keywords: Data mining, education, drop out, student performance
1
Introduction
Data mining represents a significant computational advance in obtaining information from hidden relationships between variables. This discipline aims to extract useful knowledge from a high volume of data in which initially this knowledge is unknown, but when applying mining techniques, these relationships are discovered. The application of the technologies and tools of data mining in various educational contexts is known as Educational Data Mining (EDM) or data mining in education [1].
The contributions of data mining in education have been used to increase understanding of the educational process, with the main objective of providing teachers and researchers with recommendations for the improvement of the teaching-learning process. By implementing data mining applications in education, teachers and administrators could organize educational resources in a more efficient way.
The objective of the EDM is to apply data mining to traditional teaching systems – in particular to learning content management systems and intelligent web-based education systems. Each of these systems has different data sources for knowledge discovery. After the pre-processing of the data in each of these systems, the different techniques of data mining are applied: statistics and visualization, grouping and classification, association rules and data mining.
The amount of academic information stored in the databases of educational institutions is very useful in the teaching and learning process; that is why nowadays there has been significant research interest in the analysis of the academic information. This research focus to apply data mining techniques to the academic records of the students that entered the academic periods between July 2010 and June 2014 through the construction of a mining model of descriptive data, which allows to create the different profiles of the admitted students with socioeconomic information. For the development of the research, the CRISP-DM methodology was used to structure the lifecycle of a data mining project in six phases, described in four levels, which interact with each other during the development of the research [2].
2
This paper is organized as follows: Chapter 1 contains the background of the research and a review of the state of the art of data mining and the use of its techniques in the educational industry sector. In Chapter 2, the understanding of the data is made; in order to perform a preliminary exploration of the data. The preparation of these covers all the activities necessary for the construction of the final dataset, the selection of tables, records, and attributes. Chapters 3 focuses on the design and evaluation of a descriptive and classification model. Finally, in Chapter 4, the conclusions and future work are presented.
2
Literature Review
Data mining is widely used in many interdisciplinary fields [3], including in the education sector. There have been many research in data mining for education. Araque, Roldan and Salguero [4] conducted a study on the factors that affect the university dropout by developing a prediction model. This model could measure the risk of abandonment of a student with socioeconomic information and academic records, through the technique of decision tree and logistic regression, to quantify students at high risk of dropping out.
Kotsiantis, Pierrakeas and Pintelas [5] present the study of a learning algorithm for the prediction of student desertion – i.e., when a student abandons studies. The background of their research is the large number of students who do not complete the course in universities that offer distance education. A large number of testing were carried out with the academic data, the algorithms of decision tree, neural network, Naive Bayes, logistic regression and support vector machines were compared to know the performance of the proposed system. The analysis of the results showed that the Naive Bayes algorithm is the most appropriate to predict the performance of students in a distance education system.
Kuna, García and Villatoro [6], in their work "The discovery of knowledge obtained through the process of Induction of decision trees," used decision trees to model classifications of the data. One of the main results obtained was the characterization of students at high risk of abandoning their university studies.
Kovacic [7] studied socioeconomic variables such as age, gender, ethnicity, disability, employment status and the distance study program. The objective of the research was to identify students at high risk of dropping out of school. Data mining techniques, decision trees and logistic regression were used in this research.
Yadav, Bharadwaj and Pal [8] presented a data mining project to generate predictive models and identify students at high risk of dropping out taking into account student records at the first enrollment. The quality of the prediction models was examined with the algorithms ID3, C4.5 and ADT of the decision tree techniques. ADT machine learning algorithms can learn from predictive models with student data from previous years. With the same technique, Quadril and Kalyankar [9] presented the study of data mining to construct and evaluate a predictive model to determine the probability of desertion of a particular student; they used the decision tree technique to classify the students with the application of the algorithm C4.5.
Zhang and Oussena [10] proposed the construction of a mining course management system based on data mining. Once the data was processed in the system, the authors identified the characteristics of students who did not succeed in the semester. In this research, support vector machine, Naive Bayes and decision tree were used. The highest precision in the classification was presented with the Naive Bayes algorithm, while the decision tree obtained one of the lowest values.
The evaluation of the important attributes that may affect student performance could improve the quality of the higher education system [11, 12, 13]. Radaideh, Al-Sahwakf and Al-Najjar [14] presented a classification model by implementing ID3 and C4.5 algorithms of the decision tree techniques and the Naive Bayes. The classification for the three algorithms is not very high, to generate a high quality classification model it
3 is necessary to add enough attributes. In the same study, Yudkselturk, Ozekes and Kilic [15] examined the prediction of dropout in online academic programs, in order to classify students who dropped out, three mining techniques were applied: decision tree, Naive Bayes and Neural network. These algorithms were trained and evaluated using a cross-validation technique. On the other hand, Pal [16] presented a data mining application to generate predictive models taking into account the records of the students of the first period. The decision tree is used for validation and training to find the best classifier to predict students who dropped out.
Bhise, Thorat and Supekar [17] studied the evaluation factors of students to improve performance, using grouping technique through the analysis of the K-Means algorithm, to characterize the student population. Moreover, Erdogan and Timor [18] presented the relationship of university students between the entrance exams and the results of success. The study was carried out using algorithm techniques of group analysis and K-Means. Bhardwaj and Bhardwaj [19] presented the application of data mining in the environment of engineering education, the relationship between the university and the results obtained by students, through the analysis of K-algorithm techniques.
3
Data Analysis and Modeling
This chapter focuses on the understanding of the data where visualization techniques are applied, such as histograms, in order to perform a preliminary exploration of the records and verify the quality of the data. Once the analysis is done, we proceed with the data preparation phase, which includes the tasks of selecting the data to which the modeling techniques will be applied for their respective analysis.
The first task is collecting the initial data. The objective of this task is to obtain the data sources of the academic information system of the University. The first set of data grouped the socioeconomic information and the result of the admission tests (Language, English, Mathematics and Logic). The second set of data is made up of the academic and grading history obtained by the students: the academic year and period of the student's admission; the program in which he/she is enrolled; the student's academic situation (academic blocking due to low academic performance and no academic blocking); and number of academic credits registered, approved, lost, canceled and failed. The generated queries were made through the PostgreSQL database management system. A process of concatenation of the two data sets was performed, obtaining a flat file with 55 attributes and 1665 records of students admitted and enrolled in the systems and electronics engineering programs.
The next task is data exploration. Exploratory analysis is a task that allows detailed analysis of some variables and identifying characteristics; for this, some of the visualization tools such as tables and graphs were used, with the purpose of describing the data mining objectives of the comprehension phase.
The task of checking the quality of the data specifies a revision of the same as the lost or those that have missing values committed by coding errors. In this section, the quality of the data corresponding to the socioeconomic information of the admitted student is verified.
The next task is data selection. In this task, the process of selecting the relevant data for the development of the data mining objectives is carried out. A first pre-processing, for the final selection of the data, is the selection of attributes. It was obtained that there are 55 attributes or variables that contain values that may or may not contribute to the study; this is based on the exploration initial of the data and in the description of the fields defined in the variable dictionary. In the dataset selected for the modeling, no errors were found in the fields; differences in the selected records, the errors that were presented in some cases were missing, due to the fact that the processing was not adequate at the time of the typing such as email, residence address, telephone number, date of birth, type of blood, and ethnicity that are attributes considered not relevant to the case under study.
4
for analysis and data mining; this program allows the development of data analysis processes through the linking of operators through a graphic environment. For the implementation of the algorithm, the KMeans operator of the grouping and segmentation library using the Euclidean distance was used to evaluate the quality of the groups found. The algorithm is responsible for both numerical and categorical values. However, additional pre-processing was performed to normalize all the numerical attributes between 0 and 1 with the normalize operator. All attributes must have the same scale for a fair comparison between them.
A grouping model was applied to the dataset for the characterization of the admitted students, create the different profiles of the students in the different groups found and determine what other factors define the separation of groups produced by the K-Means algorithm.
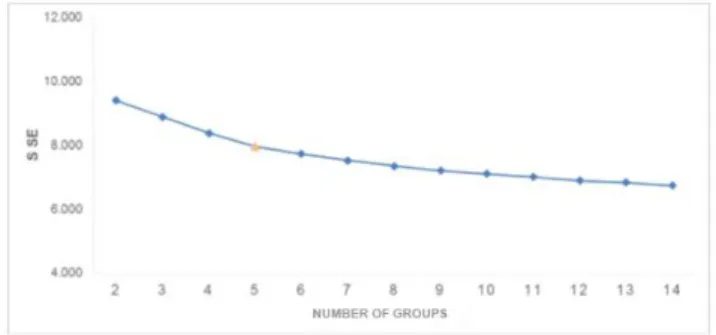
Repeated interaction was performed to determine the value of K or the number of groups. The value of K varied from 2 to 14. The results were evaluated based on the quadratic error of each iteration; for the selection of the group number, the elbow method was used.
Fig. 1. Selection of the Group number (K) for students admitted
Figure 1 shows the iterations performed to find the value of k in the first dataset of the admitted students, the k with value of 5 was selected, where the SSE is equal to 7,954. The K-Means algorithm produced a model with five groups, from the description of these groups is expected to characterize the profiles of admitted students. Table 1 shows the distribution of the number of records and the percentage of each of the resulting groups. Group 2 and 4 group the largest number of records, on the contrary, the lowest percentage of records are in group 1.
Table 1. Distribution of the registration number in the application of the K-Means algorithm
Group 0 Group 1 Group 2 Group 3 Group 4
The Number of
Record
317 130 418 389 409
Percentage 19% 8% 25% 23% 25%
The model was necessary to “de-normalize” it, to put each one of the values of the variables in their original ranges. The analysis of the model was made with the socioeconomic information and the results of the admission tests; then, an analysis was made about the academic situation of the students who in each group had academic block with four enrollments.
Table 2 shows the distribution of the number of records in each of the groups in the first four semesters or academic enrollments. Groups 2 and 3 are characterized by grouping the largest number of records with 28% in each group. In group 0, on the other hand, there is the smallest number of records with 6%. 47% of the registers are students of the first semester, 21% present second enrollment, 19% with third enrollment and 13% of the remaining registers have four academic enrollments.
5 Table 2. Distribution of the number of students with four enrollments
No of Groups Enrollment 1 Enrollment 2 Enrollment 3 Enrollment 4 Total
Group 0 32 13 11 10 66 Group 1 127 63 47 29 266 Group 2 178 58 72 23 331 Group 3 160 90 48 41 339 Group 4 66 32 45 52 195 Number of Records 563 256 223 155 1197 Percentage 47% 21% 19% 13% 100%
Table 3. Distribution of the number of students with four enrollments
No. of groups
Enrollment 1 Enrollment 2 Enrollment 3 Enrollment 4
No Block Block Acad. No Block Block Acad. No Block Block Acad. No Block Block Acad. Group 0 23 26 18 2 14 3 15 0 Group 1 17 30 13 11 15 2 9 2 Group 2 43 11 15 3 22 0 7 0 Group 3 22 26 21 6 14 0 11 1 Group 4 16 17 12 5 23 0 26 1
Table 3 shows in each group the academic status of the students in the first four enrollments. Group 1 is characterized by grouping the highest percentage of students with academic block, in contrast to group 2 where you can see the lowest percentage of students with academic block. The group 0 is characterized by good performance in the admission tests, grouped 26% of students with blocking in the first enrollment, 2% in the second and 3% in the third enrollment. Group 1 groups the students with the lowest performance of the admission tests similar to group 2. 30% of the students present blocking in the first enrollment, 11% in the second and 2% are in the third and fourth enrollment.
Group 2 is characterized by grouping the students with the lowest performance of the admission tests and the least number of students with blocks. 11% of the students have a block in the first enrollment and 3% in the second enrollment. Group 3 is characterized by grouping the students with good performance in the admission tests similar to group 0.26% of students present blockage in the first enrollment, 6% with two and 1% with four enrollments. Finally, group 4 is characterized by grouping the smallest number of students with blocks. 17% of students with a registration have a block, 5% correspond to students with two enrollments and 1% with four enrollments.
4
Result and Analysis
In this section, two models of data mining to analyze the academic and non-academic data of the students are presented. The models used two classification techniques, decision tree and Naïve Bayes, in order to predict the loss of academic status due to low academic performance in their study. The historical academic records and the data collected during the admission process were used to train the models, which were evaluated using cross-validation.
Table 4. Registration number and academic blocks per academic period
Academic Condition Academic Period 2010-1 2010-2 2011-1 2011-2 2012-1 2012-2 2013-1 2013-2 2014-1 2014-2 No Block 115 145 137 119 100 146 131 151 110 166 Acad. Block 70 32 49 30 31 22 25 35 27 23 Total Record 185 177 186 149 131 168 156 186 137 189
6
Table 4 presents the total number of registrations or students with first enrollment or enrollment and number of students with academic block due to underperformance. Table 5 shows the number of students with academic block in each period or enrollment. The largest number of students with academic block is presented in the first enrollment. The second, third and fourth enrollment shows a decrease in the number of students with blocks. In the 2010-01 entry period, the highest number of students with academic blocks was presented in each academic enrollment.
Table 5. Academic block by entry period or first enrollment
Income Period Academic Block 2010-1 2010-2 2011-1 2011-2 2012-1 2012-2 2013-1 2013-2 2014-1 2014-2 2010-1 40 15 7 5 0 1 2 0 0 0 2010-2 28 0 0 3 0 0 0 0 0 2011-1 39 6 2 2 0 0 0 0 2011-2 22 8 0 0 0 0 0 2012-1 20 11 0 0 0 0 2012-2 14 8 0 0 0 2013-1 15 10 0 0 2013-2 28 7 0 2014-1 26 1 2014-2 23
The classification model proposed in this research uses the socioeconomic information. The classification model uses two widely used techniques, decision trees and a Bayesian classifier. The reason for selecting these algorithms is their great simplicity and interpretability.
The decision tree is the first technique used to classify the data; this algorithm generates a recursive decision tree when considering the criterion of the highest proportion of information gain – that is, it chooses the attribute that best classifies the data. It is a technique where an instance is classified following the path of conditions, from the root to a leaf, which will correspond to a labeled class. A decision tree can easily be converted into a set of classification rules. The most representative algorithm is C4.5, which handles both categorical and continuous attributes. It generates a decision tree recursively when considering the criterion of the highest proportion of information gain. The root node will be the attribute whose gain is maximum. Algorithm C4.5 uses pessimistic pruning to eliminate unnecessary branches in the decision tree and to improve classification accuracy.
The second technique to be considered for the construction of the model is a Bayesian classifier. It is one of the most effective classification models. Bayesian classifiers are based on Bayesian networks; these are models probabilistic graphs that allow modeling in a simple and precise way the underlying probability distribution to a data set. Bayesian networks are graphic representations of dependency and independence relationships between the variables present in the data set that facilitate the understanding and interpretability of the model. Numerous algorithms have been proposed to estimate these probabilities. Naive Bayes is one of the practical learning algorithms most used for its simplicity, resistance to noise, short time for processing and high predictive power.
Different models were trained and tested to predict if a student will be blocked in a particular enrollment. The first model analyzed the loss of academic status based on socioeconomic information and the results of the tests collected during the admission process. The second model was analyzed with the initial information of the enrollment process and the academic records of the first four registrations. Table 6 describes the number of registrations in the first four enrollments with academic status (No Block
7 and Academic Block).
Table 6. Academic situation in the first four enrollments
Academic Situation Enrollment 1 Enrollment 2 Enrollment 3 Enrollment 4
No Block 309 190 214 145
Acad. Block 255 66 9 10
Total Record 564 256 223 155
For the design of the model, the RapidMiner application was used; this is a program for automatic learning and data mining process, through a modular concept, which allows the design of learning models using chain operators for various problems. For the validation of the classification model Stratified Sampling stratified sampling technique was used. The operator to partition the data set called split data; this operator creates partition to the dataset in subsets according to the defined size and the selected technique. For the implementation of the decision tree algorithm, the Decision Tree operator and the Bayesian algorithm Naive Bayes were used. Table 7 shows the number of records in the first four enrollment, 80% of the records were taken as training set and 10-fold cross-validation and 20% of the sample was used as a test set.
Table 7. Test, Training and Validation dataset
Number of Enrollment
Total Record
Training and Validation Data 80% Test Data 20%
No Block Acad. Block No Block Acad. Block
Enrollment 1 564 247 204 62 51
Enrollment 1 256 152 53 38 13
Enrollment 1 223 171 7 43 2
Enrollment 1 155 116 8 29 2
To estimate the performance of the model, the X-Validation operator was used. This operator allows to define the process of cross-validation with 10-fold on the input data set to evaluate the learning algorithm. The performance of the model was measured with the operator Performance Binomial Classification. This operator presents the performance results of the algorithm in terms of accuracy, precision, recall, error and ROC curve. To analyze the errors generated from a classification model, the confusion matrix is used. It is a visualization tool that is used in supervised learning. Each column of the matrix represents the number of predictions of each class, while each row represents the instances in the real class.
The following measurements are calculated during the experiment: accuracy, classification error, exhaustiveness (Recall), Precision, f_measure, Specificity, Sensitivity, False Negative rate, False Positive Rate and Area under the Curve (AUC). In this stage, different models were trained and tested to classify students with academic block in the first four academic enrollments; using the socio-economic information. For the configuration of the experiments, we used cross-validation with 10-fold to train the models and the evaluation of the model we used the test dataset. The performance of the model was evaluated with 80% of the training and validation data, 20% of the sample was used as a test set. In the decision tree technique with training and validation data, the tree depth was varied from 1 to 20; the lowest classification error was found in depth 3, where the error begins to show some stability in each of the four academic periods. Finally, the training and validation models were evaluated with the test dataset. Table 8 presents the results of the pre-condition model of the loss of the academic condition with training and validation data, comparing the different classification techniques in terms of the different performance parameters.
8
Prediction Decision Tree Naïve Bayes
Enrollment 2 Enrollment 3 Enrollment 4 Enrollment 2 Enrollment 3 Enrollment 4 Measure-F 0 0 30.77% 0 53.41% 38.51% Precision 0 0 33.33% 0.00% 56.27% 44.17% Exhaustive 0.00% 0.00% 28.57% 0.00% 51.45% 36.00% Accuracy 54.76% 74.14% 94.93% 92.76% 59.43% 69.81% Error 45.24% 25.86% 5.07% 7.24% 40.57% 30.19% Curve (AUC) 0.5 0.5 0 0 0.608 0.63 Kappa 0.0 0.0 0.282 -0.015 0.177 0.19 Specificity 100% 100% 97.61% 99.23% 66.02% 81.65% Sensitivity 0.00% 0.00% 28.57% 0.00% 51.45% 36.00% False Positive 0% 0% 2% 1% 19% 14% False Negative 45% 26% 3% 6% 22% 17%
Analyzing the results of the training and validation dataset with the admission information of the admission process, it is observed how the Bayesian classifier presents the best accuracy of academic block records that were correctly classified. In the third, enrollment increased by 7% with respect to the decision tree. Similarly, after by reviewing the area under the curve (AUC), the decision tree in the first and second enrollment shows a poor performance below 0.5. The Naive Bayes algorithm presents the highest percentage of cases with no academic blockade that were classified incorrectly with academic block. The decision tree presents the highest proportion of class with academic block that were classified incorrectly with no academic block. Table 9 presents the results of the model of the pre-condition of the loss of the academic condition with the admission information of the admission process and the academic record of the previous semester with the data of training and validation, the different classification techniques are compared in terms of different performance parameters. Table 9. Prediction model of the loss of the academic condition using the Training and Validation data
Prediction Decision Tree Naïve Bayes
Enrollment 2 Enrollment 3 Enrollment 4 Enrollment 2 Enrollment 3 Enrollment 4 Measure-F 74.42% 0 11.11% 71.00% 41.67% 40.00% Precision 66.40% 0.00 10.00% 60.75% 29.41% 33.33% Exhaustive 86.67% 0.00% 12.50% 87.00% 71.43% 50.00% Accuracy 84.45% 94.31% 87.05% 81.02% 92.06% 90.19% Error 15.55% 5.69% 12.95% 18.98% 25.86% 9.81% Curve (AUC) 0.851 0 0 0.912 0 0 Kappa 0.637 -0.224 0.042 0.578 0.295 0.350 Specificity 83.58% 98.20% 92.12% 78.90% 92.93% 92.94% Sensitivity 86.67% 0.00% 12.50% 87.00% 71.43% 50.00% False Positive 13% 2% 7% 16% 7% 6% False Negative 1% 4% 6% 3% 1% 3%
Analyzing the results of the training and validation dataset, we observe how the decision tree increased its level of accuracy in the second and fourth enrollment. The Bayesian classifier increased the accuracy of records with academic blocks that were correctly classified. Similarly, by reviewing the area under the curve (AUC), both algorithms in the second enrollment have a good performance above 0.7.
Table 10 presents the results of the model of pre-condition of the loss of the academic condition with the admission information of the admission process and the academic record of the previous semester with the test data; the different classification techniques are compared in terms of performance parameters.
9 Table 10. Prediction model of the loss of academic condition using the test data
Prediction Decision Tree Naïve Bayes
Enrollment 2 Enrollment 3 Enrollment 4 Enrollment 2 Enrollment 3 Enrollment 4 Measure-F 74.29% 0 0 70.27% 0% 0% Precision 59.09% 0.00% 0.00% 54.17% 0.00% 0.00% Exhaustive 100% 0.00% 0.00% 100% 0.00% 0.00% Accuracy 17.65% 4.44% 6.45% 21.57% 6.67% 9.68% Error 82.35% 95.56% 93.55% 78.43% 93.33% 90.32% Curve (AUC) 0.882 0.500 0.534 0.913 0.907 0.828 Kappa 0.622 0.00 0.000 0.556 -0.031 -0.045 Specificity 76.32% 100% 100% 71.05% 97.67% 96.55% Sensitivity 100% 0.00% 0.00% 100% 0.00% 0.00% False Positive 18% 0% 0% 22% 2% 6% False Negative 0% 4% 6% 0% 4% 3%
Analyzing the results of the test dataset, we observe how the decision tree presents the highest number of predictions with academic blocking that were correctly classified in the second enrollment. Likewise, by reviewing the area under the curve (AUC), the Naive Bayes algorithm presents a good performance with an area greater than 0.9 in comparison to with the algorithm of the decision tree.
5
Conclusion
In recent years, there has been great interest in data analysis in educational institutions, in which high volumes of data are generated, given the new techniques and tools that allow an understanding of the data. For this research, a set of data was compiled from the database of the ‘X’ University with socioeconomic information and the academic record of the previous enrollment, for the training and validation of the descriptive and predictive models.
The objective of the application of the K-Means algorithm of the descriptive model was to analyze the student population of the university to identify similar characteristics among the groups. It was interesting to establish that some initial socio-economic characteristics allowed to define some profiles or groups. In the evaluation of the model, it was observed that the student's socioeconomic information affects the results of their academic performance, showing that the groups with the highest academic performance in the knowledge test results were found in the schools with low socioeconomic status. The classification model presented in this paper analyzed the socioeconomic information and the academic record of the student’s previous enrollment. The decision tree algorithm with the test data presented a better performance with the addition of the academic record of the previous semester compared to the Naive Bayes algorithm. The analysis of the data could show that there are different types of performance according to the student's socioeconomic profile and academic record, demonstrating that it is feasible to make predictions and that this research can be a very useful tool for decision making.
This research can be used for decision making, by the permanency and graduation program of the University and can be used as a starting point for future data mining research in education. Another important recommendation is that to improve the performance of the model, other sources of data should be integrated, such as the information of the student who is registered as a senior in high school in the Senior High School, before entering the university.
References
1. Romero, C., Ventura, S.: Educational Data Mining: A Survey from 1995 to 2005. Expert Systems with Applications, 33(1), 135-146 (2007).
2. Chapman, P.: CRISP-DM 1.0: Step-by-step Data Mining Guide, New York: SPSS (2000). 3. Khamis, A., Xu, Y., Mohamed, A.: Comparative Study in Determining Features Extraction
10
Analysis. Int. Journal of Electrical and Computer Engineering (IJECE), 7(3), 1112-1134, June 2017.
4. Arague, F., Roldan, C., Salguero, A.: Factors Influencing University Drop-Out Rates. Computers & Education, 53(3), 563-574 (2009).
5. Kotsiantis, S., Pierrakeas, C., Pintelas, P.: Preventing Student Dropout in Distance Learning Systems using Machine Learning Techniques, Proceedings of the 7th Int. Conf. Knowledge-Based Intelligent Information and Eng. System (KES), Oxford, pp. 267-274 (2003). 6. Kuna, H., Garcia-Martinez, R., Villatoro, F.: Pattern Discovery in University Students
Desertion Based on Data Mining, Proceedings of the IV Meeting on Dynamics of Social and Economic Systems, Buenos Aires, pp. 275-285 (2009).
7. Kovacic, Z.: Predicting Student Success by Mining Enrolment Data. Research in Higher Education Journal, 15, 1-20 (2012).
8. Yadav, S., Bharadwaj, B., Pal, S.: Mining Educational Data to Predict Student’s Retention: A Comparative Study. Int. Journal of Computer Science and Information Security (IJCSIS), 10(2), 113-117 (2012).
9. Quadril, M., Kalyankar, N.: Drop Out Feature of Student Data for Academic Performance using Decision Tree Techniques. Global Journal of Computer Science and Technology, 10(2), 2-5 (2010).
10. Zhang, Y., Oussena, S., Clark, T., Kim, H.: Use Data Mining to Improve Student Retention in Higher Education – a Case Study, Proceedings of the 12th Int. Conf. On Enterprise Information Systems, pp. 190-197 (2010).
11. Santoso, L., Yulia,: Predicting Student Performance using Data Mining, Proceedings of the 5th Int Conf. on Communication and Computer Engineering (ICOCOE) (2018)
12. Rao, M., Gurram, D., Vadde, S., Tallam, S., Chand, N., Kiran, L.: A Predictive Model for Mining Opinions of an Educational Database using Neural Networks, Int. Journal of Electrical and Computer Engineering (IJECE), 5(5), 1158-1163, October 2015
13. Santoso, L., Yulia,: Data warehouse with Big Data Technology for Higher Education, Procedia Computer Science, 124(1), 93-99 (2017).
14. Al-Radaideh, Q., Al-Shawakfa, E., Al-Najjar, M.: Mining Student Data using Decision Trees, Proceedings of the 2006 Int. Conf. On Information Technology (ACIT), pp. 1-5 (2006).
15. Yudkselturk, E., Ozekes, S., Turel, Y.: Predicting Dropout Student: An Application of Data mining Methods in an Online Education Program. European Journal of Open, Distance and E-Learning, 17(1), 118-133 (2014).
16. Pal, S.: Mining Educational Data to Reduce Dropout rates of Engineering Students. Int. Journal of Information Engineering and Electronic Business, 4(2), 1-7 (2012).
17. Bhise, R., Thorat, S., Superkar, A.: Importance of Data Mining in Higher Education System. IOSR Journal of Humanities and Social Science, 6(6), 18-21 (2013).
18. Erdogan, S., Timor, M.: A Data Mining Application in a Student Database. Journal of Aeronautics and Space Technologies, 2(2), 53-57 (2005).
19. Bhardwaj, A., Bhardwadj, A.: Modified K-Means Clustering Algorithm for data Mining in Education Domain. Int. Journal of Advanced Research in Computer Science and Software Engineering, 3(11), 1283-1286 (2013).