Wageningen University - Department of Social Sciences
MSc Thesis Development Economics
A Socio-Economic Impact Study of the DE Foundation
Coffee Project Peru
November, 2008:
MSc programme
Name of student
International Development Studies
Fédes van Rijn
Specialisation
Name of Supervisors
Economics of Rural Development
dr. Kees Burger, DEC
dr.ir. Eefje den Belder, PRI
Thesis code: 80430
ii
I.
Acknowledgements
Having the privilege of living in a prosperous country such as the Netherlands, getting the opportunity to develop my knowledge through good education and being able to travel the world, are not issues which I take for granted. Instead I hope to use my knowledge and my opportunities to contribute to the lives of those for which they are not so common. This thesis is one of the ways in which I hope to achieve this.
However, the thesis would not have been as it is without the support and dedication of a number of people and organizations. First of all, the DE Foundation of Sara Lee, who made the research possible by providing financial resources. I would also like to thank my two supervisors, Eefje den Belder for providing me with this opportunity and her trust in me and in the research and Kees Burger for his structured and prompt feedback and patience. I would also like to thank Don Jansen for involving me in the project and for his clear-cut feedback. Finally, I thank Bineke, Alina, Sabina and my parents for their insights and for keeping me going in hard times.
During my stay in Peru I also met many people who contributed to the thesis as it is now. First of all, the project team; Martin for his wisdom, patience and good conversations, Giovanni for all her practical help and Alex for joining and supporting us in the field. Furthermore, I would like to thank the staff of the cooperative for their insights and for keeping us going in the office with the most delicious freshly brewed coffee. I would also like to thank the interviewers, of course for their good work, but also for making the fieldwork a really fun experience. Lastly, I want to thank the coffee producers for their time, the interesting conversations and their enormous hospitality.
And finally I would like to thank my (research) partner Joren Ellenbroek without whom I would not have been able to collect the data upon which this thesis is based. I would like to thank him for all his insights, feedback, confidence and support from the very beginning until the very end.
II.
Summary
As a consequence of several developments in the coffee market, the coffee price has decreased significantly in the last decades. Combined with the overall poor economic and institutional environment of coffee farmers in developing countries, this has resulted in a decrease in the social, economic and environmental sustainability of the livelihoods of small scale coffee farmers in many parts of the world. Within this context, and within the context of Corporate Social Responsibility of large multinationals in the coffee sector, a support project was initiated in the Ubiriki valley of Peru in March 2003, sponsored by Sara Lee and managed by the DE Foundation through Plant Research International Wageningen. The broad scope of the project already becomes apparent of the activities analysed in this study, being the Farmer Field Schools in which farmers receive capacity building, the establishment of a producer cooperative and the certification of coffee.
The purpose of this study is to contribute to the understanding of the role of these types of projects in poverty alleviation by performing a quantitative impact study of the DE Foundation Coffee Project in Peru. The main research question of this study is ‘what has been the socio-economic impact of the DE Foundation Coffee Project on the livelihoods of the households in the Ubiriki valley?
From a review of the literature it becomes clear that increased income is but one of the potential benefits of projects that incorporate both market-related as well as additional aid activities. Other impact areas which have been identified are for example related to production costs, market access, local capacities, access to credit, community development, gender equity, coffee quality and a sense of ownership. The presence and size of the impact is however often indefinite.
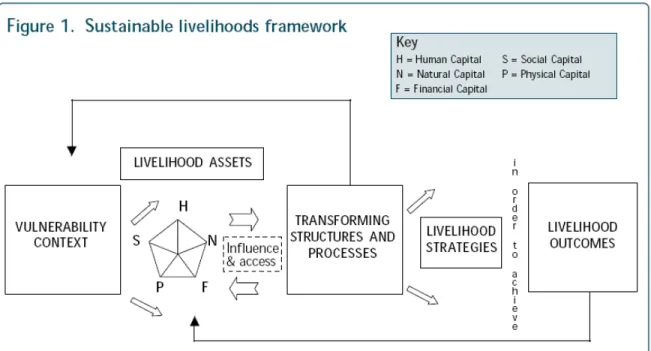
One of the shortcomings of much impact research is that the relation between the project activity and the impact is not always clearly explained. The input-output-outcome-impact framework is a framework which can be used to structure these relations and underscores the need for differentiating between direct and indirect impact. The framework will be combined with the sustainable livelihood framework. The use of this framework makes it possible to highlight the most important socio-economic impacts at household level while explicitly depicting and interpreting these results into the ‘big picture’.
For evaluating the impact of the DE Foundation Coffee Project in Peru, a counterfactual is constructed to estimate what the situation of participating farmers would have been, had they not participated in the project. Several data collection techniques and data analysis methods were used to construct this counterfactual. In the first phase of fieldwork several qualitative data collection techniques were used including he revision of key documents, informal observations and interviews, and focus group discussions. Based on this information the socio-economic indicators were developed and a survey was constructed in order to measure those impacts. The information is also used to support and explain the result of the quantitative analysis and to present them within the analytical frameworks. In the second phase of fieldwork 208 structured surveys were conducted, divided into participating and non-participating farmers. The sampling method was designed in such a way as to minimize the differences between both groups. The remaining difference was solved statistically by applying and partly combining propensity score matching and regression analysis. Combined with a direct comparison of the survey data, the use of both methods provides a convincing series of evidence on the impact of the project.
From the analysis it becomes clear that the project has had a significant socio-economic impact within its five years of existence mainly in relation to an increase in capacity building, membership of producer organizations, a broader and more intensive coffee production process, an increase in production and processing equipment, coffee certifications, self esteem, price and diversification of marketing channels. The socio-economic impact relates to the livelihoods of farmers in many different ways; through different types of assets, through structures that shape the livelihoods of the farmers, the livelihood strategies to achieve certain livelihood outcomes, and the livelihood outcomes themselves. This broad impact corresponds to the broad scope of the project and corresponds to the main social, economic and environmental problems indicated by the farmers at the start the project.
iv
III. Abbreviations
CACSVU Cooperativa Agraria Cafetalera Sostenible de Valle Ubiriki
CSR Corporate Social Responsibility
DFID UK Department of International Development
ICA International Coffee Agreements
ICO International Coffee Organization
ICS Internal Control System
FFS Farmer Field Schools
FLO Fair Trade Labelling Organization
MSC Most Significant Change (study)
PSM Propensity Score Matching
SAN Sustainable Agriculture Network
SI Sustainability Indicator (study)
IV. Table of Contents
I. ACKNOWLEDGEMENTS II
II. SUMMARY III
III. ABBREVIATIONS IV
IV. TABLE OF CONTENTS V
V. TABLE OF FIGURES VII
VI. TABLE OF TABLES VII
1 INTRODUCTION 9
1.1 BACKGROUND 9
1.2 DEFOUNDATION COFFEE PROJECT IN PERU 10
1.3 PROBLEM DEFINITION 10
1.4 RESEARCH OBJECTIVES 11
1.5 RESEARCH FOCUS 11
1.6 RESEARCH QUESTIONS 13
1.7 OUTLINE OF THE THESIS 14
2 LITERATURE REVIEW 15
2.1 THE COFFEE MARKET 15
2.2 CODES OF CONDUCT IN THE COFFEE SECTOR 18
2.2.1 Fair Trade 18
2.2.2 Utz Certified 19
2.2.3 Rain Forest Alliance Certification 20
2.2.4 C.A.F.E Practice 20
2.3 IMPACT OF COMPARABLE PROJECTS 21
2.3.1 Price Impact 21 2.3.2 Costs 22 2.3.3 Market Access 22 2.3.4 Local Capacities 23 2.3.5 Access to Credit 23 2.3.6 Community Development 23 2.3.7 Gender Equity 24 2.3.8 Quality Improvement 24 2.3.9 Ownership 24
2.4 LIMITATIONS OF COMPARABLE PROJECTS 25
2.4.1 Supply and Demand 25
2.4.2 Efficiency 25
2.4.3 Dependence on Fair Trade 25
2.4.4 Inclusion & Exclusion 26
2.4.5 Addressing the Causes of the Problem 26
2.5 CHAPTER CONCLUSION 27
3 ANALYTICAL FRAMEWORK 28
3.1 ‘INPUT-OUTPUT-OUTCOMES-IMPACTS’FRAMEWORK 28
3.2 SUSTAINABLE LIVELIHOOD FRAMEWORK 28
3.3 CHAPTER CONCLUSION 30
4 METHODOLOGY 31
4.1 THE EVALUATION PROBLEM 31
4.2 RESEARCH STRATEGY 31
4.2.1 Case Study Approach 32
4.2.2 Semi-Experimental Approach 32
4.3 DATA COLLECTION TECHNIQUES 32
4.3.1 Overview 32
4.3.2 Literature Research 33
4.3.3 Documentary Analysis 33
4.3.4 Informal Observations and Interviews 34
vi
4.3.6 Focus Group Interviews 34
4.3.7 Survey 34
4.4 DATA ANALYSIS 36
4.4.1 Data Preparation 36
4.4.2 Direct Comparison 37
4.4.3 Propensity Score Matching 38
4.4.4 Regression Analysis 43
4.5 CHAPTER CONCLUSION 45
5 RESULTS 46
5.1 INDICATORS IN THE OUTPUT-OUTCOME-IMPACT FRAMEWORK 46
5.2 OUTPUTS 48
5.2.1 The Project (the treatment) 48
5.3 OUTCOMES 48
5.3.1 Capacity Building 48
5.3.2 Producer Organization Coffee Farmers 51
5.4 IMPACT LEVEL ONE 53
5.4.1 Coffee Production Process 53
5.4.2 Coffee Production and Processing Equipment 59
5.4.3 Certification 64
5.4.4 Changes in Self Esteem 67
5.5 IMPACT LEVEL TWO 69
5.5.1 Coffee Yield 69
5.5.2 Coffee Production Expenditures 72
5.5.3 Coffee Price 74
5.5.4 Coffee Marketing Channels 77
5.6 IMPACT LEVEL THREE 80
5.6.1 Coffee Profit 80
5.7 IMPACT LEVEL FOUR 81
5.7.1 Land cultivation 82
5.7.2 Education 83
5.8 CHAPTER CONCLUSION 85
6 DISCUSSION 88
6.1 IMPACT INDICATORS IN THE SUSTAINABLE LIVELIHOOD FRAMEWORK 88
6.2 VULNERABILITY CONTEXT 89
6.3 LIVELIHOOD ASSETS 89
6.4 TRANSFORMING STRUCTURES AND PROCESSES 91
6.5 LIVELIHOOD STRATEGIES 92
6.6 LIVELIHOOD OUTCOMES 92
6.7 CHAPTER CONCLUSION 93
7 CONCLUSION 95
7.1 THE SOCIO-ECONOMIC IMPACT 95
7.2 RECOMMENDATIONS FOR FURTHER RESEARCH 98
8 REFERENCES 100
9 APPENDICES 104
9.1 OVERVIEW OF COFFEE CERTIFICATIONS 104
9.2 EXAMPLE SEMI-STRUCTURED INTERVIEW 107
9.3 MATRIX SELECTION VILLAGES CONTROL GROUP 108
9.4 SURVEY 110
9.5 EXPLANATORY VARIABLES PSM®RESSION ANALYSIS 140
9.6 TTESTS PROPENSITY SCORE MATCHING VARIABLES 141
V. Table of Figures
FIGURE 1:THE IMPORTANT COFFEE REGIONS OF PERU... 9
FIGURE 2:FOCUS IN THE COFFEE CHAIN... 11
FIGURE 3:OVERVIEW OF THE FARMER FIELD SCHOOLS... 12
FIGURE 4:FOCUS IN THE LOCAL PROJECT CONTEXT... 12
FIGURE 5:GENERAL STRUCTURE OF THE COFFEE MARKETING CHAIN... 16
FIGURE 6:COMPOSITE INDICATOR PRICE 1966–2007... 17
FIGURE 7:TOTAL PRODUCTION COFFEE 1977–2007... 17
FIGURE 8:INPUT-OUTPUT-OUTCOME-IMPACT FRAMEWORK... 28
FIGURE 9: SUSTAINABLE LIVELIHOOD FRAMEWORK... 29
FIGURE 10:OVERVIEW OF DATA COLLECTION TECHNIQUES... 32
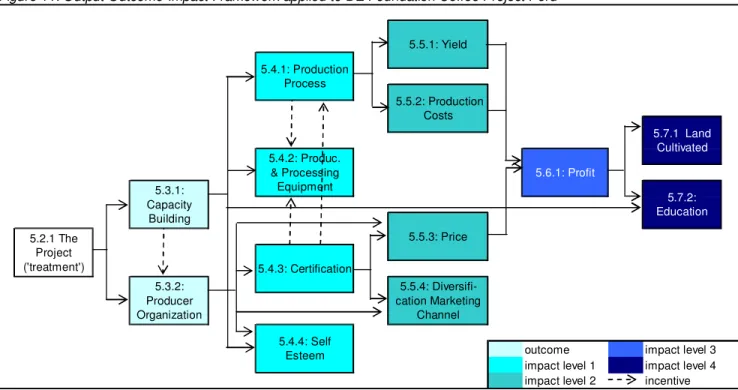
FIGURE 11:OUTPUT-OUTCOME-IMPACT FRAMEWORK APPLIED TO DEFOUNDATION COFFEE PROJECT PERU... 47
FIGURE 12:DESCRIPTIVE DATA OUTCOMES -CAPACITY BUILDING COFFEE... 49
FIGURE 13:DESCRIPTIVE DATA OUTCOMES –PRODUCER ORGANIZATION COFFEE FARMERS... 52
FIGURE 14:DESCRIPTIVE DATA IMPACT LEVEL ONE –PRODUCTION PROCESS COFFEE... 54
FIGURE 15:DESCRIPTIVE DATA IMPACT LEVEL ONE –PRODUCTION AND PROCESSING EQUIPMENT COFFEE... 60
FIGURE 16:DESCRIPTIVE DATA IMPACT LEVEL ONE – CERTIFICATION COFFEE... 65
FIGURE 17:DESCRIPTIVE DATA IMPACT LEVEL ONE –CHANGES IN SELF ESTEEM... 68
FIGURE 18:DESCRIPTIVE DATA IMPACT LEVEL TWO –COFFEE YIELD... 70
FIGURE 19:DESCRIPTIVE DATA IMPACT LEVEL TWO –PRODUCTION EXPENDITURES COFFEE... 72
FIGURE 20:DESCRIPTIVE DATA IMPACT LEVEL TWO –PRICE COFFEE... 75
FIGURE 21:DESCRIPTIVE DATA IMPACT LEVEL TWO –MARKETING CHANNEL COFFEE... 78
FIGURE 22:DESCRIPTIVE DATA IMPACT LEVEL THREE –PROFIT COFFEE... 80
FIGURE 23:DESCRIPTIVE DATA IMPACT LEVEL FOUR –EDUCATION... 84
FIGURE 24:SUSTAINABLE LIVELIHOOD FRAMEWORK APPLIED TO THE DEFOUNDATION COFFEE PROJECT PERU... 88
VI. Table of Tables
TABLE 1:EXAMPLE OF PRESENTATION T-TEST RESULTS 37
TABLE 2:THE PROPENSITY SCORE MODEL 41
TABLE 3:NUMBER OF CATEGORIES IN THE SAMPLE BASED ON PSM 42
TABLE 4:EXAMPLE OF PRESENTATION PROPENSITY SCORE MATCHING RESULTS 42
TABLE 5:EXAMPLE OF REGRESSION ANALYSIS RESULTS 44
TABLE 6:OUTCOME INDICATORS –CAPACITY BUILDING COFFEE 49
TABLE 7:T-TEST OUTCOMES -CAPACITY BUILDING COFFEE 49
TABLE 8:PSMOUTCOMES -CAPACITY BUILDING COFFEE 50
TABLE 9:REGRESSION ANALYSIS OUTCOMES -CAPACITY BUILDING COFFEE 50
TABLE 10:OUTCOME INDICATORS –PRODUCER ORGANIZATION COFFEE FARMERS 51
TABLE 11:T-TEST OUTCOMES –PRODUCER ORGANIZATION COFFEE FARMERS 52
TABLE 12:PSMOUTCOMES –PRODUCER ORGANIZATION COFFEE FARMERS 52
TABLE 13:REGRESSION ANALYSIS –PRODUCER ORGANIZATION COFFEE FARMERS 52
TABLE 14:IMPACT LEVEL ONE INDICATORS –PRODUCTION PROCESS COFFEE 54
TABLE 15:T-TEST IMPACT LEVEL ONE –PRODUCTION PROCESS COFFEE 55
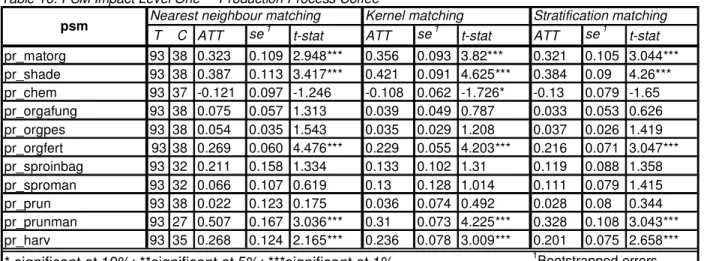
TABLE 16:PSMIMPACT LEVEL ONE –PRODUCTION PROCESS COFFEE 55
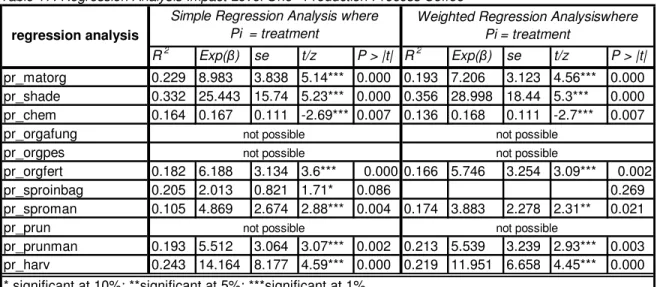
TABLE 17:REGRESSION ANALYSIS IMPACT LEVEL ONE–PRODUCTION PROCESS COFFEE 56
TABLE 18:REGRESSION ANALYSIS (B)IMPACT LEVEL ONE–PRODUCTION PROCESS COFFEE 57
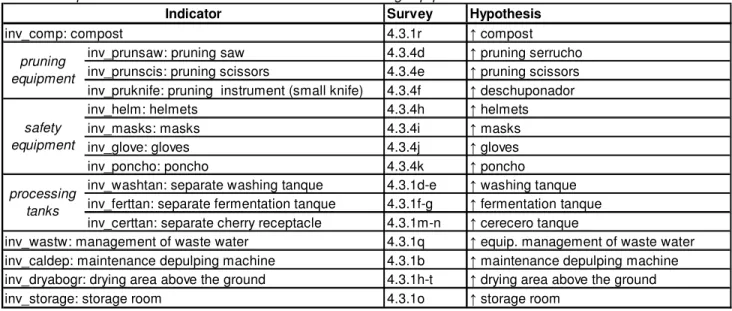
TABLE 19:IMPACT LEVEL ONE INDICATORS –PRODUCTION AND PROCESSING EQUIPMENT COFFEE 59
TABLE 20:T-TEST IMPACT LEVEL ONE –PRODUCTION AND PROCESSING EQUIPMENT COFFEE 60
TABLE 21:PROPENSITY SCORE MATCHING IMPACT LEVEL ONE –PRODUCTION AND PROCESSING EQUIPMENT COFFEE 61
TABLE 22:REGRESSION ANALYSIS IMPACT LEVEL ONE –PRODUCTION AND PROCESSING EQUIPMENT COFFEE 61
TABLE 23:REGRESSION ANALYSIS (B)IMPACT LEVEL ONE –PRODUCTION AND PROCESSING EQUIPMENT COFFEE 62
TABLE 24:IMPACT LEVEL ONE INDICATORS –CERTIFICATION COFFEE 65
TABLE 25:T-TEST IMPACT LEVEL ONE – CERTIFICATION COFFEE 65
TABLE 26:PROPENSITY SCORE MATCHING IMPACT LEVEL ONE –CERTIFICATION COFFEE 66
TABLE 27:REGRESSION ANALYSIS IMPACT LEVEL ONE –CERTIFICATION COFFEE 66
TABLE 28:REGRESSION ANALYSIS IMPACT LEVEL ONE –CERTIFICATION COFFEE 67
TABLE 29:IMPACT LEVEL ONE INDICATORS –CHANGES IN SELF ESTEEM 67
TABLE 30:T-TEST IMPACT LEVEL ONE –CHANGES IN SELF ESTEEM 68
TABLE 31:PSMIMPACT LEVEL ONE –CHANGES IN SELF ESTEEM 68
viii
TABLE 33:REGRESSION ANALYSIS (A)IMPACT LEVEL ONE –CHANGES IN SELF ESTEEM 69
TABLE 34:IMPACT LEVEL TWO INDICATORS –COFFEE YIELD 70
TABLE 35:T-TEST IMPACT LEVEL TWO –COFFEE YIELD 70
TABLE 36:PSMIMPACT LEVEL TWO –COFFEE YIELD 71
TABLE 37:REGRESSION ANALYSIS IMPACT LEVEL TWO –COFFEE YIELD 71
TABLE 38:REGRESSION ANALYSIS (B)IMPACT LEVEL TWO –COFFEE YIELD 71
TABLE 39:REGRESSION ANALYSIS (B)IMPACT LEVEL TWO –COFFEE YIELD 71
TABLE 40:IMPACT LEVEL TWO INDICATORS –PRODUCTION EXPENDITURES COFFEE 72
TABLE 41:T-TEST IMPACT LEVEL TWO –PRODUCTION EXPENDITURES COFFEE 72
TABLE 42:PSMIMPACT LEVEL TWO –PRODUCTION EXPENDITURES COFFEE 73
TABLE 43:REGRESSION ANALYSIS IMPACT LEVEL TWO –PRODUCTION EXPENDITURES COFFEE 73
TABLE 44:REGRESSION ANALYSIS (B)IMPACT LEVEL TWO –PRODUCTION EXPENDITURES COFFEE 73
TABLE 45:IMPACT LEVEL TWO INDICATORS -PRICE COFFEE 74
TABLE 46:T-TEST IMPACT LEVEL TWO 75
TABLE 47:PSMIMPACT LEVEL TWO –PRICE COFFEE 75
TABLE 48:REGRESSION ANALYSIS IMPACT LEVEL TWO –PRICE COFFEE IN SOLES PER KILO 76
TABLE 49:REGRESSION ANALYSIS (B)IMPACT LEVEL TWO –PRICE COFFEE 76
TABLE 50:REGRESSION ANALYSIS (B)IMPACT LEVEL TWO –PRICE COFFEE 76
TABLE 51:REGRESSION ANALYSIS (B)IMPACT LEVEL TWO –PRICE COFFEE 77
TABLE 52: IMPACT LEVEL TWO INDICATORS –MARKETING CHANNEL COFFEE 78
TABLE 53:T-TEST IMPACT LEVEL TWO – 78
TABLE 54:PROPENSITY SCORE MATCHING IMPACT LEVEL TWO – MARKETING CHANNEL COFFEE 78
TABLE 55:REGRESSION ANALYSIS IMPACT LEVEL TWO –MARKETING CHANNEL COFFEE 79
TABLE 56:REGRESSION ANALYSIS (C)IMPACT LEVEL TWO –MARKETING CHANNEL COFFEE 79
TABLE 57:IMPACT LEVEL THREE INDICATORS –PROFIT COFFEE 80
TABLE 58:T-TEST IMPACT LEVEL THREE –PROFIT COFFEE 80
TABLE 59:PSMIMPACT LEVEL THREE –PROFIT COFFEE 80
TABLE 60:REGRESSION ANALYSIS IMPACT LEVEL THREE –PROFIT COFFEE 81
TABLE 61REGRESSION ANALYSIS (B)IMPACT LEVEL THREE –PROFIT COFFEE 81
TABLE 62REGRESSION ANALYSIS (B)IMPACT LEVEL THREE –PROFIT COFFEE 81
TABLE 63:IMPACT LEVEL FOUR INDICATORS –LAND CULTIVATION 82
TABLE 64:DESCRIPTIVE DATA IMPACT LEVEL FOUR –PERCENTAGE LAND CULTIVATED 82
TABLE 65:T-TEST IMPACT LEVEL FOUR –PERCENTAGE LAND CULTIVATED 82
TABLE 66:PSMIMPACT LEVEL FOUR –PERCENTAGE LAND CULTIVATED 82
TABLE 67:REGRESSION ANALYSIS IMPACT LEVEL FOUR –PERCENTAGE LAND CULTIVATED 83
TABLE 68:REGRESSION ANALYSIS (B)IMPACT LEVEL FOUR –PERCENTAGE LAND CULTIVATED 83
TABLE 69:REGRESSION ANALYSIS (B)IMPACT LEVEL FOUR –PERCENTAGE LAND CULTIVATED 83
TABLE 70:IMPACT LEVEL FOUR INDICATORS –EDUCATION 83
TABLE 71:T-TEST IMPACT LEVEL FOUR –EDUCATION 84
TABLE 72:PSMIMPACT LEVEL FOUR –EDUCATION 84
TABLE 73:REGRESSION ANALYSIS IMPACT LEVEL FOUR –EDUCATION 84
TABLE 74:REGRESSION ANALYSIS (B)IMPACT LEVEL FOUR –EDUCATION 85
TABLE 75:REGRESSION ANALYSIS (B)IMPACT LEVEL FOUR –EDUCATION 85
1 Introduction
1.1
Background
Despite the fact that the indicator price of coffee fell by more than 50% between 1997 and 2001 and the price in 2001 was the lowest since 1971, many developing countries, including Peru, have rapidly expanded their coffee production over the last decade. In the year 2007 Peru was one of ten largest exporters of coffee in the world (ICO 2007). In the figure below the most important coffee regions in Peru are indicated
Figure 1: The Important Coffee Regions of Peru
Source: Project Proposal 2002 (Belder 2002)
Approximately 34% of this coffee is produced in the central region, including the department of Junín. One of the coffee producing provinces in this district is Chanchamayo, indicated as the Selva Central in the figure above. Of the approximately 142.000 inhabitants 70% live in rural areas and depend to a large extent on agriculture. Due to climatic conditions the Chanchamayo province is very suitable for coffee production, which was introduced 15 to 20 years ago and about 8% of the population depends on coffee. (den Belder 2002)
In the Ubiriki valley, where the project is located, the importance is even higher, since an estimated 80% of the farmers depend almost entirely on coffee. The Ubiriki valley is one of Peru’s 26 poorest economic regions and Gross Domestic Product (GDP) in this region is about $180 while average GDP of Peru is $300. The base-line study conducted at the start of the project further indicated that the area has a high rate of child malnutrition, lack of healthcare, safe drinking water, sanitary facilities, education and little access to public facilities. (den Belder 2002) These statistics illustrate the overall poor conditions in the region before the start of the project.
At the same time, the data above illustrates the importance of coffee as a source of potential development at household level and for the region in general. However, as a result of low product quality, lack of market knowledge and sub-standard storage and transport facilities, farmers often have to sell their product to low paying local middlemen (den Belder 2002). The situation resulting in low quality coffee and low prices have been worsened by the guerrilla activities until the mid-90s and the plunge in coffee prices at the world market as a result of the coffee crisis in the mid nineties.
10
1.2
DE Foundation Coffee Project in Peru
The problems related to the lack of organization at farm level and the low coffee quality were recognized by Prodelsur, a processing and exporting agency who by the time bought coffee from about 388 families in the Ubiriki valley and exported this to, amongst others, Sara Lee/Douwe Egberts. As a result Prodelsur established La Central, hereby joining six relative new farmer associations in one single cooperative. Besides commercializing coffee, La Central provided some conventional technical assistance with support from Sara Lee, although those activities were considered very limited since only 5% of the farmers participated. (den Belder 2002)
Considering the importance of coffee quality for international roaster such as Sara Lee and within the context of the rising awareness on Corporate Social Responsibility of such roasters, a dialogue between different stakeholders was initiated and resulted in the development of several activities in the Ubiriki valley. The initial paths for improvement identified by the project focused on the need to increase income by reducing costs, increasing yield and the quality of coffee. The main beneficiaries are therefore the coffee producers, with an initial focus on those farmers with less than three hectares of coffee cultivation. Prodelsur could broaden their capacity to identify and improve local production, processing and commercialization processes. Besides this, they could benefit in terms of a better image, as was the case for SaraLee/DE. (den Belder 2002) The activities were bundled in the ‘Peruvian Coffee Producers Quality Support Project’ which was initiated in March 2003, sponsored by Sara Lee and managed by the DE Foundation Coffee Project in Peru through Plant Research International Wageningen1.
Some of the key activities of the project are the development of an extension group; organization of Farmer Field Schools (FFS) as focal points of training and extension; stimulation of farmers to learn from their own experiences through registration of field activities in field books; adaptation of tools for the farmer promoters in charge of assisting the FFS to give better service to farmers; testing of alternative crop management practices; establishment of a cooperative and certifying part of the coffee production. (den Belder 2005) Taking into account the focus of research (see 1.5), the two main activities that will be analysed are the Farmer Field Schools (FFS) and the organization of farmers in the producer cooperative Cooperativa Agraria Cafetalera Sostenible Valle de Ubiriki (CACSVU). In paragraph 5.1, more information on those activities will be given since it provides the answer to the first research question of this study (see 1.6).
1.3
Problem Definition
The problems faced by the farmers in the Ubiriki Valley are similar to the problems faced by coffee farmers worldwide. Different approaches have been implemented in order to improve the living conditions of which the DE Foundation Coffee Project in Peru, characterized by market-related and additional aid activities, is one example. Although this project has its own specific characteristics, it will be argued in the literature review (chapter 2) that it can be compared to Fair Trade projects in many ways. Considering the recent upsurge of fair-trade initiatives2 in general it is important to evaluate the contribution of this approach to poverty alleviation.
There have been several in-dept studies that evaluate the impact of these types of projects using qualitative methods. This growing amount of literature sheds light on the context in which these projects are implemented and the potential role these projects have in the livelihoods of small-scale coffee producers. However, little quantitative research has been performed on the impact of this type of projects, especially not the type of research that uses a group of farmers that did not participate in the project in order to construct a realistic counterfactual, i.e. what would have happened, had the project not been implemented? The lack of such impact studies contributes to the uncertainty on the contribution of fair-trade initiatives to poverty alleviation of coffee producers.
1
The ‘Peruvian Coffee Producers Quality Support Project’ will be referred to as the DE Foundation Coffee Project in Peru or simply the project in the remainder of this thesis.
2
Initiatives incorporating market-related aspects and additional aid activities are referred to as fairtrade initiatives in the remainder of this paper.
1.4
Research Objectives
The research purpose of this study is twofold. On the one hand, based on the problem definition above, this study will contribute to the understanding of the role of fair-trade initiatives in poverty alleviation of small-scale coffee farmers, by performing a quantitative impact analysis of the DE Foundation Coffee Project in Peru. Outcomes of this research can thus contribute to the discussion on potential solutions to the situation of small-scale coffee farmers in developing countries.
On the other hand, it is important to measure the impact of the project to be able to evaluate the effectiveness of its activities in developing the region or in decreasing poverty in general. The conclusions would provide the project with ideas about how to reshape the project in such a way that successes are strengthened, limited positive impacts are reinforced and negative impacts are reduced.
1.5
Research Focus
Considering the scope of the topic and the range of activities of the project, several decisions were made with respect to the focus of research. As will become clear below, this study focuses on the first level of the coffee chain, only on those farmers participating in the FFS and finally on the socio-economic impact of the project. It is important to realize that this impact is therefore only a small part of the potential overall potential impact.
First Level of the Coffee Chain
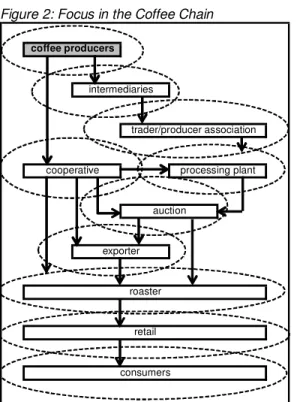
In the figure below an overview of the general coffee chain is given. Each link in the supply chain is surrounded by a circle that overlaps with the circle of the next link. This represents the environment in which every chain member is embedded and where a direct and/or indirect impact could be expected. The impact study could focus on any or all of these chain members, the linkages between them or the environment in which they are embedded. This thesis focuses on the first link in the coffee chain, being the producers, and although the external environment is taken into account, it is not analysed what the impact of the project is on this environment.
Figure 2: Focus in the Coffee Chain
coffee producers cooperative exporter auction consumers processing plant intermediaries retail trader/producer association roaster
12 Participating Farmer Households
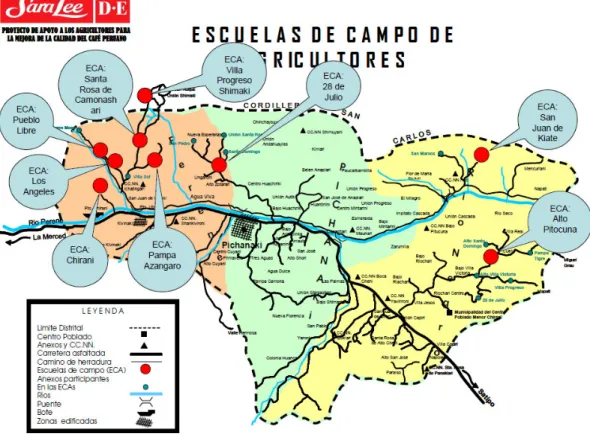
By 2008 twelve Farmer Field Schools had been introduced in the project region and, as will become clear in chapter six, the FFS have been de departure point for the definition of the ‘treatment’ group, i.e. the group which will be used to determine the socio-economic impact of the project. The first three FFS were introduced in 2003, followed by another six in 2004. Considering the short laps of time from the implementation of the last three FFS, in 2005, they were not included in the study. In figure 11 the location of the nine FFS that were included in the sample are depicted.
Figure 3: Overview of the Farmer Field Schools
Source: project proposal 2005 (den Belder 2005, p.2)
In the next figure the chain link of coffee producers and their environment is illustrated schematically. In this study only the impact on those households that participated in the FFS depicted above will be analysed.
Figure 4: Focus in the Local Project Context
Non particapting Villages Other Participating Households Non Participating Households Coffee Producers Particapting Villages Ubiriki Valley
Socio-Economic Impact
Besides focusing on households, this study was also narrowed down by focusing on the socio-economic impacts of the project. Choosing an socio-economic focus was a logical choice since a large part of the project activities were developed with the goal of increasing the income of coffee farmers. Furthermore, it was a logical choice considering the background in which this study was conducted, namely as a master thesis within the department of Development Economics of Wageningen University. However, as will be discussed in the literature review (chapter 2), research on similar projects reveals a much broader impact. Also taken into account the background of the researcher, a choice was made to focus on socio-economic issues instead. Hereby a much broader impact is captured and a better understanding of the potential contribution to the livelihoods of coffee farmers in developing countries is developed.
The term socio-economics is however still very broad and needs some more explanation. The definition from the Society of Advanced Economic (Society of Advanced Economics Retrieved October 1st) describes socio economics as ‘an emerging meta-discipline which begins with the assumption that economics is not a self-contained system, but is embedded in society, policy, and culture’. It further assumes that ‘interests are not necessarily or automatically complementary and harmonious and that societal sources of order are necessary for markets to function efficiently. Socio economics further assumes that individual choices are shaped by values, emotions, social bonds, and moral judgments rather than by narrow self-interest.’ Although this definition gives a general idea of the discipline, it does not provide a clear definition of what socio-economic data consists of or how it is measured.
Whereas other concepts such as age or gender are clear-cut, socio-economic data is more complex. In the US socio-economic status is for example measured using one variable being household income. In Latin America however household income is difficult to measure due to a variety of reasons, such as non-cash and barter activities, unsteady cash flows and absence of household financial bookkeeping as well as differences in costs of goods and services (Soong 1997). Moreover, even if household income could be measured, it might not provide a complete or realistic image of the socio-economic standard. Instead concepts such as education, profession or assets could be used to provide an indication of socio-economic standard. However, there are many more concepts used to measure socio-economic standards varying from country to country and study to study. These could include everything related to population, human development, land, water, labour costs, livestock, production, and markets (Bonfiglioli 1995).
The concept of socio economics is thus very broad and choices will be made on how it is measured. The Sustainable Livelihood Framework elaborated in paragraph 3.2 provides a good starting point for ordering the socio-economic impacts that emerge from this study. Furthermore, since there are many possibilities of socio-economic impact indicators to measure the activities of the project, qualitative research was conducted to identify the most important ones (see 4.2)
1.6
Research Questions
Based on the preceding paragraphs the main research question can be formulated as follows:
What has been the socio-economic impact of the DE Foundation Coffee Project in Peru on the livelihoods of the households in the Ubiriki valley?
Assessing the socio-economic impact of the project involves two basic steps; tracking changes since the implementation of the project and establishing the causes of these changes and how they are linked to the project. Moreover, three different aspects should be considered when analysing the impact of a development project: i) outputs, or the immediate products of a project, ii) outcomes, or consequences of the outputs and iii) impacts, the broader and longer-term goals(Gottret and White 2002). Although this investigation concerns itself with the third aspect, the first two will need to be identified in order to determine the third.
14 The main research question can be subdivided into three sub-questions:
A. What have been the changes for the households in the Ubiriki valley as a result of the implementation of the DE Foundation Coffee Project in Peru?
B. What has been the socio-economic impact of these changes on the households in the Ubiriki valley?
C. How do these changes relate to the overall livelihoods of the households in the Ubiriki valley?
Obviously, these sub-questions are very broad and it will not be possible to answer them in full detail. However, the methodology applied to this research (see chapter 4) and the output-outcome-impact framework (see CH3.1) allows for prioritizing. The choice of indicators, discussed in chapter 5, can consequently be analysed in a structured way using the sustainable livelihood framework (see 3.2) which implies that the broad and realistic view of the project’s impact can be preserved.
1.7
Outline of the Thesis
In chapter two an overview of the literature will be given in relation to the coffee market; the development of certification and codes of conduct in the coffee market; and the impact and limitations of comparable projects. In chapter three, two analytical frameworks will be discussed; the output-outcome-impact framework and the sustainable livelihood framework. In chapter four the methodology of this thesis will be provided. This methodology includes information on the research approach, the data collection techniques and an extensive discussion on the data analysis. In chapter five the results of the research will be discussed. After giving an overview of the impact areas in the output-outcome-impact framework, each sub-paragraph will outline the choice of indicators in a specific area, provide a description of the data, use several methodologies to analyse this data and draw conclusions on the impact of the project on those indicators. In chapter six, the discussion chapter, these results will be integrated in - and discussed with reference to, the sustainable livelihood framework. In the final chapter, chapter seven, the research questions will be answered, the limitations of the thesis will be discussed and some suggestions are made for future research.
2
Literature Review
In paragraph 2.1 the coffee market will be introduced to give the reader an idea of the context in which the DE Foundation Coffee Project was implemented. Moreover, the information will be useful to understand the importance of the project and its impact as a potential means to improve the living conditions of small-scale farmers. In paragraph 2.2 some background information on the development of certifications and codes of conduct in the coffee market will be given, being an important background incentive for the development of the project, and also being an important element the project. In paragraph 2.3 the socio-economic impact of comparable projects will be discussed followed by a discussion of the limitations of such project in paragraph 2.4. The project will finalised with a short chapter conclusion in paragraph 2.5.
2.1
The Coffee Market
In the introduction it was already mentioned that 8% of the farmers in the Chanchamayo region depend on coffee and that within the Ubiriki valley this number is much higher at around 80%. The fact that coffee is not only important for Peru becomes apparent from the trade statistics, since coffee is the second most traded commodity after petroleum, providing Latin America, Asia and Africa with an important source of income involving more than 25 million poor families (Gresser & Tickell 2002, cited Utting-Chamorro 2005).
Trade in coffee was regulated from 1962 until 1989 by the International Coffee Agreements (ICA) which regulated a set of production and consumption quotas and governed quality standards (Bacon 2005). The most important results of the ICAs were that supply was restricted and prices were kept at a high level and stable. Due to the domination of the free-market economy in many producing countries and the end of the Cold War the ICAs disappeared by the 1990s. (Zehner 2002) As a consequence of this market liberalization and under influence of globalization in general, the coffee supply chain was reorganized and the marketing boards indicated in figure 5 disappeared. Nowadays the supply chain is dominated by five multinationals who control almost 70% of processing and commercialisation of coffee (D’Haese, Vannoppen et al. 2007).
16
Figure 5: General Structure of the Coffee Marketing Chain
Source: Figure 1 General structure of the global coffee-marketing chain (Ponte 2002 p.1102)
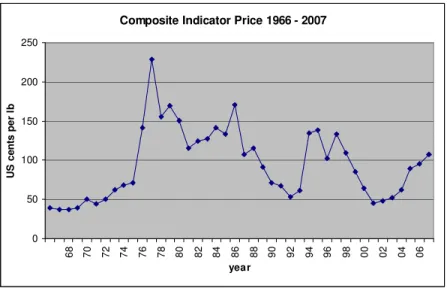
After the collapse of the ICAs a crisis emerged in the coffee sector. As can be seen in figure 6 the indicator price3 of the International Coffee Organization (ICO4) fell by more than 50% between 1997 and 2001, and the price in 2001 was the lowest since 1971 (Zehner 2002 p.1). After 2002 the ICO indicator price slightly increased and is the highest since 1998.
3
The price calculated based on the market share of exports of each group of coffee weighted in accordance with Annex I of document EB-3776/01 Rev. 1. (see http://dev.ico.org/about_statistics.asp, retrieved 14-10-2008)
4
The International Coffee Organization (ICO) is the main intergovernmental organization for coffee, bringing together producing and consuming countries to tackle the challenges facing the world coffee sector through international cooperation.
Figure 6: Composite Indicator Price 1966 – 2007
Composite Indicator Price 1966 - 2007
0 50 100 150 200 250 6 8 7 0 7 2 7 4 7 6 7 8 8 0 8 2 8 4 8 6 8 8 9 0 9 2 9 4 9 6 9 8 0 0 0 2 0 4 0 6 year U S c en ts p er l b
Source: based on (ICO 2007-b) 5
In addition, Ponte (2002) illustrates that monthly price volatility has increased considerably, being almost twice as variable in the period of 1990 to 1997 compared to the decade before. The price volatility increased even more from 1997 to 2000. Finally, the author illustrates that the power shift in the coffee supply chain to roasters and other major actors resulted in a decrease in the producers’ share from 20% in 1989 to 13% in 1995.
This coffee crisis has become even more critical as a consequence of oversupply; since 1990 coffee production worldwide has increased by 15 percent, whereas consumption has only increased by seven percent (Linton 2005). Three main factors are identified for the increase in coffee supply (D’Haese, Vannoppen et al. 2007) illustrated in figure 7 including the change in coffee production techniques in Brazil, the entrance of low cost coffee from Vietnam and the increasing production and consumption of Robusta coffee. Being a permanent crop that only starts producing after a number of years, it is difficult to adapt the production to changes in demand and supply, causing problems especially for small scale producers (D’Haese et al. 2007)
Figure 7: Total Production Coffee 1977 – 2007
Total Production Coffee 1977-2007
60000 70000 80000 90000 100000 110000 120000 130000 140000 77 79 81 83 85 87 89 91 93 95 97 99 01 03 05 07 year x 10 00 b ag s o f 60 kg
Source: based on (ICO 2007)
5
From March 1965 to September 1976, refers to the Composite Indicator Price 1968; From October 1976 to September 1981, refers to the Composite Indicator Price 1976; From October 1981, refers to the Composite Indicator Price 1979; From October 2001, refers to the Composite Indicator Price 2001
18 Farmers' income has decreased to such an extent that many receive prices for their coffee below the production cost (Brown et al. 2001, cited in Utting-Chamorro 2005, p.584). The crisis has also severely decreased the social sustainability of many farmers and their communities, leaving them in poverty which decreased their health, worsened the educational prospects of their children and encouraged migration to overcrowded urban areas (Linton 2005, p.601 ). As Utting-Chamorro (2005, p.584) noticed, these trends also affect environmental sustainability since it increases threats to the land and wildlife where coffee is grown. The decrease in coffee prices thus affected all three pillars of sustainable development; economic, social and environmental sustainability (UNCTAD 2003, cited in Golding and Peattie 2005, p.156)
2.2
Codes of Conduct in the Coffee Sector
As a result of the poor living conditions of coffee farmers worldwide, the effectiveness of conventional aid activities, the impact of coffee production on the environment, and the character of the conventional trading system, several certifications schemes and codes of conducts have been developed in the coffee sector. The movement of ‘fair trade’ was developed in the Netherlands in 1959 by missionaries and catholic youth. During the 1960s, UNCTAD (United Nations Conference on Trade and Development) developed the concept “trade not aid” which consequently led to the development of the ‘world shops’ in which products of disadvantaged producers in third world countries were sold at a fair price. The world shops were in fact developed out of an ideology against the mainstream market, but the outreach of this niche market was only marginal and it was thus necessary to sell the product in the mainstream market. In order to introduce the fair-trade products in this market, labelling organizations were developed of which the Max Havelaar Foundation was the first.
The idea of fair-trade spread rapidly to other Western European countries and new labelling initiatives were developed and joined together in the umbrella group known as the Fairtrade Labelling Organization (FLO) (Rice 2001; Tollens 2003), which is also the first certification discussed in this paragraph. As a result of the mainstreaming of Fair Trade in the end of the 80’s, the increasing awareness of consumers in general and the resulting increase in corporate social responsibility (CSR) initiatives of multinationals, several alternative codes and certifications have been developed in the coffee sector. Three of those initiatives, Utz Certified, Rainforest Alliance and C.A.F.E practice will be discussed below since they are also relevant for the project that is evaluated in this study. In appendix 9.1 an overview can be found of the norms of each certification. From this overview it becomes clear that there is significant overlap between the different certifications and codes of conduct. However, it needs to be taken into account that there are also differences next to the criteria used, for example at cooperative level or with regards to pricing or inspection.
2.2.1 Fair Trade
Although the Fair Trade network was originally meant to function as the groundwork for an alternative trading system, the goals changed in the late 1980s as the movement sought to gain a larger market share by transforming the mainstream market (Fridell 2006). Taylor (2005) describes this as Fair Trade’s ‘mainstreaming strategy’ which aims to reach this increase in market share by incorporating large retailers and multinationals in its network. Fair Trade is engaged with the mainstream market in two ways. On the one hand it is encouraging conventional companies to adopt fair-trade practices and on the other hand it markets its products through mainstream outlets such as supermarkets (Tallontire 2002).
The most widely used definition of Fair Trade is the one used by FINE6: “Fair Trade is a trading partnership, based on dialogue, transparency and respect, which seeks greater equity in international trade. It contributes to sustainable development by offering better trading conditions to, and securing the rights of, marginalized producers and workers - especially in the South. Fair Trade organizations (backed by consumers) are engaged actively in supporting producers, awareness raising and in campaigning for changes in the rules and practice of conventional international trade” (EFTA 2007).
The standards are divided into generic Fair Trade standards and product specific standards, resulting from the wide range of food and non-food products covered by Fair Trade certification. Standards are subdivided into social, economic and environmental development (FLO 2008). Especially the social standards are very complex and detailed in comparison to other certification schemes. A difference is made between the minimum requirements that should be met by each producer organisation and the progress requirements, where the producers must show continuous improvement. In order to obtain the Fair Trade certification, farmers must be organized in a producer organization that is able to contribute to the social and economic development of the farmers and their communities. As opposed to other certification schemes and codes of conduct, Fair Trade is specifically targeted at small scale farmers. Nowadays, Fair Trade certification is run by an autonomous organization, which coordinates the inspection of producers to see if the norms are met. (FLO 2008-b)
When selling coffee that is Fair Trade certified, a fixed price premium is guaranteed over the world index price. The idea behind this is that small farmers should be able to afford basic health care, education and housing and that they should be able to sustainably develop their farms. Besides the fixed price premium Fair Trade also offer a pre-financing agreement, making up to 60% of the contract value available to the producer organization to pay at harvest. Capacity building and the further development of a reliable and responsible producer organization are also important pillars of the Fair Trade project. FLO further encourages producers to work towards organic certification, which is also rewarded with an extra price premium. (Slob and Oldenziel 2003)
2.2.2 Utz Certified
The vision of Utz Certified is ‘to achieve sustainable agricultural supply chains where farmers are professionals implementing good practices which lead to better businesses, where the food industry takes responsibility by demanding and rewarding sustainably grown products, and where consumers buy products which meet their standard for social and environmental responsibility’. The Utz Certified Code of Conduct was developed in 1999 by a consortium of Guatemalan grower-exporters together with the Ahold Coffee Company. It is based on the EurepGAP Protocol for Fruits and Vegetables, developed by various European retailers in order to provide basic assurance for food safety and environmentally and socially appropriate growing practices. Utz Certified transferred those generic norms to the production of coffee. (Slob and Oldenziel 2003)
The Code of Conduct contains 204 control points, of which 71 major points (to comply with for 100%), 98 minor (of which 95% needs to be fulfilled) and 34 recommendations. The norms are subdivided into issues related to traceability, product identification and separation; management system, record keeping and self-inspection; varieties and rootstocks; soil management; fertilizer use; irrigation; crop protection products; harvesting; post-harvest product handling; worker health, safety and welfare; environment; and access to a complaint form. The certification of Utz can be obtained by an individual farmer or by a producer organization, which is the case for the project in Peru. The producer organization in this case is responsible for implementing and monitoring the requirements. This is first of all done through the development of an Internal Control System (ICS) that should include an annual inspection against the Code of Conduct. Next to the ICS an annual external inspection is conducted in which a representative group of farmers is inspected and the ICS system itself is evaluated. (UtzCertified 2006)
6
FLO, IFAT, NEWS and EFTA started to meet in 1998 and, when they work together, are known by their acronym, FINE. The aim of FINE is to enable these networks and their members to cooperate on important areas of work, such as advocacy and campaigning, standards and monitoring of Fair Trade (Retrieved 17 June 2007 from http://www.ifat.org
20 Unlike Fair Trade, no fixed price premium is determined by Utz Certified. Instead, a ‘sustainability differential’ is used to determine the added value of the norms with which the producer or the cooperative complies. In times of a high index price, this sustainability differential is determined in a negotiation process between the buyers and sellers of the coffee, without interference of Utz Certified. In times of low coffee prices, Utz Certified offers guidelines in terms of the minimal height of the differential, although these guidelines are not binding and ultimately the price depends on the negotiation process. (Slob and Oldenziel 2003)
2.2.3 Rain Forest Alliance Certification
Rainforest Alliance is an international conservation organisation. It works ‘to conserve biodiversity and ensure sustainable livelihoods by transforming land-use practices, business practices and consumer behaviour’. One of its main programs, the agricultural program, supports the Sustainable Agriculture Network (SAN), a group of conservation organizations that intends to link responsible farmers with conscious consumers by means of the rainforest alliance certification. Since 1991, SAN has developed guidelines for the responsible management of export agriculture, certifying amongst others bananas, cocoa, flowers and coffee. (Rainforest Alliance 2008a)
The Sustainable Agricultural standard incorporates norms in relation to the social and environmental management system, ecosystem conservation, wildlife protection, water conservation, fair treatment and good working conditions for workers, occupational health and safety, community relations, integrated crop management, soil management and conservation, and integrated waste management. In total 94 criteria are included in the 2008 Standard, of which 14 are critical and binding. Of the remainder, at least 80% of the criteria should be met. (RainForestAlliance 2008) Although the certification process runs through the cooperative in Peru, the certifications are obtained individually. Producers who seek to be certified by Rainforest Alliance can do so through an independent certification body. Once a year an audit is done by SAN evaluators. (RainForestAlliance 2008-b)
As opposed to Fair Trade and Utz Certified, Rainforest Alliance is not designed as an alternative marketing system as such, but rather as a way to promote sustainable farm management. Rainforest Alliance or SAN are therefore not involved in the negotiation process. However, as with the other certifications, economic benefits can be expected in terms of sustainability, efficiency, market access or labour rights. (Slob and Oldenziel 2003)
2.2.4 C.A.F.E Practice
A third ‘certification’ the project in Peru deals with is the C.A.F.E Practice initiative. The initiative is an outcome of the Preferred Supplier Program, launched by the Starbucks Coffee Company in 2001. Its goal is related to evaluating, recognizing and rewarding producers for high quality and sustainable coffee. Evaluation criteria are related to product quality, economic accountability, social responsibility, and environmental leadership in coffee growing and coffee processing. C.A.F.E. Practices requires that each component of the supply chain meets the minimum economic, social, and environmental requirements of the C.A.F.E. Practices Guidelines. As with Utz Certified not every individual farmer has its own score, which in this case is it’s ‘certification’. Within this group of farmers an annual stratified random sample will therefore be made to verify if the criteria are indeed met. (CAFEpractice)
Based on a point system, suppliers or producer associations are listed on the approved supplier list and will be awarded ‘first consideration’ when purchasing decisions are made, that is if the product specifications meet the norms with respect to quality and taste. Three different supplier statuses are acknowledges being strategic, preferred or verified. This consequently results in preferred pricing and contract terms based upon a minimal number of points, and the improvement with respect to the number of points obtained in the previous year. (CAFEpractice 2004)
2.3
Impact of Comparable Projects
This paragraph is mainly related to Fair Trade ‘projects’ because the DE Foundation Coffee Project in Peru is probably most comparable to these types of ‘projects’. The idea of Fair Trade as a development ‘project’ is elaborated by Paul (2005) . In her article a project is defined as a ‘process of providing services limited in time: by using resources allocated for the purpose, activities are carried out and services (outcomes) are provided with the intention of producing a pre-defined effect (the objective of the project)’ (p.135). Fair-trade movements as well as (international) aid agencies use an integrated and interventionist project approach in attempting to effect (socio-economic) change, as is also a characteristic of the project approach of the DE Foundation. This comparison is actually another reason why the DE Foundation Coffee Project in Peru can be compared to Fair Trade projects. This implies that a limited number of farmers are aided in certain processes and this outcome in effect corresponds to that of a ‘development project’, as is the case with the project of interest. For the purpose of this research Fair Trade and the DE Foundation Coffee Project will be perceived as such.
The project is furthermore comparable to Fair Trade since the project is build around the same three pillars of development, being capacity building (in FFS), organization of small scale coffee farmers in a producer organization and certification (including amongst others, Fair Trade). Moreover, taking Fair Trade as starting point is important since these types of projects can be interpreted as a result of the increased awareness among consumers and the resulting Corporate Social Responsibility (CSR) policy of large multinationals. As part of this CSR policy currently the four biggest coffee companies have all started to certify a small proportion of their production (IIED 2005, p.30). The DE Foundation Coffee Project in Peru can also be interpreted within this context. Finally, coffee represents 60% of all Fair Trade sales (Golding and Peattie 2005, p.156) and consequently much research has been conducted on this topic. In this paragraph the socio-economic impact of Fair Trade projects will therefore be discussed to be used as potential impact indicators for this project. Moreover, results of this review can be used to explain certain relationships between the data during the statistical analysis.
The majority of the studies upon which this paragraph is based are qualitative in nature and, as was argued in the introduction, there is still a general lack of quantitative research that makes a comparison with comparable non participating farmers. In chapter 4 (methodology) more arguments are given on the need for this type of quantitative analysis.
Based upon the literature review ten socio-economic impact areas at household level are identified. It should be noted that Fair Trade certification, just like any intervention, should be considered within its context where it is re-interpreted by a range of actors (Pirotte, Pleyers et al. 2006, p.449). FAO (Danker 2003, p.63) summarises what will become apparent from the impact areas, namely that these types of projects seems to be successful both in terms of its marketing approach as well as additional aid activities. Both activities are considered to be mutually supportive and highly interlinked.
Next to these impacts at household level, it also needs to be taken into account that since the introduction of Fair Trade the different needs of small holders in terms of ethical standards are increasingly being considered, not only by consumers, but also by large market actors (Tallontire 2002, p.16). This consequence is in fact one of the reasons why it is important to analyse the DE Foundation Coffee Project in Peru in the context of Fair Trade projects.
2.3.1 Price Impact
One of the first and most obvious impacts of Fair Trade to be considered is that of the ‘fair price’ and the Fair Trade premium paid to the cooperative. One needs to divide the Fair Trade price premium in an extra coffee price and a premium for development. Evidence on the size of Fair Trade impact on price is mixed and, as Calo & Wise (2005, p.43) argue, it depends on the height of the conventional coffee prices. This is further demonstrated in a report of FAO (Danker 2003, p.59) in which the Fair Trade coffee prices in Bolivia are compared to the conventional prices. In the years 1994 and 1995 the Fair Trade price was similar or only slightly higher than the conventional market price, but in 2000 and 2001 the Fair Trade premium was almost twice the market price. That Fair Trade premiums can indeed positively influence the price for coffee received by farmers is
22 supported by Bacon (2005, p.504) who found that certification has a greater influence on price than quality and was thereby the greatest differentiating factor.
Besides higher farm gate prices and community investments, Fair Trade can also reduce price volatility by guaranteeing a stable price. Price stability might induce producers to make investments they might not make otherwise (Zehner 2002, p.10). But the risk does not only depend on the price stability but also on the stability of its demand and most Fair Trade cooperatives sell only part of their output to Fair Trade buyers and on an irregular basis (James 2000, cited in Zehner 2002, p.10). Parrish et al. (2005, p.182), confirm this finding in Tanzania, where Fair Trade products were bought from whichever farmer who is able to fill the contracts at that time. Furthermore, given the small portion of coffee sold as Fair Trade, the average price received by individual farmers is hardly affected (Danker 2003, p.63). This issue, being considered as one of the major limitations of Fair Trade, will be further discussed in 2.4.1.
Despite of these arguments, Bacon (2005, p. 506) found that Nicaraguan coffee producers only linked to conventional markets considered it to be four times as likely to lose their farm due to low coffee prices than farmers belonging to the Fair Trade network. This conclusion is supported by the work of Utting-Chamorro (2005, p.591) who found that all farmers referred to greater economic stability and security since their involvement in the Fair Trade network. Besides this, rural Nicaraguans were able to maintain their plantations, plant more coffee and even buy new land despite of the fact that living conditions of coffee producers elsewhere deteriorated due to the coffee crisis (Pirotte et al. 2006, p.445). Although not discussed here extensively, it should be mentioned that in Nicaragua it was also found that, although reducing risk of coffee farmers, no difference in quality of life was found, thus pointing at the many other conditions which are causing the perception of decreasing quality of life (Bacon 2002, p.506).
2.3.2 Costs
Zehner (2002, p.10) argues that, unless the market prices are extremely low, Fair Trade is “an inefficient method of transferring income from consumers to growers”. Instead, he argues it would be more efficient if socially conscious consumers would write a check of $1.50. The main reason for this limited impact on coffee prices according to Zehner are the high retail price premiums on Fair Trade products and high administrative cost involved in these programmes.
Utting & Chamorro (2005, p.588) further found that in Nicaragua debts held by cooperatives, fixed expenses for processing equipment, export cost and funds for capitalisation and producers cause the lower than expected farm gate prices. Furthermore, hidden costs of marketing and coordination can decrease the benefits of Fair Trade certification (Giovannucci and Ponte 2005, p.297).
Renard (2005, p.426) also brings under attention the recent decision of FLO to charge farmers for third party certification, which of course further decreases it’s premium. Although producer organizations do not question the need of third party certification in terms of label credibility, they do doubt the lack of transparency with which FLO determined the rates. However, it is also argued that as more in-country certification agencies develop, third-party certification should become cheaper and not form a significant problem for Fair Trade producers (Rice 2001, p.59).
Although Fair Trade initiatives can increase certain costs which were described above, economies of scale of Fair Trade initiatives can also be identified in the use of indivisible inputs such as managerial abilities and physical infrastructure (Dhaese et al. 2007, p.173)
2.3.3 Market Access
Increasing market access for small and marginalised producers is often seen as a significant impact of Fair Trade. Fair Trade does not only give farmers access to the Fair Trade market but also provides openings to the conventional market. This is due to implicit incentives in Fair Trade certification for organic production and quality improvement (Paul 2005, p.148). This will be further discussed under the heading quality improvement.
This finding is supported by Parrish et al. (2005) in illustrating that Tanzanian cooperatives attributed their ability to sell to the conventional market to participation in Fair Trade. The cooperation benefited from name recognition in consumer countries, long-term relationships with partners and access to market information. This increased market access evidently contributes to the reduced risk mentioned before.
2.3.4 Local Capacities
Because fair-trade initiatives started with a clear development perspective, many producer groups received technical assistance in addition to previously mentioned benefits of price premiums and market access (Danker 2003, p.54). This technical assistance has lead to a variety of positive impacts. Pirotte et al. (2006, p.446) for example explain how training and mutual support encourages and enables the farmers to meet market demand. This finding is also supported by other authors stressing issues such as the importance of knowledge, experience and skills management gains (Parrish et al. 2005, p.183) and improved production methods (Paul 2005, p.148).
Another important benefit of Fair Trade projects is the strengthening organizational capacity by strengthening their producer organizations (Taylor 2005, p.137). Nevertheless, the evidence on this issue is mixed. Giovannucci & Ponte (2005, p.297) argue that with the right dynamics, the efforts needed to meet sustainability standards can indeed create local empowerment and organizational straightening. However, in other cases producer organizations might find it difficult to maintain cohesion if the expected benefits do not materialize as expected. They further argue that the hidden costs of marketing, coordination, uncertainty and the limitations of collective action may decrease overall net benefits of certification efforts and threaten existing governance structures in cooperatives or associations.
Apart from the technical and organizational capacities, it is also argued that Fair Trade farmers have attached greater value to their children’s education due to recommendations of international and national Fair Trade actors (Pirotte et. al, p. 445)
2.3.5 Access to Credit
Several aspects have led to better access to credit as a result of Fair Trade. To begin with, it increased due to FLO’s pre-financing requirements and on the other hand due to the fact that certification lends ‘‘a certain prestige since it is assumed that the organization is subject to external monitoring and also demonstrates initiative and a capacity to enter new market niches’’ (Aranda & Morales 2003 cited in Taylor 2005, p.137). Finally, as was brought to the attention by Dhaese et al. (2007, p.173), credibility is increased because better internal social control can increase reliability of compliance to the codes of practice. Besides the most obvious consequences of this benefit, among them being the possibility to make better investments, access to credit also contributes to the reduction of risk of small-scale farmers.
2.3.6 Community Development
The Fair Trade standard requires producer organisations to retain a premium of US$5/100kg for community development. Examples of the usage of such premiums in Nicaragua are the construction of new health care centres; renovation of secondary schools and eco-tourism projects (Utting-Chamorro 2005, p.594-figure 5); the diversification of economic activities, such as the construction of a juice factory; the creation of a cash reserve for the purchase of coffee at auction (Pirotte et al. 2006, p.448); and putting electricity in a government-run dispensary to refrigerate medicines (Parrish, et al. 2005, p.184). However, premiums are also used to cover technical support to producers (Taylor 2005, p.137); partly or fully distributed to co-operative producers; or reinvested in the cooperative’s commercial activities (Pirrote et al. 2006, p.448 & Parrish et al. 2005, p.184).