Six Degrees of Scientific Data: Reading Patterns for
Extreme Scale Science IO
Jay Lofstead
¶, Milo Polte
†, Garth Gibson
†, Scott A. Klasky
§,
Karsten Schwan
∗, Ron Oldfield
¶, Matthew Wolf
∗§, Qing Liu
§ ∗Georgia Institute of Technology
†Carnegie Mellon University
§
Oak Ridge National Lab
¶Sandia National Labs
ABSTRACT
Petascale science simulations generate 10s of TBs of ap-plication data per day, much of it devoted to their check-point/restart fault tolerance mechanisms. Previous work demonstrated the importance of carefully managing such output to prevent application slowdown due to IO blocking, resource contention negatively impacting simulation perfor-mance and to fully exploit the IO bandwidth available to the petascale machine. This paper takes a further step in understanding and managing extreme-scale IO. Specifi-cally, its evaluations seek to understand how to efficiently read data for subsequent data analysis, visualization, check-point restart after a failure, and other read-intensive oper-ations. In their entirety, these actions support the ‘end-to-end’ needs of scientists enabling the scientific processes be-ing undertaken. Contributions include the followbe-ing. First, working with application scientists, we define ‘read’ bench-marks that capture the common read patterns used by anal-ysis codes. Second, these read patterns are used to evaluate different IO techniques at scale to understand the effects of alternative data sizes and organizations in relation to the performance seen by end users. Third, defining the novel no-tion of a ‘data district’ to characterize how data is organized for reads, we experimentally compare the read performance seen with the ADIOS middleware’s log-based BP format to that seen by the logically contiguous NetCDF or HDF5 for-mats commonly used by analysis tools. Measurements as-sess the performance seen across patterns and with different data sizes, organizations, and read process counts. Out-comes demonstrate that high end-to-end IO performance requires data organizations that offer flexibility in data lay-out and placement on parallel storage targets, including in ways that can make tradeoffs in the performance of data writes vs. reads.
Categories and Subject Descriptors
D.4.2 [Operating Systems]: Storage Management— sec-ondary storage
General Terms
Design, Experimentation, Measurement, Performance, Stan-dardization
Copyright 2011 Association for Computing Machinery. ACM acknowl-edges that this contribution was authored or co-authored by an employee, contractor or affiliate of the U.S. Government. As such, the Government re-tains a nonexclusive, royalty-free right to publish or reproduce this article, or to allow others to do so, for Government purposes only.
HPDC’11,June 8–11, 2011, San Jose, California, USA. Copyright 2011 ACM 978-1-4503-0552-5/11/06 ...$10.00.
Keywords
ADIOS, HDF5, PnetCDF, logically contiguous, log-based, analysis, visualization, IO, Lustre, petascale
1.
INTRODUCTION
Scientific productivity is a key goal when running petas-cale science simulations. To achieve this goal, scientists must analyze enormous quantities of data generated by petascale codes. This is an important technical challenge because obtaining high ‘end-to-end’ IO performance requires opti-mizing both for writing simulation output to storage and for reading it for subsequent data processing and analysis. Several complicating issues to consider when reaching these goals include the following. First, as HPC applications run with higher process counts, we see increased frequencies and sizes in the checkpoints needed for fault tolerance [23]. Sec-ond, there are proportional increases in the resolution and sizes of the data analysis outputs used to ascertain applica-tion progress and health, to extract select scientific insights, or for code coupling in complex simulation systems. And third, already, for certain analysis systems in common use, such as the VisIt visualization system [26] used to render scientific data, IO performance has come to dominate all other costs observed in their use [8].
Middleware-based methods have been used in some of the recent work on extreme-scale IO. Improvements have been demonstrated by increasing write performance [15], creating new output formats for efficient data storage across stor-age targets [13], enriching IO software stacks with meth-ods for data staging [2, 17], improving IO performance with asynchronous or adaptive IO methods [12] and by explicitly scheduling such data movements [3]. An issue remaining for such work, however, is the aforementioned consideration of end-to-end IO performance. Once data has been written, it must be efficiently read by restarts and by the analysis or vi-sualization codes used for data exploration and understand-ing. This paper seeks to both support further examinations of reading performance by proposing common reading pat-terns that should be evaluated for subsequent read-centric work as well as showing a set of evaluations using these pat-terns.
Working with application scientists for petascale science codes, the paper first contributes a set of six common read patterns seen for these applications’ checkpoint/restart, anal-ysis, and visualization data. Second, experimental evalu-ations based on these patterns compare the performance seen when data is written in two different ways. The first evaluation uses a logically contiguous layout proposed and adopted by the NetCDF and HDF communities decades ago
for portability and in an effort to simplify subsequent read tasks. The second evaluation uses a log-based data format, a purposeful departure from logically contiguous formats. When using log-based formats, we observe high end-to-end IO performance not only for writing files – as also seen in log-structured file systems [20] – but also for subsequently reading them. The latter is in contrast with common wis-dom about log-structured data. The advantage comes from the log-based organization and parallel file system structure. By using a log-based approach, data can be organized so that it both exploits the large number of the storage targets present in parallel file systems and maximizes the amounts of useful data acquired by each read. ‘Useful’ is defined by how much of the data read from the file as a single storage operation is part of what was requested by the analysis read operation overall.
We gain several insights about read performance from this work. First, the use of standard file formats like NetCDF and HDF5 can result in high costs in terms of the end-to-end (i.e., write plus read) IO performance seen by end-to-end users. In response, we advocate separating portability from perfor-mance objectives. IO systems should be flexible to use the formats that are most appropriate for the tasks being under-taken. By using ADIOS’ log-based format BP, for instance, high performance for data reads is obtained by writing data across as many storage targets as possible in the parallel file system, thus improving concurrency when reading. This is particularly important when the read pattern is one that inspects a plane in the logical 3-D simulation space rather than sequentially scanning the entire file.
A second insight concerns standard benchmarks to help evaluate read performance. With the growing variety of techniques and formats to address the extreme data volumes for petascale science, devising ways to comparatively evalu-ate various techniques and formats with respect to the ways in which data will ultimately be used is important – i.e., with respect to common analysis read patterns. We used these patterns to create a benchmark that evaluates the IO performance of representative petascale codes with respect to their use of different output data formats. Others can use these patterns with their codes and scientific data sets to better assess the potential benefits their applications can derive from adopting new output formats and techniques.
A third insight is that applications should use a ‘balanced’ approach for IO. They should consider both write and read performance. Only after data is read and analyzed can sci-entists derive meaningful and useful insights from the petas-cale simulations they are running. Hence, read performance directly affects scientific productivity. We demonstrate the importance of this end-to-end approach to IO with mea-surements that examine the impacts of data size and orga-nization on subsequent analysis read patterns. This is done for both 2-D and 3-D domain decompositions to determine when, why, and to what extent log-based data formats and their uni-dimensional contiguous data organizations improve read performance. The goal is to understand the factors that affect read performance and the implications of using a write optimized format for the simulation data’s lifetime. This is in contrast to an approach that immediately converts data to the standard contiguous formats currently used by common analysis tools.
Our research leverages prior work that has shown im-proved write performance for log-structured file formats for
checkpoint/restarts for both the ADIOS [15] and PLFS [5] systems. ADIOS is the Adaptive Input/Output System (ADIOS), a joint project of Oak Ridge National Laboratory, Georgia Tech and Sandia National Laboratories. PLFS is the Parallel Log-structured File System developed at Los Alamos National Laboratory. This paper extends the initial results for reading checkpoint restarts [18] to precisely for-mulate the set of six common analysis reading patterns and then evaluating them.
In the remainder of this paper, related work is presented first in Section 2 to give background about the domain and comparative work. This is followed by representative end-to-end IO patterns seen for petascale applications in Section 3 and a description of the data organization exhibited by log-based formats and the IO architecture in which they are re-alized in Section 4. Experimental evaluations of the concept and its performance appear in Section 5. This is followed by detailed discussion and analysis of results in Section 6 where we also discuss the implications of using different file formats on the IO pipeline used with petascale machines. Conclusions and future work appear in Section 7.
2.
RELATED WORK
Based on the knowledge of the potential reading penalties for log-structured formats [20], self-describing data formats like HDF5 [1] and NetCDF [10] were developed. These for-mats offer a balanced approach to write and read perfor-mance using a logically contiguous format. The scale in-troduced by petascale science, however, has revealed limita-tions of these approaches. By coordinating across the writ-ing processes to achieve a canonical format, writwrit-ing times suffer. As further demonstrated in this paper, the reading times can also be impacted at scale. This means that some of the optimizations introduced by these formats can become a liability rather than an advantage. On the other hand, such formats will remain important in terms of portability and their use by third-party tools, warranting investigations of efficient methods for ‘on demand’ format conversion.
The visualization community has done extensive work on optimizing data layouts for efficient reading. Sarawagi and Stonebreaker [21] describe how to get good average read-ing performance for rectangular areas based on frequency of use. This paper is an extension of this work, but with two major changes. First, the broad availability of parallel file systems and the dramatically larger per disk capacities in RAID arrays change the optimization metric. No longer is the capacity of a single, local platter as important for storing a portion of the parallel array. Second, this paper seeks to understand the data organization based on common analysis reading patterns rather than a generalized rectangular area. Yan and Rhodes proposed a scheme for in memory layout of data for efficient visualization operations [27]. However, they do not address the on storage format and the implica-tions that has on reading performance. Rhodes, et al. [19] address reading performance by prefetching without adjust-ing the underlyadjust-ing storage format.
Other approaches to addressing the mismatch between the output organization and the read pattern needs of anal-ysis codes include the use of a staging area to host data reorganization and pre-analysis routines. Both synchronous data staging [17] and the IO Forwarding Software Layer [4] effectively manage the writing time spent by an applica-tion through aggregating such requests and thereby
par-tially managing the resulting impact on the storage system. However, such work has not taken advantage of staging ar-eas to accelerate subsequent data use for analysis or other reading tasks. Complementary work pursued in the Pre-DatA [28] project reduces the need for reading or the sizes of subsequent reads by pre-analyzing data to the extent pos-sible. The cost of the additional resources used is mitigated through write time reductions and improved data prepara-tion for later analysis operaprepara-tions.
The utility of the log-based data organization is moti-vated in part by previous work [22] that has shown that multi-dimensional data may be mapped efficiently to mod-ern disk drives in ways that preserve spatial locality across multiple dimensions. Here, in addition to data being read efficiently and sequentially in a single dimension, intelligent placement allows other dimensions to be accessed with low positioning costs. Although our goals are similar (efficient access of data across multiple dimensions), our approach is orthogonal and compatible: we operate at the level of the parallel file system, whereas prior work is implemented us-ing the firmware below the device level (albeit exposed to the application).
Zazen [25] tries to improve end-to-end IO performance by bypassing a remote, parallel file system such as Lustre. Instead, Zazen caches simulation data as a series of small files across the multiple disks of an ancillary analysis cluster attached to the high performance machine via a network. The approach yields excellent performance for appropriate analysis workloads (in particular, molecular dynamic simu-lations that map well to a time series of small files), but does not consider the simultaneous attainment of high write per-formance. Further, its architectural assumptions differ in that for them, there is no parallel file system attached to the petascale machine.
3.
END-TO-END IO PATTERNS
This section describes the end-to-end IO patterns, why they were chosen, and discusses some of the file layout fea-tures and how they relate to the IO patterns.
The first subsection summarizes the results from the pre-vious papers that evaluate the writing and reading perfor-mance for checkpoint restarts. The second subsection de-scribes the full set of six common reading patterns proposed as a standard benchmark and used as test cases in this pa-per. The last subsection discusses file layout issues related to the end-to-end patterns.
3.1
Initial performance assessment
A brief summary of the writing performance seen for log-based formats is presented first followed by tests for reading checkpoint restarts.
3.1.1
Write Performance Advantages
Initial write performance measurements showed [14] that for the Chimera supernova code, ADIOS and the log-based BP approach had an up to 1000× performance advantage compared to data being written with the standard HDF5 output format, as shown in Figure 1. The figure shows three ADIOS output methods all using the BP file format, POSIX, MPI-IO independent, and MPI-IO collective, as compared with the original HDF5 implementation. Later optimiza-tions of the HDF5 calls reduced the advantages seen by ADIOS/BP to 100×, similar to what has been shown true
for the log formats used by PLFS [5]. While one might argue that additional data conversion costs will arise if end users require data to be in some standard format like HDF5, such conversion costs have been measured as being linear with respect to data size [14].
3.1.2
Restart Reading Performance Advantages
For a broader comparison of contiguous formats, addi-tional tests also compared against another commonly used contiguous format, CDF-5 [11], part of PnetCDF. For these cases, reading the restart files, using either the BP or PLFS log-based file formats [18], resulted in read performance sim-ilar to and up to 3×better than that obtained for PnetCDF, as shown in Figure 2. These particular tests evaluated the time to read the checkpoint output as if a restart from fail-ure were happening for BP as compared with PnetCDF, restarting with half as many processes as originally wrote the checkpoint.
Figure 1: Restart Writing Bandwidth for the Chimera supernova code [14]
3.2
Test Cases
For both of our test cases, the simulation space consists of a 3-dimensional space distributed across the processes that comprise the application run. In the case of a 2-D domain decomposition, the 3-D space is decomposed such that one of the three dimensions is not split across processes. For a 3-D domain decomposition, the space is split into rectangu-lar sub-areas that do not span any dimension entirely. For both decompositions, the data stored local to each process is a 3-D piece of the entire space. When this data is writ-ten to disk, the shape of this space, particularly the overall data size and shape written as a contiguous chunk, plays an important role determining the performance of common analysis read patterns.
To test these common domain decompositions, we first es-tablish a typical set of analysis read patterns used by petas-cale science codes. These patterns are based on the au-thors’ direct experience with many application teams in the USA and beyond including combustion (S3D), fusion (GTC, GTS, XGC-1), earthquake simulation (SCEC), Magnetohy-drodynamics (MHD) (Pixie3D), numerical relativity code (PAMR), and supernova (Chimera) codes. The union of these results is represented in the set of test cases described below. The 2-D domain decomposition is used with an older version of the Chimera supernova code [16] in production use at petascale run sizes on systems at Oak Ridge National Lab and Texas Advanced Computing Center. Chimera is a
Figure 2: Pixie3D Restart Reading Performance, Large Data Model, Half as Many Process Reading as Wrote the Checkpoint [18]
code that couples multigroup flux-limited diffusion neutrino transport (a sophisticated approximation of Boltzmann trans-port) along radial rays (the ray-by-ray-plus approximation) to three-dimensional hydrodynamics, a nuclear burning net-work, Newtonian self gravity with a spherical general rela-tivistic correction, an industry standard nuclear equation of state (Lattimer-Swesty, Shen, Wilson), and with state of the art neutrino interactions. For a 3-D domain decomposition, the S3D combustion code [7] is examined. S3D is a flow solver for performing direct numerical simulation (DNS) of turbulent combustion. This resulted in the identification of the following write/read patterns:
1. All datais written and read, but writes and reads are done by different numbers of processes, and for gener-ality those numbers are not simple multiples of each other.
2. All of 1 variableis read from a complete output set. Again, this is performed using different, non-multiple numbers of writers and readers. An example is reading the temperature values associated with particles. (see Figure 3(a)).
3. All of a few variablesusing different, non-integer mul-tiple numbers of processes. An example is reading three variables to generate a magnetic field vector.
4. A plane in each dimensionfor qualitative exploration (see Figure 3(b)).
5. An arbitrary rectangular subset representing a cubic area of interest (see Figure 3(d)).
6. An arbitrary area on an orthogonal plane represent-ing one of a collection of read operations to obtain an arbitrary area within the simulation space (see Fig-ure 3(c)).
For analysis reads, Chimera most commonly uses patterns 1-3: all data, all of 1 variable, and all of a few variables. Pat-terns 4-6 are used as part of an interactive visualization: a plane in each dimension, an arbitrary rectangular subset, and an arbitrary area on an orthogonal plane. The S3D code uses nearly the same patterns: pattern 1 for produc-tion runs/restarts, patterns 2 and 3 for postprocessing and analysis, pattern 4 for production sanity checks and quali-tative exploration, and pattern 5 for postprocessing and in
(a) Whole Domain (b) Whole Plane
(c) Partial Plane (d) Sub Area Figure 3: Data Selection Patterns
depth analysis. Pattern 6 is not commonly used by S3D. The first pattern, reading all of the data, is essentially the same as the common restart process where all of the data is read back in to restore state. This restart performance was evaluated in previous work [18] so it is not considered further in this paper. Finally, we were not able to elicit from sci-ence users other read patterns for the petascale codes under study, causing us to confine our initial study to the patterns identified above.
3.3
Understanding end-to-end IO performance
This paper substantially extends the above initial results reported in [18] in four ways. First, we characterize and describe the data organizations used to obtain performance improvements. Second, we determine and evaluate addi-tional and typical science data read patterns, such as those used by analysis codes. Third, we diagnose the sources of performance improvements derived from using log-based data organizations for large-scale scientific data on the par-allel file systems used in supercomputer installations. And fourth, we propose the evaluation patterns as examples of how reading performance should be evaluated for real-world usage scenarios for scientific data. The supporting evidence of the variance in the performance based on the data layout and sizes shown in the evaluation emphasize a key insight from our work: data should be stored in ways that reflect an understanding of how it will subsequently be used.
As a way to describe a portion of a global array stored in single, contiguous piece, we introduce the termdata dis-trict. For a log-based output, there will be one data district per variable in each fragment written to the file. Typically, each fragment represents the entire data output by a single process. This data decomposition, requiring no interpro-cess coordination or data movement during output, is one of the key reasons for attaining high write performance for a log-based format. For the logically contiguous formats, a single data district is created for each variable in the file. Reorganizing the data across process to achieve this lay-out negatively impacts the writing performance due to the inter-process communication overhead.
3.4
File Layouts Examined
Since the log-based layout affects the performance to such a degree, the particular log-based format tested must be de-scribed in greater detail. The log-based BP file format is one option provided as part of the ADIOS IO library. ADIOS
is a 64 bit compliant IO componentization that provides an API almost as simple as POSIX IO. More importantly, ADIOS permits the runtime selection of different IO mech-anisms for each IO section of the simulation or host code using ADIOS. For example, a user can configure ADIOS to use MPI-IO to a BP file for checkpoint restarts and HDF5 for analysis output without changing the application source code.
ADIOS’ BP (Binary Packed) file is decomposed into frag-ments generally based on the processes that create it rather than on the logical structure of the data. This format is illustrated in Figure 4. Each of these fragments is referred to as aProcess Group. The last portions of the file consist of a file version flag and a collection of indices and pointers to the location in the file for each of the indices.
Figure 4: ADIOS’ BP File Format
At a detailed level, a process group consists of a short header listing information about the data output grouping being used, including a user-assigned name, such as restart, analysis, or diagnostics, the parameters used for this output method, and a list of variable and attribute entries. Each variable and attribute entry consists of the metadata for the item listing the name, data type, array dimensions, if any, data characteristics, and a payload blob. This pay-load blob is a memory dump of exactly what was stored in memory with no byte ordering changes nor restructuring. The indices consist of exact locations of the process groups, metadata about the process group, and the list of variably sized ‘pieces’ including information about the array dimen-sions and extents, the data characteristics for each piece, and the list of attributes and the location of each in the file. Each such variable ‘piece’, then, is a self-contained and self-identifyingdata district.
The steps taken when reading from a data district-organized file include consulting the index to determine the file off-set for reading data for the local process, reading the rel-evant district(s), and reorganizing the data discarding the unneeded data items (i.e., were not requested). There are opportunities for additional optimizations in reading data to avoid unnecessary data discards, but those optimizations have not yet been implemented.
The data district-based organization used with BP is in contrast to the data organization used by default for the HDF5 file format. The HDF5 format consists of linked blocks of items, such as a variable, attribute, or metadata. Each logical variable in an HDF5 file (and therefore, also the NetCDF cases studied in this paper) is linearized into a single blob by reconstructing from all of the pieces provided by the distributed processes in question into a contiguous, in order format. The format uses a standard byte-ordering and major dimension of the logical space as if walking all of the dimensions, in order, in nested loops. It is possible to configure HDF5 to use a data districts approach when storing variables, but it is both manually configured by the programmer and has no automatic mode for avoiding the data reorganization to make data districts of particular di-mensions.
The current version of NetCDF has replaced the underly-ing file format with HDF5. To our benefit for this evalua-tion, the relatively simple NetCDF API is a fully optimized set of calls to the HDF5 API, thus avoiding any bias based on inappropriate or inefficient use of the HDF5 API.
4.
EVALUATION ARCHITECTURE
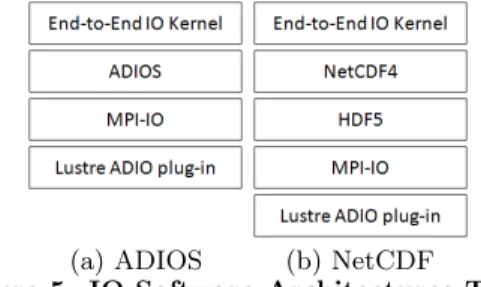
Our goal is to better understand the read performance of write optimized scientific data files. This complements earlier studies and provides a picture of the end-to-end, i.e., combined write and read, IO performance attainable on the highly concurrent file systems supporting petascale machines. The IO software stacks evaluated in our work use ADIOS version 1.2 and NetCDF 4.0.1.3 configured to use parallel HDF5 1.8, respectively. Specifically, with the ADIOS middleware, the IO stack selects the MPI transport method resulting in a two layer architecture for IO as il-lustrated in Figure 5(a). NetCDF uses the MPI transport underneath the HDF5 layer resulting in a three layer soft-ware stack, illustrated in Figure 5(b). This approach helps control inefficiencies in using the HDF5 API thereby consti-tuting an optimized use of the HDF5 API and files. Further, the additional layer used in the NetCDF stack has negligible additional overhead compared to that of the ADIOS-based stack, as total performance is almost entirely dominated by data movements to and from storage and the NetCDF API is little more than the minimum set of calls to the HDF5 API necessary to implement the functionality. Finally, to test these different patterns in a consistent way, an end-to-end (e2e) IO kernel representative of the write and read patterns is created. These user programs contain a dupli-cate of the calls made by the representative application for IO and exhibit a typical writing pattern and then reads data using any of the six patterns.
(a) ADIOS (b) NetCDF
Figure 5: IO Software Architectures Tested The Lustre file system used in all of our evaluations is configured to use 160 storage targets for all files, the maxi-mal level of parallelism allowed by Lustre. The stripe size, the amount of data written to a file before moving to the next storage target in the round-robin list of storage targets assigned to this file, plays a role in the performance as well. For the ADIOS/BP approach, the stripe size is adjusted to 4 MiB automatically. For the NetCDF setup, the stripe size is set to the default 1 MiB. The impact this stripe size has on the performance is discussed in section 6.
5.
EXPERIMENTAL EVALUATION
All tests are performed on the petascale partition of the Jaguar machine, known as JaguarPF, at Oak Ridge Na-tional Laboratory. This Cray XT5 partition contains 18,688 compute nodes in addition to dedicated login/service nodes. Each compute node contains dual hex-core AMD Opteron 2435 (Istanbul) processors running at 2.6GHz, 16GiB of DDR2-800 memory, and a SeaStar 2+ router. The SeaStar 2+ routers are connected in a 3D torus topology for scala-bility. The resulting partition contains 224,256 processing cores, more than 300TiB of memory, over 6 PB of disk space, and a peak performance of 2.3 petaflop/s. For all tests, Spi-der, the ORNL shared scratch space Lustre file system, is employed. The peak IO performance for Spider’s widow1
partition used in this evaluation from JaguarPF is 60-90 GiB/sec for writing in parallel to the 672 storage targets, depending on the network route between the compute nodes and the IO system.
To evaluate the impact of the log-based data organiza-tion and data districts compared with logically contiguous data organizations, the five remaining analysis reading pat-terns described in Section 3 are evaluated over a 3-D do-main using both a 2-D and a 3-D dodo-main decomposition. The checkpoint restart pattern has been evaluated in pre-vious work [18] and is not re-examined here. As a broader evaluation, additional configurations from Pixie3D are also evaluated for the 3-D domain decomposition. Pixie3D [6], an MHD fusion code, organizies data similar to S3D, but has multiple operating modes that alter the per process size for each variable. This yields the following sizes for each variable in each process: small (32×32×32), medium (64
×64×64), large (128×128×128), and extra large (256×
256×256). These four modes are tested for the 3-D domain decomposition. For these 3-D domain decomposition cases, all variables are double precision floating point and the sizes represent the number of doubles in each dimension. In ac-cordance with that fact, the per process total output data sizes employed are about 13 MiB for 2-D, 2 MiB for 3-D small, 16 MiB for 3-D medium, 128 MiB for 3-D large, and 1 GiB for 3-D extra large. Per process variable sizes are quite different. For the 2-D domain decomposition, it is a mere 300 doubles or 2400 bytes. For the 3-D case, it is 256 KiB, 2 MiB, 16 MiB, and 128 MiB respectively. These data sizes are used to generate output files using both 7168 processes and 16384 writing processes.
Since the layout of processes across the logical simula-tion space affects both data layouts, it is important to note how the processes are arranged when generating the test files for each test case. For the 2-D domain decomposition, the processes are arranged in a 112×64 (X by Y) space for 7K processes and 128×128 for 16K processes. For the 3-D domain decomposition, for all per-process data sizes, a 28×16×16 distribution is used for the 7K process runs and a 32×32×16 (X by Y by Z) distribution is used for the 16K process runs. This balances each dimension as fully as pos-sible for a fixed amount of data per process.
Tests are deliberately designed to avoid bias. In particu-lar, while the use of 16K processes is advantageous in terms of running at a larger scale, those runs could be perceived as biased in that these tests can more easily ‘hit’ process boundaries for reading. For example, if the sub area read neatly falls on the natural boundaries created when the data was written, fewer reads would be required to retrieve the data because more processes would be able to read the data from whole data district(s). This would result in unfairly benefitting the log-structured approach. Our response is to run additional tests with 7K processes as an alternative size yielding reads that will not easily ‘hit’ the even process boundaries for our tests with even-counts of processes per dimension against odd numbers of fragments written for at least one dimension. For reading, operations are split evenly among the reader processes.
To validate the performance impact at various scales, two sets of tests are run. The first set of ‘large scale’ results is a series of eight runs ranging from 512 processes to 4096 pro-cesses, at 512 process increments. These tests are each run at least 5 times with the arithmetic means of the elapsed
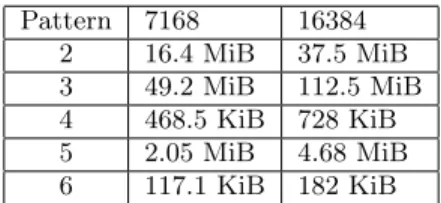
Pattern 7168 16384 2 16.4 MiB 37.5 MiB 3 49.2 MiB 112.5 MiB 4 468.5 KiB 728 KiB 5 2.05 MiB 4.68 MiB 6 117.1 KiB 182 KiB
Table 1: 2-D Data Sizes Read for Each Analysis Pattern
time being shown on the graphs. These steps are chosen for two reasons. First, for S3D, the typical analysis execution is on no fewer than one-fourth of the prior simulation run’s process count. Second, at the supercomputing centers, anal-ysis clusters of 512 to 1024 cores are becoming much more common. As this trend continues, 4096 cores for an analy-sis cluster will soon be common. The second set of ‘small scale’ experiments examine various process counts ranging from four to 512, in increments of 4 processes. At least four samples are collected for each process count across the five tests. The arithmetic means of the resulting times are used for comparisons. This experiment set represents both an ini-tial exploration scenario before a more extensive, long-term data analysis run is performed and analyses performed on small data sets. Tests are run for all cases where sufficient local memory is available. For example, it is not possible to read a 2 TiB variable into 4 processes on the machine tested. The elapsed wall clock time, in seconds, is measured from the opening of the file, through the read operation(s), to the end of closing the file for the slowest process of the readers.
The location of the planar areas within the 3-D domain is selected to be in the middle for each dimension. For the sub-planes, the same location is selected, but the plane is bounded to one-quarter the size of the plane and cen-tered. That is, the sub-plane boundary is located halfway between the edge and center for each side. The sub-area selection similarly selects a rectangular area bounded by planes halfway between the edge and the center. To en-sure that no inadvertent advantage is gained based on the in-memory data and/or file data layout, any planar or linear selection of data is performed multiple times, once in each dimension in each test case. For example, when reading a plane, 3 planes are read – one each in X, Y, and Z. The total time for all three reads is used for the results. This approach controls for the on-disk layout and any reorgani-zation required to return the selected data.
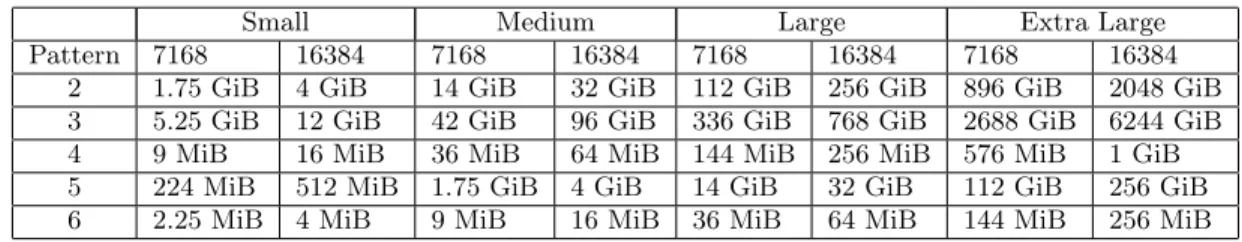
Since the aggregate data sizes are consistent across all reads, they are summarized in Tables 1 and 2. Briefly, based on how the domain is constructed for Chimera, the data sizes are very modest, even for the 16K process run. Chimera’s complexity comes from the number of variables used rather than the sizes individual variables. This large count guar-antees that few, if any, of the data districts will fall on the beginning of a stripe boundary. For the S3D application, even the smallest sizes yield variables that reach 1.75 GiB.
While this paper does not evaluate write performance, we note that there was a set of tests we could not complete for the 3-D domain decompositions. For the 2-D domain decomposition, the ADIOS/BP writing tasks took less than 10 minutes to complete but the NetCDF tasks took nearly 1 hour to complete. This result motivates the use of log-structured checkpoint formats in ADIOS/BP and PLFS. For the 3-D domain decomposition, for ADIOS/BP, all eight data files took less than 90 minutes to complete. This
in-Small Medium Large Extra Large Pattern 7168 16384 7168 16384 7168 16384 7168 16384
2 1.75 GiB 4 GiB 14 GiB 32 GiB 112 GiB 256 GiB 896 GiB 2048 GiB 3 5.25 GiB 12 GiB 42 GiB 96 GiB 336 GiB 768 GiB 2688 GiB 6244 GiB 4 9 MiB 16 MiB 36 MiB 64 MiB 144 MiB 256 MiB 576 MiB 1 GiB 5 224 MiB 512 MiB 1.75 GiB 4 GiB 14 GiB 32 GiB 112 GiB 256 GiB 6 2.25 MiB 4 MiB 9 MiB 16 MiB 36 MiB 64 MiB 144 MiB 256 MiB
Table 2: 3-D Data Sizes Read for Each Analysis Pattern cludes the 1 GiB-per-process-by-16384 process extra large
case. For NetCDF, just the 7168 process cases took nearly 11 hours. For the 16384 processes case, for just the small, medium, and large tasks, NetCDF took nearly 4 hours. The extra large case for 16384 processes did not complete in 24 hours, the upper limit available to the authors for running tests on the JaguarPF machine. By estimating the amount of data in the partial output when the task was terminated, another 90 minutes was likely to be necessary for this single output to complete. Note that this estimated extra time is the amount of time taken by ADIOS/BP for all eight output files.
5.1
Large Scale Results
Large scale tests examine the performance of the log-based data district decomposition compared with a logically con-tiguous canonical format for common analysis read patterns at representative process counts, again using ADIOS/BP and NetCDF, respectively. Figure 6 shows the 2-D domain decomposition results. For these tests, the logically con-tiguous NetCDF approach is faster for essentially all tests. The explanation for this performance relates to the domain decomposition itself. This Chimera example has very little data on a per process basis, relying on a thin ‘pencil’ of data. This results in a data district that consists of 300 doubles, a mere 2400 bytes. When reading the planar areas or sub areas, all 7K or 16K data districts must be read in when using the log-based format for the plane across the domain decomposition demonstrating the need for additional opti-mizations for the log-based BP format. Another contribu-tor to the advantages observed for the logically contiguous NetCDF format is that HDF5 has buffering and caching for read operations. If the entire variable will fit into memory, it is read by one process and then distributed using messaging. This test case also demonstrates why the contiguous format was favored in the past: 2-D simulations and analysis were more prevalent. Unfortunately, this is no longer the case, as 3-D simulations now largely prevail.
The notion and use of data districts directly reflect the im-portance of 3-D domain decompositions. Specifically, while 2-D domain decompositions divide data into full extent ‘pen-cils’ of the entire domain, 3-D domain decompositions di-vide the domain into blocks and assemble them in a 3-D pattern to yield the entire simulation space, motivating the ‘dimensional’ or spatial nature of data districts. As process counts increase with a corresponding growth in the simu-lation space, fewer codes will be able to use a 2-D domain decomposition due to memory limitations. For these cases, a 3-D domain decomposition will be required.
Figure 7 shows the results for the extra large data model. The additional graphs did not add any different informa-tion and are omitted for space reasons. The full results are available in Gerald Lofstead’s dissertation [9]. Overall, data districts show superior performance for the 3-D do-main decomposition for all data sizes, process counts, and
tests. Again, by splitting the data into ‘dimensional’ chunks instead of using a single logically contiguous layout, fewer, larger reads can be performed to retrieve the data for all of the different patterns. Instead of performing many very small reads to obtain a plane, only the fragments that con-tain the planar pieces will be read, whereupon relevant data is extracted using in-memory operations.
5.2
Small Scale Results
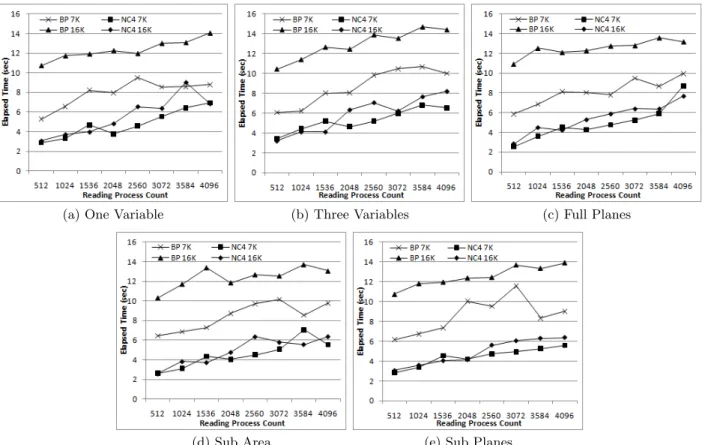
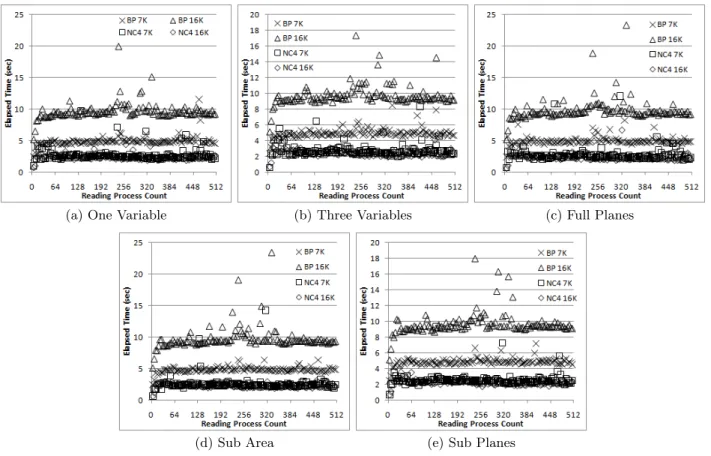
Some examples of the small scale results are presented in Figures 8 and 9.
For the 2-D domain decomposition, the small scale results mirror those attained with the large scale tests. For the 7K processes case, the performance of BP’s log-based data districts format is between a factor of 2×to 3×worse than that seen with the logically contiguous NetCDF format. For the 16K processes case, the performance worsens to a factor between 4×and 5×worse.
At a more detailed level, the 2-D results break down as fol-lows. For all tests, the logically contiguous NetCDF format performance is essentially identical for both the 7K processes and 16K processes data sets for all process counts. The log-based BP 7K processes set is 2×worse; the 16K processes set is 4×worse.
For the 3-D domain decomposition results, there is a bit more variation. For test 2 (all of 1 variable) as shown in Fig-ure 9(a), the log-based BP format performance for both 7K and 16K are essentially identical for all process counts. The performance is essentially identical for the small, medium, and large cases suggesting the observed performance is a minimum time required to perform this experiment. The much larger data size for the extra large test measures out to the peak performance for the file system at around 8 seconds to read all of the data. While the logically contigu-ous NetCDF format has worse performance in all cases, it is only slightly worse for small scale, with the performance degrading progressively as the data size increases.
For test 3 (all of a few variables) shown in Figure 9(b), the performance for the log-based BP format follows the same characteristics with the small, medium, and large cases hav-ing essentially identical performance, around 3.5 seconds, with the extra large taking longer at around 13 seconds. The logically contiguous NetCDF format again is worse in all cases. For the small data model, it is roughly 3×worse and performance progressively degrades from there.
Test 4 (a full plane in each dimension) shown in Fig-ure 9(c), is more interesting. For the small and medium data models, both the logically contiguous NetCDF and the log-based BP formats are essentially the same performance. For the large data model, the logically contiguous format is 2×worse than the log-based format. For the extra large model, the log-based format has worse performance by a fac-tor of about 1.6×. If the more detailed data were available, it is likely the additional reads for the pieces are the prob-lem. Do note that as the number of readers increases, the
(a) One Variable (b) Three Variables (c) Full Planes
(d) Sub Area (e) Sub Planes
Figure 6: 2-D Reading Performance
(a) One Variable (b) Three Variables (c) Full Planes
(d) Sub Area (e) Sub Planes
time for the based format stays nearly flat while the log-ically contiguous time grows passing BP at 2048 processes and continues to grow rapidly from there.
Test 5 (a rectangular subset) shown in Figure 9(d), shows similar characteristics to tests 2 and 3 (Figures 9(a) and 9(b) respectively). The performance for the log-based BP format is essentially constant for small, medium, and large data sets with a longer time for extra large. The logically contiguous NetCDF format starts nearly the same for small data and grows progressively worse as the data size increases.
Test 6 (a sub plane in each dimension) shown in Fig-ure 9(e), is more interesting. For the small, medium, and large cases, the performance for the log-based BP and the logically contiguous NetCDF formats is essentially identi-cal. For extra large, the log-based format 7K performance is about 1.1×worse than the logically contiguous format. The 16K processes performance for the log-based format is better than both at about 0.6× as much time. As is the case with test 4 (a full plane in each dimension) shown in Figure 9(c), as the number of readers scales, the perfor-mance reverses. In this case, it happens much sooner at 512 processes and the logically contiguous format performance degrades more slowly as reading processes are added.
6.
DETAILED DISCUSSION AND
ANALY-SIS
Examination of the performance for both the large scale and small scale experiments, for the 2-D and 3-D domain decompositions, sheds light on important considerations for both writing and reading performance. To recap the phys-ical distribution of the data sets on disk, for all tests, the output is striped across 160 storage targets. For NetCDF, the stripe size is the default 1 MiB while it is adjusted au-tomatically by ADIOS to 4 MiB.
If the file system evaluated were SSDs, the performance would depend on the cost of an IO operation compared with the cost of transferring blocks of data. Since the ideal block-ing factor for an SSD can be very different from rotational media, the log-based format may end up with a similar num-ber of block transfers as the logically contiguous making the performance a wash. For writing, the very dominant cost for the logically contiguous format is the coordination and data rearrangement within the compute area prior to any data moving to storage. This cost would not be mitigated by an SSD storage array. Overall, the end-to-end perfor-mance would still be superior for the log-based format for larger data, and in particular, 3-D domain decompositions. Overall, the variability of the results is relatively small. The standard deviation runs around 10% for all tests and generally did not exceed 25% for any of the tests.
These results have shown the importance of concurrency, separating performance concerns from portability, and ‘nat-ural’ file organizations. Each of these is explained in more detail below.
Concurrency is critical for high IO performance. Two factors affect the impact of concurrency on IO performance. First, the amount of data located on a single storage target determines how much data can be accessed at one time. Wider spread of data implies more concurrency in access, but of course, each storage target can only service one client at a time as disk drives are serial access device. The goal, therefore, is to balance these two factors so that the largest number of storage targets can be employed for reading at one
time without overloading any target with too many requests that ultimately are serviced serially.
For the 2-D, 7K processes case for ADIOS/BP, the full plane of data test reads three planes: 112 data districts, 64 data districts, and 7168 districts (one set for each dimen-sion). For the 3-D 7K process runs for ADIOS/BP, the full plane of data test reads the three planes: 448 (28×16) data districts, 256 (16×16) data districts, and 448 (16×28) data districts. For the 2-D domain decomposition, reading 7168 blocks from 160 storage targets overwhelms the IO system resulting in poor performance. NetCDF can read all of the data at once and then distribute to the other processes. This one large read, even if it is done serially from a single stor-age target, is faster than the 7168 reads from all available storage targets. For the 3-D domain decomposition, the use of data districts reduces the number of blocks read to a manageable number across all patterns resulting in more consistent performance. Because NetCDF spreads the data according to the logical global array dimensions, this results in either many very small reads or in larger reads with poor relevant data density. In essence, the performance penalty seen by ADIOS/BP for 2-D is seen by NetCDF for 3-D, for similar reasons.
The stripe size also plays a role. For the 2-D case, ADIOS/BP only spreads the output from a process across 4 storage tar-gets compared with NetCDF’s 13. The reduced concurrency forced on ADIOS further impacts performance. For the 3-D case, again, the opposite is true. The size of the variables causes them to be striped across all of the storage targets. By using a larger stripe size, the number of requests to a single storage target is sharply reduced, improving response time.
Separate considerations of performance from portability.
Performance is strongly linked to file layout. Carefully siz-ing data accordsiz-ing to inherent buffer sizes and considersiz-ing the total data size to avoid interference can achieve better performance.
For the 2-D case, the failure to address the inherent buffer sizes, such as the 1 MiB chunk used in many disk caching systems, incurs the full overhead of locating the data for only a small amount of time spent reading it. In particular, because only 2400 bytes for any variable is written contigu-ously, the most data that can be retrieved when reading a data district is 2400 bytes. Conversely, by storing the en-tire variable contiguously, NetCDF’s single read pays the disk overhead only once (or a small number of times, if it is striped). In contrast, for the 3-D case, until the data per data district becomes enormous (128 MiB per data district, a total of 1 GiB per fragment), all reading patterns are the same or superior for the log-based approach. Even at the enormous size, once the process count grows, the advan-tage returns to the log-based approach. The advanadvan-tages for writing have been clear for a while. With this study, the advantages for reading, for an HPC and parallel file system environment, are apparent as well.
Choosing ‘natural’ file organizations.Sequential read pat-terns for scientific data do occur, but they are not the only patterns to consider. Scientific discoveries occur as the data is explored through analysis tools that use select portions of the data. More precisely, data is retrieved and analyzed in regions determined by the types of analysis being done rather than as an entire data set. By arranging the data in smaller blocks – as data districts – increased efficiency can
(a) One Variable (b) Three Variables (c) Full Planes
(d) Sub Area (e) Sub Planes
Figure 8: 2-D Small Scale Reading Performance
(a) One Variable (b) Three Variables (c) Full Planes
(d) Sub Area (e) Sub Planes
be attained for retrieving the data. In other words, it is no longer necessary to span the entire data storage, skipping large areas of unrequested data, just to get to another few bytes of relevant data.
For the 2-D domain decomposition, each data district con-tains just 2400 bytes (300 doubles). For reads that stay within those 300 doubles, performance is good. Once a neighbor in the other two dimensions is requested, however, one or more read operation(s) from somewhere else in stor-age is required. Unless all of the data can be read into memory and parceled out through messaging, many reads are required even for retrieving a small region. Therefore, for the 3-D domain decomposition with its local dimensions of at least 32×32×32 for the small data model, far more relevant data can be read in a single operation than in the contiguous layout. This natural organization is a key benefit of the data districts approach. In contrast, with NetCDF, traversing any dimension except for one will require seeking to different areas of the file to read a small amount of data.
7.
CONCLUSIONS AND FUTURE WORK
As HPC has moved through terascale into petascale com-puting, formerly efficient approaches for encoding data and performing IO must be revisited. In particular, the 3-D domain decompositions used by petascale simulation codes demand new approaches in how data is organized and for-matted for efficient storage on the parallel file systems used with petascale machines. To that end, benchmarks that ex-amine the end-to-end performance using this generated data are important. The six common reading patterns presented in this paper are based on the analysis and other reading tasks commonly performed on this data.
To show the importance of these tests, this paper de-scribes a log-based approach to data storage that organizes data as ‘dimensional’ data chunks, termed data districts, that can be efficiently and concurrently written to and read from the many storage targets such systems employ. The outcome is high end-to-end, i.e., write and read, perfor-mance for log-based data organizations, in addition to no-table improvements over the performance observed for con-tiguous encodings used by the standard file formats in cur-rent use, such as HDF5 and NetCDF, excepting only cases of 2-D domain decompositions with small variable sizes.
Future work with log-based formats should develop ad-ditional optimizations for 2-D domain decomposition, such as the use of aggregation networks to reduce the number of log records being read and written. Also of interest is the exploration of trade-offs for achieving improved read perfor-mance without unduly impacting that of writing, as partly addressed by data sieving [24]. Also of interest is a study of the impact of alternative in memory data layouts, in row major vs. column major order, on both writing and read-ing performance. Finally, it would be useful to investigate automated methods for data conversion and/or replication based on ‘downstream’ usage requirements, with methods that use asynchronous IO coupled with in-flight data ma-nipulation and data staging.
The results presented in this paper do not cover all of the different data organization techniques employed by petas-cale science codes. For example, adaptive mesh refinement (AMR) and non-uniform grid codes both have different data organizations both in memory and on disk. These evalu-ations and additional example read intensive benchmarks
should be developed to explore the performance of differ-ent IO layouts, organizations, and techniques for these and other data organizations.
Additional work with many of the same authors as this pa-per currently in submission further examines some of these topics by considering different data organization techniques for placing data on the Lustre storage targets and split-ting large data districts. It uses two of the six evaluation patterns, the full plane and the sub area, to measure the effectiveness of these new techniques. Further work will ex-amine doing collective-like partial aggregation of data to build larger data districts to address the shortcomings of the small data experienced in the 2-D case examined in this paper.
8.
ACKNOWLEDGEMENTS
The work in this paper is based on research supported in part by the Department of Energy under award num-ber DE-FC02-06ER25767, the Department of Energy under Contract No. DEAC05-00OR22725 at Oak Ridge National Laboratory, the resources of the National Center for Com-putational Sciences at Oak Ridge National Laboratory, by the National Science Foundation, under award number OCI-0852543, by the Los Alamos National Laboratory and the Institute for Reliable High Performance Information Tech-nology, under contract number 54515-001-07, and by Sandia National Laboratories under contract DE-AC04-94AL85000, a grant from NSF as part of the HECURA program, a grant from the Department of Defense, a grant from the Office of Science through the SciDAC program, and the SDM center in the OSCR office, and CPES in the OFES and OASCR office. We also thank the member compa-nies of the PDL Consortium (including APC, DataDomain, EMC, Facebook, Google, Hewlett-Packard, Hitachi, IBM, Intel, LSI, Microsoft, NEC, NetApp, Oracle, Seagate, Sun, Symantec, and VMware) for their interest, insights, feed-back, and support.
9.
REFERENCES
[1] The HDF Group. http://www.hdfgroup.org/. [2] Hasan Abbasi, Greg Eisenhauer, Matthew Wolf, and
Karsten Schwan. Datastager: scalable data staging services for petascale applications. InHPDC ’09: Proceedings of the 18th international symposium on High performance distributed computing, New York, NY, USA, 2009. ACM.
[3] Hasan Abbasi, Matthew Wolf, Greg Eisenhauer, Scott Klasky, Karsten Schwan, and Fang Zheng. Datastager: scalable data staging services for petascale
applications. InHPDC ’09: Proceedings of the 18th ACM international symposium on High performance distributed computing, pages 39–48, New York, NY, USA, 2009. ACM.
[4] Nawab Ali, Philip H. Carns, Kamil Iskra, Dries Kimpe, Samuel Lang, Robert Latham, Robert B. Ross, Lee Ward, and P. Sadayappan. Scalable i/o forwarding framework for high-performance
computing systems. InCLUSTER, pages 1–10, 2009. [5] John Bent, Garth Gibson, Gary Grider, Ben
McClelland, Paul Nowoczynski, James Nunez, Milo Polte, and Meghan Wingate. Plfs: A checkpoint filesystem for parallel applications.SC Conference, 0, 2009.
[6] L. Chac´on. A non-staggered, conservative,
∇sB˙ →= 0, finite-volume scheme for 3D implicit extended magnetohydrodynamics in curvilinear geometries.Computer Physics Communications, 163:143–171, November 2004.
[7] J H Chen, A Choudhary, B de Supinski, M DeVries, E R Hawkes, S Klasky, W K Liao, K L Ma,
J Mellor-Crummey, N Podhorszki, R Sankaran, S Shende, and C S Yoo. Terascale direct numerical simulations of turbulent combustion using s3d.
Computational Science & Discovery, 2(1):015001 (31pp), 2009.
[8] Henry R. Childs, Eric Brugger, Kathleen S. Bonnell, Jeremy S. Meredith, Mark Miller, Brad Whitlock, and Nelson Max. A contract based system for large data visualization. InIEEE Visualization, page 25, 2005. [9] Gerald F. Lofstead II.Extreme Scale Data
Management In High Performance Computing. PhD thesis, Georgia Institute of Technology, 2010. [10] Harry L. Jenter and Richard P. Signell. NetCDF: A
Public-Domain-Software Solution to Data-Access Problems for Numerical Modelers. InEstuarine and Coastal Modeling, Proceedings of the 2nd International Conference, edited by M. L. Spaulding, American Society of Civil Engineers, pages 72–82, 1992. [11] Jianwei Li, Wei keng Liao, Alok Choudhary, Robert
Ross, Rajeev Thakur, William Gropp, Rob Latham, Andrew Siegel, Brad Gallagher, and Michael Zingale. Parallel netcdf: A high-performance scientific i/o interface.SC Conference, 0:39, 2003.
[12] J. Lofstead, F. Zheng, Q. Liu, S. Klasky, R. Oldfield, T. Kordenbrock, K. Schwan, and M. Wolf. Managing variability in the io performance of petascale storage systems. InSC ’10: Proceedings of the Conference on High Performance Computing Networking, Storage and Analysis, New York, NY, USA, 2010. ACM. [13] Jay Lofstead, Fang Zheng, Scott Klasky, and Karsten
Schwan. Adaptable, metadata rich io methods for portable high performance io. InIn Proceedings of IPDPS’09, May 25-29, Rome, Italy, 2009.
[14] Jay Lofstead, Fang Zheng, Scott Klasky, and Karsten Schwan. Adaptable, metadata rich io methods for portable high performance io. InIn Proceedings of IPDPS’09, May 25-29, Rome, Italy, 2009. [15] Jay F. Lofstead, Scott Klasky, Karsten Schwan,
Norbert Podhorszki, and Chen Jin. Flexible io and integration for scientific codes through the adaptable io system (adios). InCLADE ’08: Proceedings of the 6th international workshop on Challenges of large applications in distributed environments, pages 15–24, New York, NY, USA, 2008. ACM.
[16] O. E. B. Messer, S. W. Bruenn, J. M. Blondin, W. R. Hix, A. Mezzacappa, and C. J. Dirk. Petascale supernova simulation with CHIMERA.Journal of Physics Conference Series, 78(1):012049–+, July 2007. [17] Arifa Nisar, Wei-keng Liao, and Alok Choudhary.
Scaling parallel i/o performance through i/o delegate and caching system. InSC ’08: Proceedings of the 2008 ACM/IEEE conference on Supercomputing, pages 1–12, Piscataway, NJ, USA, 2008. IEEE Press. [18] Milo Polte, Jay Lofstead, John Bent, Garth Gibson,
Scott Klasky, Qing Liu, Manish Parashar, Norbert
Podhorszki, Karsten Schwan, Meghan Wingate, and Matthew Wolf. ...and eat it too: High read
performance in write-optimized hpc i/o middleware file formats. InIn Proceedings of Petascale Data Storage Workshop 2009 at Supercomputing 2009, 2009. [19] Philip J. Rhodes, Xuan Tang, R. Daniel Bergeron,
and Ted M. Sparr. Iteration aware prefetching for large multidimensional scientific datasets. In
SSDBM’2005: Proc. of the 17th international conference on Scientific and statistical database management, pages 45–54, Berkeley, CA, US, 2005. Lawrence Berkeley Laboratory.
[20] Mendel Rosenblum and John K. Ousterhout. The design and implementation of a log-structured file system.ACM Transactions on Computer Systems, 10:1–15, 1991.
[21] S. Sarawagi and M. Stonebraker. Efficient organization of large multidimensional arrays. In
Proceedings of the Tenth International Conference on Data Engineering, pages 328 – 336, Houston, TX, USA, 1994. IEEE Computer Society.
[22] Steven W. Schlosser, Jiri Schindler, Stratos Papadomanolakis, Minglong Shao, Anastassia
Ailamaki, Christos Faloutsos, and Gregory R. Ganger. On multidimensional data and modern disks. In
FAST’05: Proceedings of the 4th conference on USENIX Conference on File and Storage
Technologies, pages 17–17, Berkeley, CA, USA, 2005. USENIX Association.
[23] Bianca Schroeder and Garth A Gibson. Understanding failures in petascale computers.Journal of Physics: Conference Series, 78:012022 (11pp), 2007.
[24] Rajeev Thakur, William Gropp, and Ewing Lusk. Data sieving and collective i/o in romio. In
FRONTIERS ’99: Proceedings of the The 7th Symposium on the Frontiers of Massively Parallel Computation, page 182, Washington, DC, USA, 1999. IEEE Computer Society.
[25] Tiankai Tu, Charles A. Rendleman, Patrick J. Miller, Federico D. Sacerdoti, Ron O. Dror, and David E. Shaw. Accelerating parallel analysis of scientific simulation data via zazen. InFAST’10: Proceedings of the 8thth conference on USENIX Conference on File and Storage Technologies, pages 129–142. USENIX Association, 2010.
[26] Visit. http://www.llnl.gov/visit/home.html. [27] Baoqiang Yan and Philip J. Rhodes. Toward
automatic parallelization of spatial computation for computing clusters. InProceedings of the 17th international symposium on High performance distributed computing, pages 45–54. ACM New York, NY, USA, 2008.
[28] Fang Zheng, Hasan Abbasi, Ciprian Docan, Jay Lofstead, Scott Klasky, Qing Liu, Manish Parashar, Norbert Podhorszki, Karsten Schwan, and Matthew Wolf. Predata - preparatory data analytics on peta-scale machines. InIn Proceedings of 24th IEEE International Parallel and Distributed Processing Symposium, April, Atlanta, Georgia, 2010.
![Figure 1: Restart Writing Bandwidth for the Chimera supernova code [14]](https://thumb-us.123doks.com/thumbv2/123dok_us/1669881.2729440/3.918.481.837.375.610/figure-restart-writing-bandwidth-chimera-supernova-code.webp)
![Figure 2: Pixie3D Restart Reading Performance, Large Data Model, Half as Many Process Reading as Wrote the Checkpoint [18]](https://thumb-us.123doks.com/thumbv2/123dok_us/1669881.2729440/4.918.509.804.79.350/figure-pixie-restart-reading-performance-process-reading-checkpoint.webp)