Report EUR 25783 EN 2 0 1 3
JM TERRES – L NISINI – E ANGUIANO
Forename(s) Surname(s)
Final report
Assessing the risk of farmland
abandonment in the EU
European Commission Joint Research Centre
Institute for Environment and Sustainability Contact information
JM TERRES
Address: Joint Research Centre, Via Enrico Fermi 2749, TP 266, 21027 Ispra (VA), Italy E-mail: [email protected]
Tel.: +39 0332 78 9000 http://mars.jrc.ec.europa.eu/ http://www.jrc.ec.europa.eu/
This publication is a Reference Report by the Joint Research Centre of the European Commission. Legal Notice
Neither the European Commission nor any person acting on behalf of the Commission is responsible for the use which might be made of this publication.
Europe Direct is a service to help you find answers to your questions about the European Union Freephone number (*): 00 800 6 7 8 9 10 11
(*) Certain mobile telephone operators do not allow access to 00 800 numbers or these calls may be billed.
A great deal of additional information on the European Union is available on the Internet. It can be accessed through the Europa server http://europa.eu/.
JRC78131 EUR 25783 EN
ISBN 978-92-79-28281-2 (pdf) ISSN 1831-9424 (online) doi:10.2788/81337
Luxembourg: Publications Office of the European Union, 2013 © European Union, 2013
Reproduction is authorised provided the source is acknowledged Front page picture: courtesy of SOLAGRO
1
Acknowledgement
This report was prepared by JM Terres with the support of L Nisini and A Wania from the MARS unit of the Institute for Environment and Sustainability, Joint Research Centre (JRC), European Commission.
Some parts of this report such as the identification and definition of relevant drivers of land abandonment and the establishment of the supporting expert panel are based on previous worked carried-out by E Anguiano who initiated this study (unfortunately for us ) but moved to DG AGRI before the end of the project.
Contributions in terms of suggestions and feedbacks have been gratefully received from M Ambar, A Buckwell, A Coppola, E Corbelle, K Hart, H Kallstrom, A Gocht, P Pointereau, D Strijker, L Vranken, A Zobena, as members of the expert panel set-up by the JRC for this study. Data from the Farm Accountancy Data Network have been kindly and swiftly provided by DG AGRI.L3 unit (micro-economic analysis) under a signed agreement between DG AGRI and JRC [ARES(2012)105995]. Many thanks to T Vard and J Lazzaoui for their advices and suggestions on the use of FADN data.
The authors would like to express their sincere gratitude to L. Visek from DG AGRI.G1 for his guidance and the good working relationships which took place along this project.
2 List of Abbreviations AA Administrative Arrangement AEI AEM Agri-Environmental Indicators Agri-Environmental Measure CAP Common Agricultural Policy
CI Composite Index
CLC Corine Land Cover
DG AGRI Directorate General for Agriculture and Rural Development DG ENV Directorate General for Environment
DG ESTAT Directorate General for Eurostat EEA European Environment Agency
EC European Commission
ESU EU
European Size Unit European Union
FA Factor Analysis
FADN Farm Accountancy Data Network FAO
FAS FLA
Food and Agriculture Organisation (United Nations) FARM Advisory Service
Farmland Abandonment FSS Farm Structure Survey GDP Gross Domestic Product
IRENA Indicator Reporting on the Integration of Environmental Concerns into Agricultural policy
JRC Joint Research Centre
LAU2 Local Administrative Unit (level2) LFA Less Favoured Area
MoU Memorandum of Understanding
MS Member State
NUTS Nomenclature des Unités Territoriales Statistique
OECD Organisation for Economic Co-operation and Development PCA Principal Components Analysis
PDO Protected Designation of Origin PGI Protected Geographical Indications
RD Rural Development
RDP / RDM Rural Development Programme / Rural Development Measure
FT Farm type
UAA Utilised Agricultural Area
AT Austria ES Spain MT Malta
BE Belgium FI Finland NL Netherland
BG Bulgaria FR France PL Poland
CY Cyprus HU Hungary PT Portugal
CZ Czech Republic IE Ireland RO Romania
DE Germany IT Italy SE Sweden
DK Denmark LT Lithuania SI Slovenia
EE Estonia LU Luxemburg SK Slovakia
3 SUMMARY
An expert panel of 12 European scientists in fields related to land abandonment (bio-physical / land suitability, farm structure, farm economics, land market, regional development, socio and economic factors in rural areas) and representative for the EU27 Member States were tasked to identify main drivers of farmland abandonment in Europe. Two sets of criteria for assessing the risk of farmland abandonment have been suggested as follow:
For low farm stability and viability
This was estimated through drivers on ‘low farm income’ (D2), ‘lack of investments on the farm’ (D3), ‘farm-holder’s age’ (D4), ‘farm manager qualifications’ (D5), ‘low farm size’ (D8),
‘commitments taken by farmers in specific management scheme’ (D9). For negative regional context
This was estimated through indicators on ‘weak land market’ (D1), ‘low population density and remoteness’ from market opportunities and services (D7).
Each of these drivers was calculated individually; an assessment was done to provide relevance and robustness of results, corresponding maps were produced.
The results suggested a first group of useful drivers (policy relevance, analytical soundness, data availability and robustness) composed of: ‘weak land market’ (D1), ‘low farm income’ (D2), ‘low density population and remoteness’ (D7).
The second group of drivers with ‘lack of investments on the farm’ (D3) and ‘farm-holder’s age’ (D4) were policy relevant but reliability was lower when using European datasets.
The third group of drivers (‘farm manager qualifications’ (D5), ‘low farm size’ (D8), and
‘commitments taken by farmers in specific management scheme’ (D9)) showed some deficiencies in analytical soundness and/or data reliability. They were not further used in the analysis.
In order to produce a risk indicator of ‘farmland abandonment’, composite indices (gathering several drivers into one value) were developed based on the normalised values of the individual drivers. The normalisation procedure was performed at two different levels: (a) EU27 level as an attempt to elaborate a risk index covering EU27 in an homogeneous manner; and (b) MS level. In the latter case, the assumption is made that one cannot compare, in absolute value, situations from MS having heterogeneous economic and structural developments of their agricultural sector (e.g. regions in new MS versus western European regions). Drivers were accordingly normalised for each MS separately.
For the composite indices, further analysis was done at NUTS2 level to found-out in those flagged with a higher risk of farmland abandonment the most occurring farm-types. It results that the higher risk occurs in areas with high proportions of permanent crops (in Mediterranean countries) or permanent grasslands (livestock farming systems).
4
Table of Contents
Summary ... 3
1 Introduction ... 7
2 Background and policy context ... 8
2.1 Development of agri-environmental indicators... 8
2.2 The indicator on Farm Land Abandonment (FLA) ... 9
3 Literature review: Characterisation of farmland abandonment ... 10
3.1 Scene setting ... 10
3.2 Risk of farmland abandonment: driving forces ... 11
4 Coordination of the expert panel for the risk of farm Land Abandonment indicator ... 17
4.1 Description of the expert panel ... 17
4.2 Proposed definition of ‘Farmland abandonment’... 20
4.3 Indicators review ... 21
4.4 Methodological factsheets for each selected criterion ... 22
5 Review process for European datasets to assess farmland abandonment ... 23
5.1 Farm Accountancy Data Network (FADN) ... 23
5.2 Farm Structure Survey (FSS) ... 26
5.3 Geo-spatial datasets ... 27
6 Methodological development, data analysis and results ... 29
6.1 Methodology for individual drivers ... 29
6.2 Data analysis and results (including maps) ... 29
D1: Weak Land Market ... 29
D2: Low Farm Income ... 35
D3: Low investment level in the farm ... 41
D4: Age of farm holder (>65 years) ... 45
D5: Low farmer qualification ... 48
D6: Previous trend of Farmland abandonment ... 51
D7: Remoteness / low population density ... 51
D8: Low farm size ... 57
D9: Farm enrolment in Specific Schemes ... 64
6.3 Methodology combining drivers into a Composite index ... 67
5
Normalisation at EU level ... 72
Normalisation at national level ... 77
7 Discussion ... 83
8 Conclusions ... 84
References ... 86
ANNEXE A: Drivers factsheets (drafted by the expert panel) ... 90
ANNEXE B: FACTSHEET AEI14 ‘Risk of Farmland Abandonment’ ... 114
ANNEXE C: List of Excel tables with results for each driver ... 125
ANNEXE D: Technical note on the feasibility of downscaling the Land Abandonment Analysis from level 2 to level 3 in the NUTS system... 126
7 1 INTRODUCTION
This report is the final deliverable of the Administrative Arrangement #AGRI-2011-0295 between DG Agriculture and Rural Development (DG AGRI) and the Joint Research Centre (JRC). Under this arrangement, DG AGRI entrusts the JRC with the execution of a research project entitled “Study on farmland abandonment”.
The purpose of this Administrative Arrangement (“AA”) is to provide technical assistance to ensure progress in the conceptual and methodological improvements of the indicator “Risk of Farmland Abandonment (FLA)” through carrying-out various tasks related to literature review, experts consultations, data collection and processing, data analysis, mapping and reporting. The final report incorporates all deliverables of the study, including:
The description of the updated methodology applied and related difficulties encountered;
The full results derived from the finalised methodology;
An ad-hoc technical report on the feasibility of downscaling the analysis from NUTS2 to NUTS3 level
8 2 BACKGROUND AND POLICY CONTEXT
2.1 DEVELOPMENT OF AGRI-ENVIRONMENTAL INDICATORS
The Cardiff European Council (June 1998) endorsed the principle that the environmental dimension should be integrated in all Community policies. It also stressed the importance of developing appropriate environmental indicators to assess the impact of different economic sectors – including agriculture – on the environment, and to monitor progress in integrating environmental concerns.
The Helsinki European Council (December 1999) adopted the strategy for integrating the
environmental dimension into the CAP. The strategy sets environmental integration objectives for water, land use and soil, climate change and air quality, as well as landscape and biodiversity, affirming that the preservation of natural resources is an essential element for the long-term sustainability of agriculture. In its conclusions, the Council requested a regular reporting on progress in integration, based on agri-environmental indicators.
The Göteborg European Council (June 2001) endorsed the conclusions of the Agriculture Council (April 2001) on environmental integration and sustainable development in the CAP, inviting the Commission to regularly monitor and evaluate the Council’s integration strategy, and calling upon the Commission to continue its efforts to further improve the set of agri-environmental indicators and to define the statistical needs for these indicators.
In response to the Council’s requests, the Commission issued two Communications. The second Communication [COM(2006)508 ] “Statistical Information Needed for Indicators to Monitor the Integration of Environmental Concerns into the CAP” elaborated further on the indicator concept and identified potential data sources and information needed to make the indicators operational. In December 2006, the "Agriculture and Fisheries Council" adopted Council conclusions that welcomed the progress made through the IRENA operation and gave a broad mandate to the Commission for continuing the work on the indicators along the lines proposed in
COM(2006)508, in close cooperation with the relevant institutions of the Member States. The primary aim of the system of agri-environmental indicators is to help fulfilling the Commission's information needs:
for the assessment of the impact of the agricultural policy decisions on the environment, so as to identify shortcomings in current measures and needs for new policy initiatives and, where appropriate, to improve the targeting and tailoring of the measures to local conditions,
concerning agri-environmental trends that may impact on natural resources and have implications for the environment and for other EU policy fields and
for the evaluation of the efficacy of the integration strategy, with a view to adjust and deepen it if necessary.
As a follow-up, a Memorandum of Understanding (MoU) for Agri-Environment Indicators (AEIs) was signed by DG AGRI, DG ENV, DG ESTAT, JRC and the EEA with the aim of establishing the basis for cooperation amongst the partners to develop, consolidate and maintain a coherent
9
system of indicators. A comprehensive assessment of the work carried out will be undertaken every three years, coordinated by ESTAT.
The partners to the Memorandum of Understanding have agreed to pool a number of skills and resources, contributing to:
(i) consolidating the selected set of 28 agri-environmental indicators listed in COM(2006)508 and extending their coverage to the new Member States;
(ii) Correcting the existing weaknesses that currently restrict the usefulness of certain indicators;
(iii) Establishing a permanent and stable arrangement needed for the management and long-term functioning of this indicator system.
2.2 THE INDICATOR ON FARM LAND ABANDONMENT (FLA)
Various concerns have been raised that reductions in EU support to agriculture and reforms of trade policy will lead to widespread land abandonment across the EU with negative environmental and social consequences. In fact, this case was made strongly during the 2003 reform process where, as noted by the European Commission1 some Member States considered that full decoupling of support from production could lead to several risks such as the abandonment of production, the lack of raw material supply for processing industries, or to social and
environmental problems in areas with few economic alternatives.
Moreover, the change of political system in central and eastern European countries from 1990 onward triggered the process of land privatization with the dismantling of collective farms. This may have led to land abandonment as (i) property rights were not always well established and (ii) many cases of co-ownership or unknown owner, leading to non-functioning land market. All these resulted often in high fragmentation and small size of agricultural plots and holdings, not allowing profitable and commercial farming to develop.
These changes in political situations raised the risk of Farm Land Abandonment and triggered its inclusion in the list of 28 agri-environmental indicators to be developed under the Memorandum of Understanding for Agri-Environment Indicators by DG AGRI, DG ENV, DG ESTAT, JRC and the EEA.
One should remind that the indicator on the risk of land abandonment has replaced the indicator on marginalisation developed during the IRENA operation. Thus, the approach has changed even if farmland abandonment is a phenomenon commonly associated with marginalisation as a potential outcome (Baldock et al, 1996 and Bethe et al, 1995).
1
10
3 LITERATURE REVIEW:CHARACTERISATION OF FARMLAND ABANDONMENT 3.1 SCENE SETTING
Land abandonment has long been a contentious issue within Europe (for example see Pointereau et al, 2008; Brouwer et al, 1997; Baudry 1991). In part, as noted by Keenleyside and Tucker (2010) and others, this is because it has proved difficult to define, measure and study. For example, Moravec and Zemeckis (2007) note that there is no single definition of the terms “land abandonment” or “abandoned land”, with different interpretations between each legal or scientific text. The lack of consistent measurement across the EU means the current extent of abandonment is not known (Pointereau et al, 2008). However, whilst the exact extent may not be documented, it is clear that substantial areas of the EU have been affected by agricultural abandonment, however defined. This is largely a result of declines in the viability of extensive (low input) and small-scale agriculture systems (Baudry, 1991; Pinto Correia, 1993).
As summarized by the FAO, the reasons for abandonment of land are multidimensional and can be differentiated as follows: natural constraints, land degradation, socio-economic factors, demographic structure, and institutional framework (FAO, 2006, p2). Whatever the cause, abandonment is of concern to policy makers and others because of its negative social, economic and environmental associations (Moravec and Zemeckis, 2007). For example, in southern Europe a major environmental concern is the fire risk associated with abandoned land. In more northern and central parts of Europe, loss of farmland biodiversity is seen as a key environmental concern (see for example Baudry, 1991). More broadly, land abandonment is intimately linked with the wider issue of rural depopulation, whereas in Eastern Europe, widespread abandonment was associated with the transition process (Keenleyside et al 2005).
Whilst land abandonment is often viewed negatively, it is not always clear that land abandonment is detrimental. For example, in terms of nature conservation, Keenleyside and Tucker (2010) note: “In many circumstances abandonment may be damaging as it will threaten a range of semi-natural habitats and associated species of nature conservation importance, many of which are
concentrated in Natura 2000 sites and other High Nature Value (HNV) farmland. But in some locations, abandonment could be highly beneficial, particularly in highly fragmented landscapes and where it could provide the opportunity for significant large-scale restoration of
non-agricultural habitats (e.g. re-wilding).‟ (Keenleyside and Tucker 2010 p1)
As related by Renwick et al (2011), there is a fear that agricultural and trade reforms will reduce the economic viability of farming in Europe and lead to further abandonment of the more
marginal agricultural areas. A number of studies have attempted to analyse the issue of land use under a range of future scenarios. The results of these studies suggest that there is likely to be significant levels of farmland abandonment in Europe over the next 20 to 30 years. In general, the highest projected levels of abandonment are simulated for scenarios that anticipate high levels of global competition in agriculture, and low levels of CAP support for extensive farming. However, still significant abandonment is also projected under scenarios with reduced global
competitiveness, high levels of support for agriculture and the environment and strong regulations. Consequently, this is likely to call for some policy response.
11
Existing model projections are constrained by available data and uncertainty over future socio-economic developments and policy decisions (Renwick et al, 2011). The models are also deterministic and assume that land owners take decisions primarily on the basis of economic signals with little time lag. In reality it is clear that landowners will often continue uneconomic farming (by supplementing incomes in other ways) for a variety of social and cultural reasons (Renwick and Revoredo-Giha, 2008). On the other hand, some factors not directly included in the scenarios may result in underestimation of abandonment such as the effects of on-going natural constraints, rural depopulation and climate change.
3.2 RISK OF FARMLAND ABANDONMENT: DRIVING FORCES
Once the preliminary definition is established, the objective is to evaluate the risk of farmland abandonment. The methodology is not based on reporting on past or current situations but on the probability of occurrence. The objective is to analyse the leading causes more than getting a picture of the farmland already abandoned. Methodologies based on e.g. the UAA decrease have shown their limitations (see JRC report EUR 23411EN-2008) when the estimate of the risk of FLA was based on the continuation of an observed trend. Nevertheless, outcomes of this report could be useful to validate the final set of driving forces. To carry out a risk assessment exercise, the main determinants of the farmland abandonment must be identified. In addition, related indicators must be built to assess trends and provide an early warning.
As land abandonment is a complex multi-dimensional process with interlinked economic,
environmental, social aspects, the task to find out a simple and realistic method to elaborate a set of indicators addressing the risk of farmland abandonment is not straightforward. Moreover, much of the political significance of change in land use derives from local context and there is no clear-cut division among factors which could affect FLA; as it rather depends on the result of their interactions (Coppola, 2004; Bethe and Bolsius, 1995). Consequently, it is proposed to consult a group of experts on this topic with the objective to identify the weight and the thresholds to be given to the sub-indicators.
The issue of FLA carries a different weight and different drivers in individual countries and also within each country. In Western Europe, the problem tends to be minor, or even negligible; while in southern and Eastern Europe it is more important (Moravec and Zemeckis, 2007). It should be acknowledged that the phenomenon of farm land abandonment can evolve rather quickly,
especially in the new EU Member States. For instance, their integration in the EU has brought important changes in the socio-economic situation of their rural areas through the implementation of EU policies such as agriculture, but also the regional, structural and social instruments. On top of these, there are some global drivers influencing food, biomass (energy or other) and land demands which may change the current picture of land-use very quickly.
But even if the scale of the phenomenon (size, proportion) varies between regions and countries, potentially influencing the definition of the land abandonment or the political importance given to the issue, examples have shown that land abandonment can occur everywhere even in areas with good yield potential, and even in a satisfying general economic situation (Strijker, 2005).
12
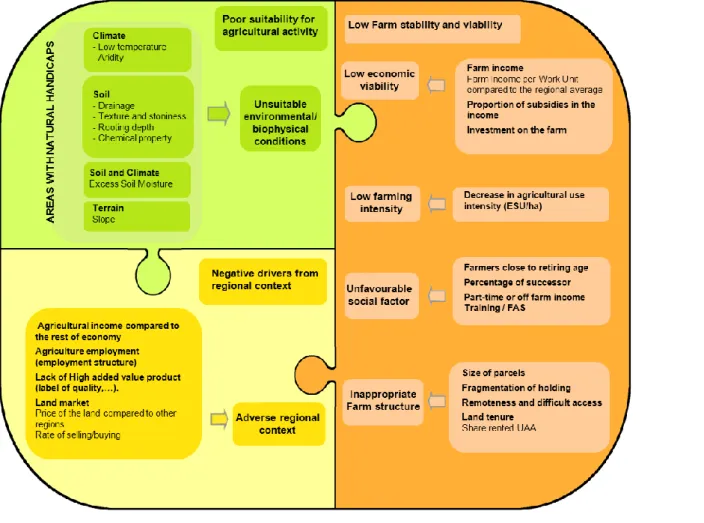
The literature review shows recurrent determinants of farmland abandonment which we can classify into three blocks:
(i) Block1: Poor environmental / biophysical suitability for agricultural activity
DG AGRI proposed to use the set of bio-physical criteria established by the JRC2 to support the delimitation of areas with significant natural constraints (new delimitation) as a starting platform for the designation of areas at risk of farmland abandonment before refining the picture with socio-economic indicators.
Compared to the current LFA scheme (art.19 of the Council Regulation No 1257/1999), it offers the advantage to be methodologically consistent at the EU scale (current art.19 entails differences at MS level in the indicators used for LFA delimitation, high variability of LFA coverage between countries, etc.) and it addresses only the environmental and biophysical aspects (while art.19 includes also socio economic factors) which will give more flexibility in the risk assessment. It must be stressed that, in June 2009, the Council recognised the biophysical criteria proposed by the Commission for future LFA designation and Member States were invited to carry out
simulations and apply the appropriate fine-tuning in order to refine the new delimitation of intermediate LFAs. Moreover, the Commission tabled in Oct. 2011 the legal proposal for Rural Development policy (2014-2020 period) which includes the list of bio-physical criteria for newly delimiting areas with natural constraints. This exercise is on-going and final results will serve to improve the indicator.
(ii) Block2: low farm stability and viability
The main determinant regarding the farm viability is its economic situation. Farmland is typically abandoned as an economic resource when it ceases to generate an income. Although this is not a sole cause, and although it can be triggered by a number of factors (described in/by the other indicators), there is a strong link and farm income plays a prominent role in the farmer’s strategy regarding land use. According to the FADN report 20083, holding's income is measured by estimating the Farm Net Value Added (FNVA), which represents the remuneration of all production factors (land, capital and labour). It is obtained by deducting total intermediate
consumption (farm-specific costs and overheads) and depreciation from farm receipts (total output and public support). Thus, it represents the economic performance of the farms from which, for instance, wages, rents and interests still need to be paid and own labour and capital need to be remunerated. When expressed per annual work unit (AWU) it takes into account differences in the labour force to be remunerated per holding.
The IRENA indicator on Marginalisation considers that farming generates low profitability in areas where 40% of holdings have a Farm Net Value Added per Annual Work Unit
(FNVA/AWU) that is below 50% of the average FNVA/AWU of the region. However, in the agricultural sector, the rule of profit maximisation is not always true and it cannot be made
2 Definition and justification of criteria: http://agrienv.jrc.ec.europa.eu/lfa.htm 3http://ec.europa.eu/agriculture/rica/pdf/report_2008.pdf
13
reference only to strictly economic variables to explain Farmland abandonment (Coppola, 2004). Schmitt (1997, quoted by Strikjer, 2005) reminds also that farmers will only leave agriculture when their income becomes very low since there are many reasons for this as e.g. the strong preference for being a farmer or the lack of gainful alternatives for their land, machines, buildings, and labour.
The share of CAP subsidies in the income may be an indicator of instability considering that the holding can largely depend on EU support to maintain its activity. Even if premiums are based on a long term agreement, the assessment of the risk of farmland abandonment could be biased if a high share of farm income is based on subsidies. Some policy instruments ensure that farmers receiving public support will be less prone to abandon land when they carry a commitment on the land (e.g. famers committed for at least five years in the agri-environmental measures etc.). This was also confirmed by Renwick et al. (2011) through modelling various policy scenarii.
Investments on the farm could additionally be a relevant indicator of the farm dynamism, its adaptation capacity and forward-looking strategy. New investments are a signal of a medium/long term strategy and can be a proxy of the willingness to continue farm activity, while low level of investment might be indicating a farming activity in decline.
Less intensive use (Standard Gross Margin/UAA)4 of the land is one step toward marginalisation which may lead to farmland abandonment, as identified by Baldock et al (1996). However, extensive holding management is a farming system that can be economically viable. Thus, this sub-indicator should be understood in this context as the decrease of farming intensity, which will lead generally to a lower competitiveness and profits.
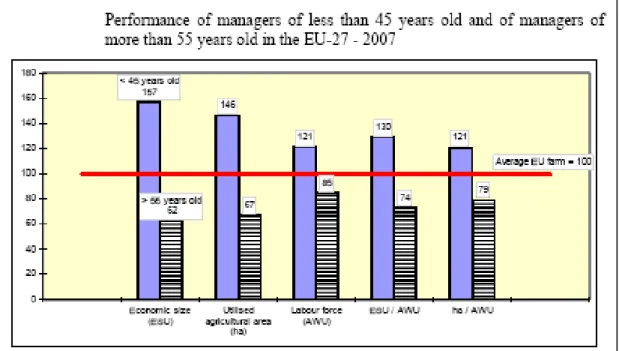
The agricultural sector is characterized by household farms and the productive activity is highly influenced by the life cycle of the farmer and of his/her family. Some studies (Kristensen et al., 2004) highlighted the relationship between farmer’s age and landscape changes. In particular, other factors being constant, farmland extensification and abandonment are more likely to occur when the farmer is old and close to retirement. The number of farmers nearing retiring age may reflect the expected transition of the land and its structure in a period of 10 years (Baldock et al, 1996). Additionally, the proxy can become more significant if the information about succession is known (percentage successor farmers). Potter and Lobley (1996) identified a direct effect in farm management. The investment indicator could, in this regard, be a proxy in succession probability. Moreover, if the holding has a low economic viability and inappropriate structure, the succession possibility will be low. That would be especially true if there are other working opportunities in the area. Alternative employment opportunities in other sectors, as well as low proportion of full-time farms are factors which increase the probability of abandonment (Rickebusch et al, 2007). Trends in these issues will indicate a change in the farming activity and in land use. There could be areas with a well-established and stable system where farmers could be part-time employed in other sector. For instance, in its analysis of marginalization in Denmark, Bethe and Bolsius (1995) stressed that part-time was often a necessity although this criterion was given a low weight.
4 The Standard Gross Margin (SGM) is the difference between the standardised monetary value of gross production and the standardised monetary value of certain costs.
14
Training, information and advice are important to be able to adapt to changing socio-economic circumstances (Baldock et al, 1996). According to Dellapasqua (2010 – personal communication), the risk of land abandonment decreases with the increase in the level of education/training and use of advisory services. Equally, the literature suggests that to maintain and/or achieve a sustainable land use that is adapted to the specific regional conditions, a thorough training of agricultural advisors is particularly required (Mishra et al, 2010). The advisory training should incorporate the promotion of appropriate environmentally friendly farming techniques. In some examples (e.g. Ireland), MS have introduced educational voluntary schemes with the stated objective of protecting against land abandonment. Farmers' training levels are highly variable between Member States. Many farmers do not have the skills necessary to take advantage of the potential of the new environment for innovation, provision of environmental services, diversification, and development of local services or bio-energy production. These shortcomings can increase the risk of land abandonment. An effective advisory system could lead to better farming strategies and higher managerial skills. In other words, it could contribute to the farm stability and its
development on the mid and long term.
Farm “physical” structure can also be a handicap in farm viability. As it has been mentioned before, it can constitute an obstacle to succession, especially in new EU MS. At the farm level,
small parcels, far (distance) from the farm are more likely to be abandoned than those well
accessible and large plots, due to high transportation and labour costs. Farmers of small or medium size parcels of land are more likely to have difficulties to access to certain production inputs, formal credit and other institutional services required to increase competitiveness. Extreme
fragmentation of the holding is also an indication of an inappropriate farm structure related to higher cost management. Low parcel size could also reduce the capacity of adaptation.
Finally, the land tenure could influence the investment and holding dynamism if a long-term perspective is not ensured. A large proportion of tenant-farmed agricultural area can indicate a tendency of instability; however this should be seen in a regional/national context as property laws and local usage varied a lot from MS to MS and play a strong role.
(iii) Block3: negative drivers from regional context
At regional level, an imbalanced economic development between sectors (agriculture, industry, services) may be source of transfer of labour forces. Risk of farmland abandonment may increase when the agriculture income is substantially below that of the rest of the economy (regional income). This tendency would be reinforced with the increase of opportunities outside the
agricultural sector.Therefore,the evolution of the employment structure (% of people employed in the agricultural sector) could be a good proxy. A relative low value added per agricultural worker is a strong incentive to leave agriculture for a better job, which seems to be geographically not too far away. This should be seen in combination with the re-structuring process of the
remaining farms, i.e. if the remaining farms are not increasing their size, there is a risk of land abandonment. While proximity of urban centres makes it possible to combine farm-work with a second job (so continuation of farming through part-time work), a long distance leads to higher risk of land abandonment (Terluin et al., 2010).
External factors such as labels for quality products could have positive effect on the stability of farming activity. If Baldock et al (1996) stated that Protected Designation of Origin (PDO)
15
allows producers to increase their income, the study on the Evaluation of the CAP policy on PDO and Protected Geographical Indications (PGI) stressed that the selling price can be better but sometimes production costs are also higher (London Economics, 2008). Nevertheless, producers of PDO/PGI located in remote areas see greater benefits of the scheme in terms of visibility, profitability and reputation of their business and small producers of PDO/PGI see a greater impact of the scheme in terms of the stability of their business. Some PDO/PGI products require specific farming practices linked to land-use management and therefore a link can be established between labelled products and the maintenance of specific (traditional) landscapes (Gauttier, 2006;
Paracchini et al, 2011). Production of such products may be a key element to prevent land abandonment. Furthermore, production of high value added products stimulate development of collective marketing initiatives in developing communication with consumers. Conversely, Marescotti (2003) showed that (i) PGI/PDO products could be the result rather than the cause of the development of rural areas and (ii) the presence of PDO products can limit in some ways the intensification of the farm system.
However, the lack of recognised labels generally indicates a lower promotion of the agricultural product, less market opportunity and less farm stability.
In the IRENA operation, the price of the land was considered as a good additional indicator of marginalisation, as it expresses the demand for land. In case of marginalisation process the demand for land is low, usually corresponding to a lower land or rent price. Unfortunately, due to the inappropriate scale of the available data, it was difficult to draw concrete conclusions.
However, the prices of land and, in a broader sense, the land market are of the utmost
importance for the problem of farmland abandonment. Caian and Swinnen (2009) found that land transactions leading to an increase in land sales and rental prices, typically signals a high demand for agricultural land and hence a lower risk of land abandonment. Transition period in the new MS was accompanied by major changes in agricultural structure in most of these countries, generally involving the break-up of large collective or state farms and the privatization of land. The resulting smaller units typically faced considerable challenges including lack of equipment, limited access to capital, scarcity of advice and technical support, difficulties with markets and low levels of government support (Keenleyside et al, 2005). The FAO (2006) stressed that the transition countries face difficulties regarding land ownership (registration), insufficiently defined property rights, and the lack of operational land markets. This prevents the reconstitution of viable farming units through land consolidation. In Latvia, the land privatisation has caused a number of problems to land use and land management, given the large number of small farms. In Bulgaria, the law resulted in forced co-ownership (Vranken et al, 2004) as it imposes a minimum plot size of 0.3 ha. Because of the absence of any type of land market during this phase, parcels remained fragmented and led to a massive co-ownership situation. The forced co-ownership of many land parcels in Bulgaria creates imperfect property rights on land, inefficient land allocation among farm structures, and farmland abandonment. Vranken (2004) found that a higher percentage of plots are left uncultivated when co-owned and undividable by law. Even if there are obviously other specific determinants of farmland abandonment in new Member States (political and economic transformation, loss of export markets, reduction of domestic support and subsidy
16
arrangements, the dismantling of agro-food systems etc.) land property and land market are recognised to be important drivers.
Figure 1: Main determinants of farmland abandonment and inter-linkages
It is important to bear in mind that the three blocks described above are part of a global
framework that can influence the process of land abandonment. Food demand, economic growth, international trade and policies drive the demand of agricultural products (Bush, 2006) and have an impact on farmland use.
Finally, and in a longer run, climate change pressures may lead to further marginalisation of agriculture or even to the abandonment of agricultural land in some parts of the EU (Commission staff working document accompanying the white paper ‘Adapting to climate change: Towards a European framework for action’, 20095).
17
4 COORDINATION OF THE EXPERT PANEL FOR THE RISK OF FARM LAND ABANDONMENT INDICATOR
4.1 DESCRIPTION OF THE EXPERT PANEL
The selection process to constitute the expert panel has mainly considered three criteria:
Importance of the expert’s literature references (in the light of their experience and state of the art in their respective countries) or known experience in the field from previous works.
The expertise provided by the panel should cover all thematic components related to land abandonment. These are bio-physical characteristics and suitability of land, farm structure, farm economic, social factors, land market, regional development.
The experts should come from a range of MS representing the various geographical / economical / farming conditions present in EU27
Based on these three sets of criteria, we have selected a number of experts. The following list presents the experts (with information on their background related to farm land abandonment) that have agreed to actively contribute to the study.
Expert Organisation and background
Ambar Margarida
Educational background in “Agronomic Engineering” and is currently studying on “Territorial Management and Urbanism”. Her professional experience has been on land development for over 20 years as part of the technical staff in organisations under the Portuguese Ministry of Agriculture. As part of her regular work, she has been involved in several projects such as land consolidation, implementation of irrigation schemes and landscape development, frequently related to the execution of big public infrastructures (e.g. Alqueva dam). She was responsible for the national land consolidation service for over one year until the Ministry was reorganized. She was the Portuguese project manager for FARLAND project and is now part of the FACTS! Project Portuguese team. She has also been internationally involved in several fora, either in land-related networks or cooperating with other public bodies and also provided training on land issues in Macedonia and Ukraine. In particular, she has been involved in the creation of policy instruments related to land abandonment such as land banks, either in Portugal and in Lithuania, and she was the main person organising an international workshop about land abandonment that was promoted by the FARLAND Network in 2009, with the support of FAO - Regional Office for Europe and Central Asia and had participants from more than 20 countries.
18
Buckwell Alan
Country Land &Business Association, UK; then Institute for European Environmental Policy – London UK.
Previously Professor of Agricultural Economics at Wye College (now Imperial College London, Wye Campus). Throughout his career, his main interest has been the nature and effects of the Common Agricultural Policy. He has advised the agricultural committees of both houses of the UK Parliament, and also the European Parliament. In 1995/6 he was seconded to the think tank within the Agricultural Directorate of the European Commission. Main professional activity is to provide economic evaluation and ensure research input in policy design across agricultural, land use,
environmental, forestry and water policy and other issues.
From 1993-1996 he was President of the European Association of Agricultural Economists, and is President elect of the UK Agricultural Economics Society 2004/05. His role has been helping seek a more economically rational agricultural policy for the benefit of citizens, food consumers and producers. He challenges the CAP to devise better ways than in the past to deal with the trio of problems: market failures, missing markets, and market imperfections.
Coppola Adele
University di Napoli - Faccoltà di Agraria, Italy.
PhD degree in Agricultural Economics and Policy. Associate Professor at the
Department of Agricultural Economics and Policy, University of Naples Federico II. Main fields of the research are: planning problems and regional economics and policy; policy evaluation and public investment analysis; analysis of farm typologies in the Italian agriculture. Analysis of farm typologies has focused on identification of socio-economic factors explaining development patterns and farm persistence. Main economic and social factors which can affect land abandonment at macro, meso and micro level have been studied with a special focus on factors acting at the farm level. The role of agricultural policy in influencing both the path of land use and the speed of land abandonment processes has been analyzed.
Corbelle Eduardo
University of Santiago de Compostela
PhD in forestry by the University of Santiago de Compostela (ES). Specialized in monitoring and statistical modelling of land use changes using geographic
information systems and remote data. Among recently published work is Corbelle & Crecente (2012) "Multi-scale assessment and spatial modelling of agricultural land abandonment in a European peripheral region: Galicia (Spain), 1956-2004". Land use policy, 29 (3), 493-501.
Hart Kaley
Institute for European Environmental Policy, London, UK (since Oct 2007). Senior Fellow and Head of the Agriculture and Land Management programme, specialised in European policies which impact on the rural environment and has a good understanding of the implementation and impacts of these policies in different parts of the EU, including the implications for farmland abandonment, particularly in relation to HNV farming systems. She is actively involved in the debates surrounding the future of the CAP and work to develop a longer term rationale for agricultural policy, including developing a suite of policy measures that are oriented towards the delivery of public goods. She has also advised on the development of
agri-environment schemes to promote HNV farming in Serbia and Macedonia which have involved addressing the very immediate threats of land abandonment and in some cases needing to reintroduce extensive grazing to areas that have already been abandoned. Prior she was a Research Assistant at Kings College and Wye College, University of London.
19
Kallstrom Helena
Swedish University of Agricultural Studies, Department of Urban and Rural Development, Uppsala, Sweden.
MSc in agronomy, researcher and PhD in Environmental Communication (2008) ”Between comfort and solitude” concerns social conditions at farms in sparsely populated regions of Sweden, where farmland are continuously abandoned. She has also studied social sustainability at farms for Swedish Board of Agriculture and for The Federation of Swedish Farmers. Also works with qualitative methods in the research fields of rural sociology, anthropology and communication.”
Gocht Alex
Johann Heinrich von Thünen-Institut, Federal Research Institute for Rural Areas, Forestry and Fisheries, Germany, research fellow since 2004.
Studied at the Imperial College of the London University and worked for several years at the Institute of Farm Economics in Braunschweig developing a tool to stratify FADN data into farm groups for the modelling system FARMIS, a farm group model for the German agricultural sector and selected EU Member States. Since then, he has worked with the EU-wide modelling system CAPRI and is responsible for the
inclusion of a layer of farm groups based on FADN in the model. Completed his PhD in 2009 at the University of Bonn about methods of economic farm modelling and extended the farm group layer in CAPRI by including Farm Structural Survey (FSS) data in combination with FADN. He has further specialized in the quantitative analysis of agricultural and environmental policies in particular related to land use changes.
Moravec Jiri
Institute for Structural Policy (IREAS), Praha, Czech Republic.
Ph.D., lecturer Faculty of Environment, Purkyne University, Czech Republic. Contributor to the 6th Framework Programme project on Cross compliance and Land Abandonment.
Pointereau Philippe
Solagro, France. Agronomist from the ESA Purpan, leading the Agro-Environment department of SOLAGRO and co-ordinates the European research projects (BioBio, Biocore, Quessa) and studies with the IES/JRC, EEA and IEEP. His research interests cover the agro-ecology and the environmental assessment of farming systems. He developed the diagnostic system DIALECTE used by advisors at farm scale. He led the projects on Farmland abandonment and identification of High Nature Value (HNV) farmland in Europe under IES/JRC. He works with the French ministry of Agriculture on the evolution of the French agriculture and land use.
Strijker Dirk
University of Groningen, Cultural Geography, The Netherlands
Professor in Rural Development (the Mansholt-chair) since 2005, and vice-chair of the department of Cultural Geography at Faculty of Spatial Sciences of Groningen
University, The Netherlands. Has a Master degree in Agricultural Economics from Groningen University and a Ph.D. in Economics from the University of Amsterdam for a thesis on the influence of the EU agricultural policy on the spatial patterns of
agricultural production. He publishes on the economic and spatial aspects of agriculture and agricultural policy, on land use and land abandonment, and on the relations between agriculture, nature and rural development.
20
Vranken Liesbet
Division of Agricultural and Food Economics, Department of Earth and Environmental Sciences, KULeuven Belgium.
Professor in Bio-Economics and Policy, head of the Research Group
Society-Environment Interactions within the Division of Agricultural and Food Economics has a Master in Agricultural Sciences and a Phd in Economics, both from the Catholic Universtiy of Leuven. She is a specialist in studying land markets issues and
agriculturalreforms. She is well trained in quantitative skills and in analyzing economic data which led the publication of her work in international journals and dissimilation among international organisations (EU Commission, World Bank, FAO). She has been involved in various projects on land-related issues, including projects for the EU Phare-ACE program, for the FAO and the World Bank. She was a member of the core team which produced the recent study on “Review of the
transitional restrictions maintained by new Member States with regard to the acquisition of agricultural real estate” for DGMARKT, and co-author of the main report. Currently, Liesbet Vranken is participating in the FP7 project ‘Factor Markets’ in which she is doing research on the key developments and institutional framework of land markets in Europe.
Zobena Aija
University of Latvia (LU), Faculty of Social Science, Latvia
PhD in Sociology (1992), professor, Head of the department of Sociology, senior researcher at the Advanced Social and Political Research Institute (ASPRI) of the LU. Areas of expertise: Regional and rural development, social policy, social cohesion. Involved in project “Social Partnership for Anticipating Change in the Labour Market”, leading partner ITC ILO (2011)
4.2 PROPOSED DEFINITION OF ‘FARMLAND ABANDONMENT’
The expert panel coordinated by the JRC proposed the following definition: ‘Farmland
abandonment is a cessation of management which leads to undesirable changes in biodiversity and ecosystem services’.
Originally, FLA was seen as a loss of Utilized Agricultural Area (UAA) that has not been
converted into artificial zone or afforested (tree plantation). The non-agricultural land is no longer farmed for economic, social or other reasons (no alternative use) and is not included anymore in the crop rotation system. Depending on the environmental conditions, this abandoned farmland will gradually be covered by scrubs and trees. This concept represents the measurement of the phenomenon, not the risk; therefore the definition has to be changed to reflect the exact scope of the AEI 14 ‘Risk of land abandonment’.
Moreover, as the indicator will be used to assess the integration of environmental concerns into the CAP, it was necessary to steer the definition towards potential threats for the environment, which in this case, are linked to loss of biodiversity and ecosystem services.
The purpose of the indicator was clarified as it should address the risk of farmland abandonment (probability of occurrence), not the consequences of FLA or the extent to which FLA actually happens.
Additional conceptual information was reported by the experts:
Ecosystem services refer to the collection of four sets of services which are based on biodiversity, or life on earth. These services are the provisioning services (food, forest
21
products, fuel etc.), regulating services (for water, climate etc.), supporting services (soil formation, nutrient recycling etc.) and cultural services (aesthetic, spiritual etc.).
For abandonment to be of concern there must be some undesirable changes (usually loss) of at least one of these services which is not outweighed by any gain in other services. Not all loss of Utilized Agricultural Area will be associated with undesirable changes in these services, so not all loss of UAA will necessary mean ‘abandoned’.
Cultural and social dimensions (encompassing for instance the loss of employment) were proposed to be included in the definition (undesirable changes) but, since the objective has an environmental dimension, only reference to ecosystem services was kept. Nevertheless, social and cultural aspects could potentially be used as drivers for farmland abandonment.
The issue of soil sealing was discussed but this will be assessed by the indicator on land use change (AEI9) of the Memorandum of Understanding (MoU) for Agri-Environment
Indicators. AEI9 will focus on the percentage of the total area that has changed to artificial surfaces compared to a reference period. It is therefore not necessary to cover the soil sealing issue under the FLA indicator.
A first agreement on the time scale was reached: a period of 5 to 10 years for identifying FLA is proposed in order to discard short term market influences on land-use. Also this period should be in line with data availability and policy intervention frame.
4.3 INDICATORS REVIEW
From the initial list established from the literature review, the expert panel suggested most relevant factors and indicated priorities. This process includes the compromise between desirability and availability of data for the whole EU.
List of selected drivers:
Block2 “Low farm stability and viability” Farm income
Low investment in the farm Age of farm holder (> 65 years) Low farmer qualification
Remoteness and difficult access (this would better fit in the “adverse regional context” block) Low size of the farm compared to average of same farm type
Farm enrolment in specific schemes
Block3 “Adverse regional context” Weak land market
Previous trend of FLA (to be postponed when time series of farmland abandonment data will become available)
22
Opportunity outside the agriculture (better captured by remoteness, population density, unemployment)
High value added products (as the lack of PDO/PGI products may simply be due to intensive and profitable agriculture, not needing to add value to raw products).
4.4 METHODOLOGICAL FACTSHEETS FOR EACH SELECTED CRITERION
Experts have compiled a factsheet for each driver including definition, effect on the risk, calculation options and references. Factsheets were circulated for comments and approval from the panel.
List of prepared factsheet and author:
Criteria Expert in charge
Land market Liesbet Vranken
Farm income / regional average Allan Buckwell
Investment in the farm Adele Coppola
Average age on the farm Adele Coppola
Previous farmland abandonment trend Hans Wytrzens / P Pointereau Remoteness and difficult access Helena Nordstrom Kallstrom Size of parcels, farm/average in farm-type Margarida Ambar
Opportunities outside the agricultural sector Dirk Strijker
High value added product Aija Zobena
Farmer qualification DG AGRI (G1)
Farm commitment / Specific schemes (AEM …) DG AGRI (G1)
23
5 REVIEW PROCESS FOR EUROPEAN DATASETS TO ASSESS FARMLAND ABANDONMENT
Regarding data, there are no other options for the duration of the Administrative Arrangement than using existing sources (FADN, FSS, administrative data on the CAP, pan-European geo-spatial datasets) as there will be no time (and resources) to develop or collect new datasets.
5.1 FARM ACCOUNTANCY DATA NETWORK (FADN)
The Farm Accountancy Data Network (FADN) consists of an annual survey carried out by the Member States of the EU, which collect accountancy data every year from a sample of
agricultural holdings. The main objective of FADN is the evaluation of the income of agricultural holdings and the analysis of economic impacts of the CAP. DG AGRI is responsible for managing FADN at EU level.
Derived from national surveys, the FADN is the only source of micro-economic data that is harmonised (i.e. the bookkeeping principles are the same in all countries), which combines data on farm structure, input use and economic variables. The combination of such different variables in one data set is a key factor for linking different issues in agri-economic analysis. Holdings are selected to take part of the survey on the basis of sampling plans established at the level of each region in the Union. The survey does not cover all agricultural holdings in the Union but only those which due to their size could be considered commercial. The methodology applied aims to provide representative data along three dimensions: region, economic size and type of farming. The rules of the FADN are specified under EU regulations, but the data are collected by Member State organizations.
The aim of the network is to gather accountancy data from farms for the determination of incomes and business analysis of agricultural holdings. Currently, the annual sample covers more than 80.000 holdings (commercial farms above 1 ha). They represent a population of about 6.400.000 farms in the 27 Member States, which cover approximately 90% of the total utilized agricultural area (UAA) and account for about 90% of the total agricultural production of the Union. The information collected, for each sample farm, concerns approximately 1000 variables and is transmitted by Liaison Agencies.
The FADN database only includes ‘commercial’ farms beyond a certain economic threshold6 , which varies from one country to another according to the agricultural structure (the minimum size is currently 1 Economic Size Unit (ESU = a standard Gross Margin of €1200 in Bulgaria and 16 in Belgium, Netherlands, Germany and the United Kingdom). The threshold on the minimum size farm may lead to a certain under-representation of the smallest farms, which in the case of FLA may be an important issue. In addition, FADN is only statistically representative at NUTS 0, 1 and 2 levels. However, there are no other datasets available with such relevant variables at EU level.
6
There is a constant review of where to draw the line about what is a commercial farm. In principle it is one which provides most of the income for the farmer and his family. The line is drawn according to local circumstances.
24
An FADN data user agreement has been signed between DG AGRI and the JRC. Anonymous individual holding data selected by the JRC have been extracted and swiftly sent by DG AGRI.L3.
The following variables were requested and provided at holding level (however anonymously)
Table 1: FADN variables available for the study
Code DESCRIPTION Comment
A1 Region
A18 Organisational form A2 Sub-region
A24 Country
A27 Econ.size in EUR Calculated by DG AGRI (cf Typology Regulation) A28 General TF Calculated by DG AGRI (cf Typology Regulation) A29 Principal TF Calculated by DG AGRI (cf Typology Regulation) A3 Farm Number
A39 Less favoured Area The Netherlands do no provide data on LFA
classification (use of code 4) and LFA payments. They consider LFA not significant for the country. In Germany all the LFA farms have been classified under code 2 (LFA-Other than Mountain). This should not be the case any more for 2007 and following accounting years. A41 Altitude zone
A45 Environmental constraints Area (EC no 1257/1999 and 1698/2005)
e.g.: the majority of the UAA of the farm is located in a 'Natura 2000' area or in an area linked to the Directive 2000/60/EC (water).
F86 rent paid for land J112 Grant and subsidies
tot. on animal and prod.
SE005 Economic size in ESU SE025 Total Utilised Agricultural
Area
area in ha
SE030 Rented U.A.A. area in ha - In FR the share of rented area is high because farmers belonging to partnership may rent their own land to the company
SE035 Cereals area in ha
SE065 Other permanent crops area in ha SE071 Forage crops area in ha
SE110 Yield of wheat in q/ha - global ratio
SE120 Stocking density in LU/ha of forage area - global ratio. Please note that mountain area or other pasture outside the UAA of the holding are not taken into account in the denominator. Therefore the farms with few own forage area, but using a lot common land will have a high stocking density. The stocking density SE120 should therefore be interpreted with caution. It is possible to approach the use of common land through the variable A42 (Days of grazing outside UAA).
SE125 Milk yield in kg/cow - global ratio SE131 Total output
25
SE135 Total output crops & crop production
SE206 Total output livestock & livestock products
SE375 Rent paid Including the rent for buildings, quotas… See SE030. SE425 Farm Net Value Added /AWU Global ratio
SE408 VAT on investments It was considered preferable, for the purposes of calculating income, to treat this amount separately from the overall VAT balance. It is generally a large amount and has no connection with the year’s production. If it were taken into account in the VAT balance, it would distort the balance of subsidies and taxes on current operations.
SE516 Gross Investment on fixed assets
= Purchases – Sales of fixed assets + breeding livestock change of valuation
SE521 Net Investment
G94IG Agricultural land + buildings IG
G95IG Agricultural land IG Optional information G96IG Permanent crops IG
G97IG Land improvements IG Optional
G99IG Acq.costs, quotas, oth. right IG Optional information – Be cautions when comparing MS because if the quotas is attached to land, its value is recorded under G95
G100IG Forest (inc. stand. timber) IG G101IG Mach. + equipment IG
G103IG Investments before subsidy
SE622 LFA subsidies SYS02 Farms represented SYS03 Sample farms SYS04 Exchange rate YEAR Year
SE415 Farm Net Value Added
SE420 Family Farm Income This indicator is calculated for the whole farms including those without family labour
SE425D AWU FNVA/AWU denominator (= SE010)
SE425N Farm Net Value Added FNVA/AWU numerator (= SE415 where SE010 > 0) SE430 Family Farm Income / FWU This global ratio can be > 0 whereas SE420 < 0 because
it is calculated taking into account only the farms with FWU > 0
SE430D FWU FFI/FWU denominator (= SE015)
26
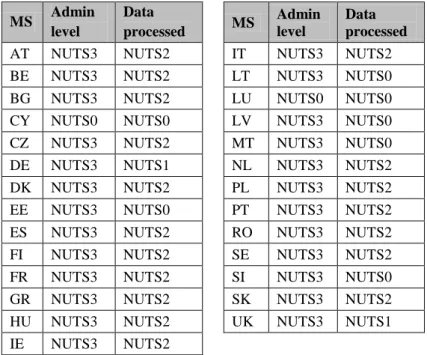
The geographic reference (Administrative unit) of the provided data can vary from MS to MS. Details are given in the table below.
Table 2: level of FADN data availability and processing by MS
MS Admin level Data processed MS Admin level Data processed
AT NUTS3 NUTS2 IT NUTS3 NUTS2
BE NUTS3 NUTS2 LT NUTS3 NUTS0
BG NUTS3 NUTS2 LU NUTS0 NUTS0
CY NUTS0 NUTS0 LV NUTS3 NUTS0
CZ NUTS3 NUTS2 MT NUTS3 NUTS0
DE NUTS3 NUTS1 NL NUTS3 NUTS2
DK NUTS3 NUTS2 PL NUTS3 NUTS2
EE NUTS3 NUTS0 PT NUTS3 NUTS2
ES NUTS3 NUTS2 RO NUTS3 NUTS2
FI NUTS3 NUTS2 SE NUTS3 NUTS2
FR NUTS3 NUTS2 SI NUTS3 NUTS0
GR NUTS3 NUTS2 SK NUTS3 NUTS2
HU NUTS3 NUTS2 UK NUTS3 NUTS1
IE NUTS3 NUTS2
‘Admin level’ refers to the lowest geographic administrative unit reference given in the FADN dataset for each holding. The table shows that this level can vary from MS to MS.
‘Data processed’ refers to the level of processing and reporting selected for the analysis. This level is a compromise between data availability, representativeness and targeted objective of reporting at NUTS2 level as stated in the specifications of this study.
In the case of DE and UK, despite data were provided with reference at NUTS3 level, it was agreed with DG AGRI.L3 to process and report results at NUTS1 level to ensure
representativeness of the sample.
For some MS (CY, EE, LT, LU, LV, MT, SI), data are processed at NUTS0 level because intermediate NUTS level 1 and 2 do not exist (they are geographically identical to NUTS0).
5.2 FARM STRUCTURE SURVEY (FSS)
The purpose of the FSS is to obtain reliable data, at regular intervals, on the structure of
agricultural holdings in the European Union in order to: Assess the agricultural situation across the EU; monitor trends and transitions in the structure of European farms (agricultural holdings); manage, evaluate and design the CAP in its environmental, economic and social aspects. FSS data is also used in other policy areas such as environment, regional development and climate change. FSS statistics provide harmonized data on agricultural holdings in the EU, including: Number of agricultural holdings, land use and area (crops), livestock, farm labour force (including age,
27
gender and relationship to the holder), economic size of the holdings, type of activity, other gainful activity on the farm, system of farming, machinery.
Two types of surveys are available:
(i) Every ten years, a full scope survey is carried out in the form of an agricultural census (The Agricultural Census 2010 is currently being carried out in the EU Member States and will be available for use in 2013);
(ii) Every 2 or 3 years, between the censuses, sample surveys are carried out and results are available only at NUTS2 or NUTS3 level, depending on MS (the last sample survey was carried out in 2007).
Survey results are representative only at NUTS2 level, which means that the variability of FLA within NUTS2 is lost. Consequently we aimed at census data so that the maximum spatial details can be kept. However, while the last census was done in 2010/2011 (depending on MS), data will only be available in 2013. Therefore the last census data currently available for this study are from 2000. It is then proposed to use this dataset (FSS 2000, depending on MS) to test the indicators and have a first assessment of the method and the results. An update will always be possible once FSS data for the 2010 census will be released.
DG ESTAT is responsible for managing FSS at EU level.
Despite several attempts to ESTAT to access micro-data (however anonymised), it was not possible to receive them. Consequently ESTAT has proposed to process those data according to the definition of the drivers and thresholds identified by the literature review and the panel of experts and to send the result only to the JRC.
Consequently, the following processing was requested to ESTAT: Percentage of farms with holders over 65 years of age by lowest geographical breakdown available
Results delivered in June 2011
Percentage of farms with UAA below 50% of the NUTS3 average holding UAA, by NUTS3 / LAU1 / LAU2 (lowest geographical breakdown available) and by farm-type.
Results delivered in December 2011 Percentage of farms with a UAA under 50% of the NUTS2 average
holding UAA, by NUTS3 and by farm-type.
Not delivered as of Nov 2012
5.3 GEO-SPATIAL DATASETS
In order to complete the analysis based on accountancy and statistical datasets, additional geo-spatial data are needed to compute geo-spatially explicit indicators of remoteness and low densely populated regions. The following data need to be mobilised:
For Travel time: EuroRegionalMap road network, Communes database (GISCO)
For Population density: SIRE database (2001, Eurostat) for population per commune and Corine Land-Cover (EEA) for the spatialisation
28
The Urban Morphological Zones derived from CORINE Land Cover 2000 and the disaggregated map of population density (source: EEA).
The administrative boundaries from the EuroBoundaryMap (EBM 2001 Census) database (scale: 1/100 000). Source: ©EuroGeographics.
EuroRegionalMap (ERM v2.2) database (scale:1/250 000) by ©EuroGeographics
The agricultural area used at LAU2 level for driver D7 was derived from CORINE Land-Cover 2006 (source: EEA) (http://www.eea.europa.eu/data-and-maps/data/corine-land-cover-2006-raster-2)
29
6 METHODOLOGICAL DEVELOPMENT, DATA ANALYSIS AND RESULTS 6.1 METHODOLOGY FOR INDIVIDUAL DRIVERS
This section describes the refined methodology taking into consideration some known data limitations, feedbacks from the expert meetings held at the JRC on 23-24th January 2012 and 13-14 September 2012, and also based on the JRC’s experience gained during the analysis.
In a first stage, economic drivers (D1, D2, D3) were computed to flag NUTS2 with “40% of the regional sample of observations below a certain threshold valued” (e.g. NUTS2 with 40% of their holdings with an income below the regional average farm income). However, the outcome was not satisfactory as it was providing information on the regional distribution of the observations rather than meaningful economic difficulties in these regions. A new methodology has therefore been applied to compute the weighted average estimator for each NUTS2 in EU27. The
calculation of the weighted average considered each holding with its weight. Weighting factors are available from FADN variable SYS02; they are the ratio of the number of farms in a cluster in the whole population to the number of farms included in the same cluster in the sample. A cluster is a group of farms belonging to the same farm-type, same economic size within a region (or group of regions).
Results are presented using 5 quintiles, having 20% of the distribution in each class. In doing so, there is not anymore absolute threshold for identifying a risk, but NUTS2 regions belonging to the fifth quintile are with a higher risk in relative terms. This approach was also chosen as it would allow the computation of the composite risk index (combining individual drivers) presented in section 6.3 of this report.
6.2 DATA ANALYSIS AND RESULTS (INCLUDING MAPS)
D1: Weak Land Market
Rationale:
Increase in land sales and rental prices are generally linked to a high incidence of land
transactions which typically signals a high demand for agricultural land and hence a lower risk of land abandonment. A weak land market has a negative effect on FLA.
Assessment and methodological improvement applied:
A regional average was done at NUTS2 level, except for DE, UK (NUTS1) and for CY, EE, LT, LU, LV, MT, SI (NUTS0). Aggregation at NUTS2 level means that all the holdings belonging to a NUTS2 are considered in the analysis of this NUTS2.
The FADN parameters ‘Rent paid, including rent for building, quotas …’ (var. SE375) and ‘Rented UAA’ (var. SE30) are used in a ratio to provide proxy information on the rental price of agricultural land. The weighted average is calculated for the 3 years (2006-2008) for each holding
30
in the database. Each holding of the FADN sample was considered with its weight; the weighting factor is represented by the FADN variable SYS02.
Some special cases where identified in the dataset. Based on information provided by DG AGRI.L3, they have been handled as follows:
The rented area is positive but the rent paid is 0: Member States often justify this case when the land is available for free (i.e. a family member is owner of the land). Rent considered = 0.
There is no land rented (SE030 = 0) but some rent is paid (SE375> 0). Then “no data” is attributed. These are cases of renting buildings or milk quotas.
Data screening showed that some MS or regions (Portugal, southern Spain, southern Italy, southern Greece, Romania) have a large percentage of records with an average rent equal to “zero” in the database (leading to high standard deviation) - Figure 3. This could be interpreted as a sign of low demand for land, hence possibly entailing land abandonment or, as suggested by AGRI.L3 officers responsible for FADN data, that farmers are renting land without payment (e.g. the owner is a family member). In the latter case, this could lead to biased conclusions.
Indeed, A Coppola (one of the members of the expert panel) suggested that when the land tenure model is mainly the ownership (in Italy for instance), results could be biased: other conditions being constant, the probability of land being abandoned is likely to be lower when the land is owned than when it is rented (consequently the share of rented / owned land has to be taken into consideration).
Results:
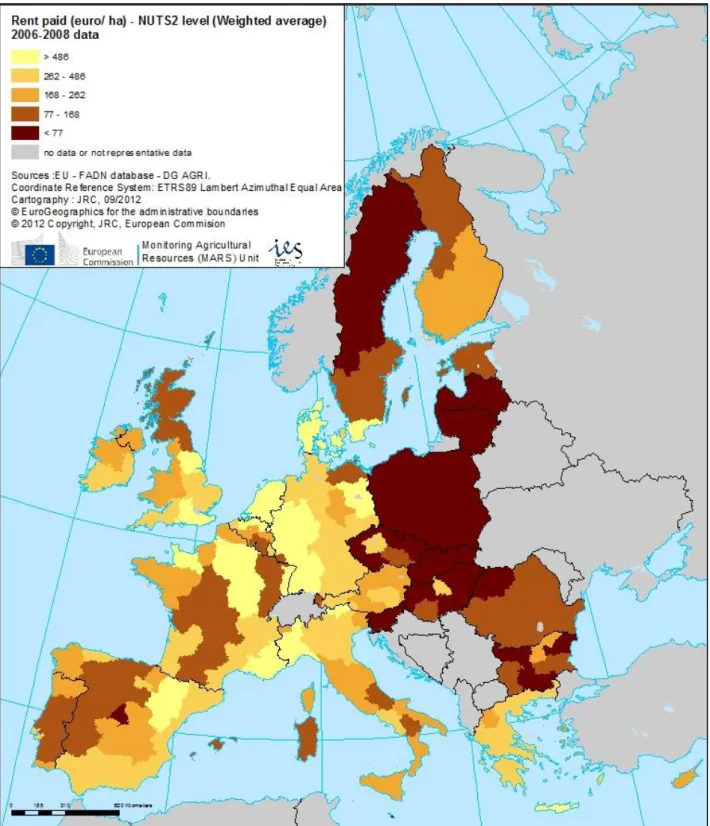
The main result is presented in Figure 2. Figure 4 shows the share of rented land to the total agricultural area (UAA). Results are classified in quintiles (20% of data in each of the 5 classes).