INTEGRATED QUALITY CONTROL PLANNING IN
COMPUTER-AIDED MANUFACTURING PLANNING
by Yihong Yang
A PhD Dissertation Submitted to the Faculty
of the
WORCESTER POLYTECHNIC INSTITUTE in partial fulfillment of the requirements for the
Degree of Doctor of Philosophy in
Manufacturing Engineering by
April 2007
APPROVED:
Yiming (Kevin) Rong, Advisor
Professor of Mechanical Engineering and
ABSTRACT
Quality control (QC) plan is an important component of manufacturing planning for mass customization. QC planning is to determine the operational tolerances and the way to control process variation for assuring the production quality against design tolerances. It includes four phases, i.e., tolerance stack-up analysis, tolerance assignment, in-process inspection design, and the procedure of error source diagnosis & process control. Previous work has been done for tolerance stack-up modeling based on the datum-machining surface relationship graph (DMG), machining error analysis, and worst-case/statistical method. In this research, the tolerance stack-up analysis is expanded with a Monte-Carlo simulation for solving the tolerance stack-up problem within multi-setups. Based on the tolerance stack-up model and process capability analysis, a tolerance assignment method is developed to determine the operation tolerance specifications in each setup. Optimal result is achieved by using tolerance grade representation and generic algorithm. Then based on a process variation analysis, a platform is established to identify the necessity of in-process inspection and design/select the inspection methods in quality control planning. Finally a general procedure is developed to diagnose the error sources and control the process variation based on the measurements.
Keywords: quality control planning, tolerance stack-up analysis, tolerance assignment, in-process inspection
ACKNOWLEDGEMENTS
It is my great pleasure to have this opportunity to thank people who have helped me during my dissertation and my study at Worcester Polytechnic Institute, Massachusetts. I wish to offer my sincerest gratitude to my advisor, Professor Yiming (Kevin) Rong, who is an outstanding advisor in all measures during my work with him. His professionalism, knowledge, and keenness inspired and taught me a lot.
True thanks to Professor Richard Sisson, Professor Chris Brown, Professor Samuel Huang and Professor Amy Zeng for their enthusiastic service on the committee. Also, I would like to extend my thanks to my colleagues in WPI CAM Lab, Mr. Nick Cumani, Dr. Xiangli Han, and Dr. Suqin Yao who helped me during the dissertation. Especially the author would like to thank Dr. Hui Song and Mr. Yao Zhou, who contributed a lot to this research work.
Special thanks should be given to my wife for her constant love and emotional support during my studies here, without which this work should not have been possible. I sincerely dedicate this dissertation to my wife.
Finally, I want to devote this work to my parents and my parents-in-law in China. It is their endless love that made me what I am today.
TABLE OF CONTENTS
ABSTRACT ……… II ACKNOWLEDGEMENTS ……… III TABLE OF CONTENTS ……… …… IV LIST OF FIGURES ……… VII LIST OF TABLES ……… X
Chapter 1: Introduction ……… 1
1.1 Problem statement ……… 1
1.2 Objectives and contributions………4
1.3 Technologies and approaches ……… …… 5
1.4 Scope ……… 7
1.5 Dissertation organization ……… 7
Chapter 2: Literature Review ……… 9
2.1 CAMP review ……… 9
2.1.1 Brief overview of CAPP ……… 9
2.1.2 Function of current CAPP systems ……… 10
2.1.3 CAMP for mass customization ………11
2.1.4 Limitations of present CAPP systems ………15
2.2 Tolerance analysis in CAMP ……… 15
2.2.1 Tolerance analysis methods ……… 16
2.2.2 Manufacturing error analysis ……… 20
2.2.3 Tolerance assignment ……… 22
2.3 Quality control planning ……… 25
2.3.1 Quality control planning in CAPP ……… 26
2.3.2 In-process inspection ……… 27
2.3.3 Statistical Quality Control (SQC) ……… 28
2.3.4 Failure Mode and Effects Analysis (FMEA) ……… 31
Chapter 3: Tolerance Stack-up Analysis for Production Planning ……… 34
3.1 The framework of computer-aided tolerance analysis system ……… 35
3.2 Tolerance stack-up model ……… 37
3.2.1 Inter-setup tolerance stack-up model ……… 38
3.2.2 Intra-setup tolerance stack-up model ……… 41
3.3 Simulation-based tolerance stack-up analysis ……… 44
3.4 Sensitivity study and output format ……… 52
3.5 Case study ……… 54
3.5.1 Case 1: A prismatic part ……… 54
3.5.2 Case 2: Bearing spindle ……… 58
3.6 Chapter Summary ……… 60
Chapter 4: Tolerance Assignment and GA Based Tolerance Optimization ………61
4.1 Tolerance assignment in CATA system ………61
4.2 Initialization of tolerance assignment based on economical tolerance IT …… 63
4.3 Tolerance assignment based on sensitivity analysis ……… 67
4.4 Tolerance assignment optimization based on generic algorithm ……… 69
4.4.1 Cost model ……… 70
4.4.2 GA technique ……… 73
4.4.3 Implantation and case study ……… 74
4.5 Chapter summary ……… 81
Chapter 5: Quality Control Planning in CAMP ……… 82
5.1 Process variation analysis ……… 83
5.1.1 Manufacturing error source analysis ……… 84
5.1.2 Critical dimensions and significant factors ……… 87
5.2 In-process inspection ……… 89
5.2.1 In-process inspection methods ……… 89
5.2.2 In-process inspection planning ………93
5.3 Statistical process control ……… 96
5.6 Chapter summary ……… 108
Chapter 6: System Implementation ……… 109
6.1 Framework of CAMP-R ……… 109
6.2 The feature-based part information modeling ……… 112
6.3 BOP representation ……… 115
6.4 Automated setup planning ……… 116
6.5 Cutter planning and chuck selection ……… 121
6.6 In-Process model generation algorithm and documentation ……… 123
6.7 Quality control planning ………124
6.8 Chapter Summary ……… 130
Chapter 7: Summary ………132
7.1 Contributions of the research ……… 132
7.2 Future work ……… 134
LIST OF FIGURES
Figure 1.1 Flowchart for automated setup planning ……… 3
Figure 2.1 Tasks of the CAMP of mass customization ……… 12
Figure 2.2 Tolerance analysis vs. tolerance allocation ………16
Figure 2.3 Procedure of Monte Carlo simulation for tolerance stack-up ………19
Figure 3.1 Flowchart of CATA system ……… 35
Figure 3.2 Inter-setup tolerance stack-up ……… 40
Figure 3.3 Intra-setup tolerance stack-up ………42
Figure 3.4 Cutting tool error ………43
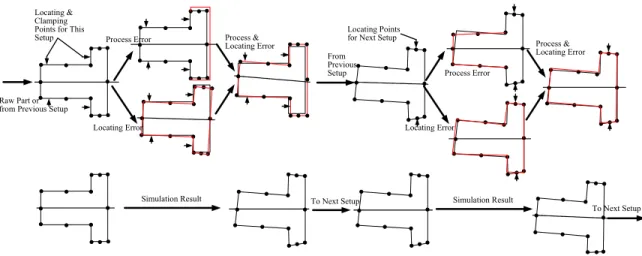
Figure 3.5 Simulation procedure for the inter-setup tolerance stack up ……… 44
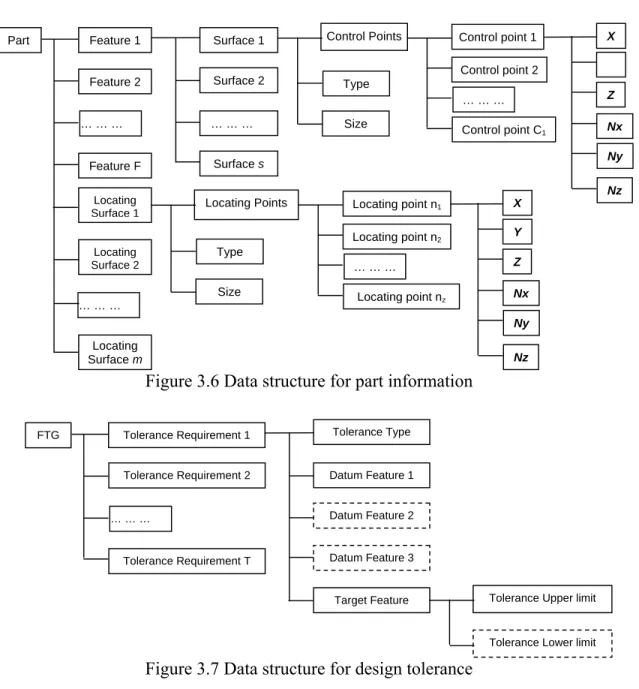
Figure 3.6 Data structure for part information ……… 45
Figure 3.7 Data structure for design tolerance ……… 45
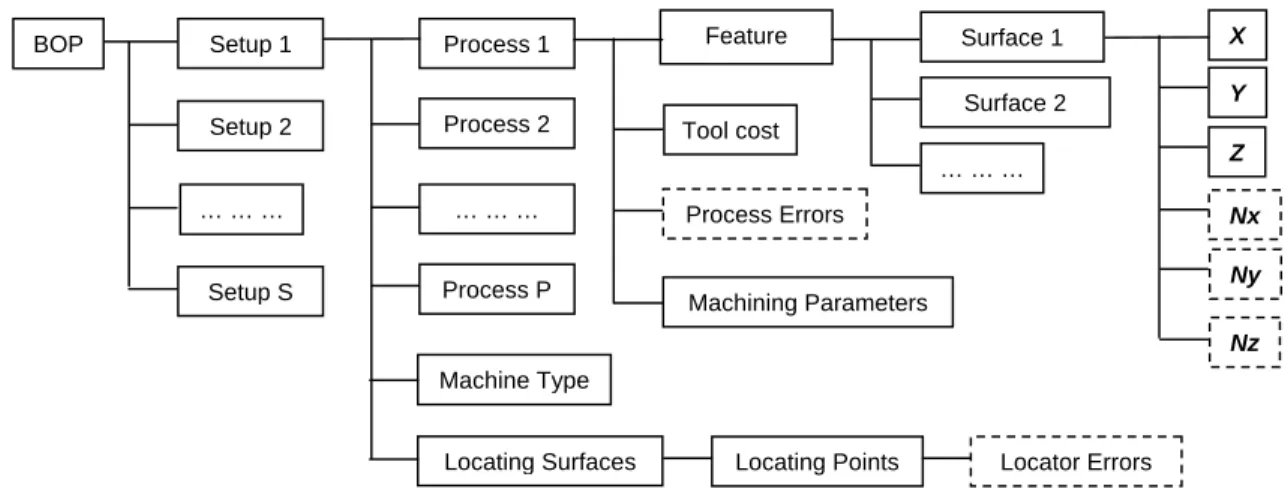
Figure 3.8 Data structure for setup/process information ……… 46
Figure 3.9 Control point deviation relative to the tolerance zone ……… 47
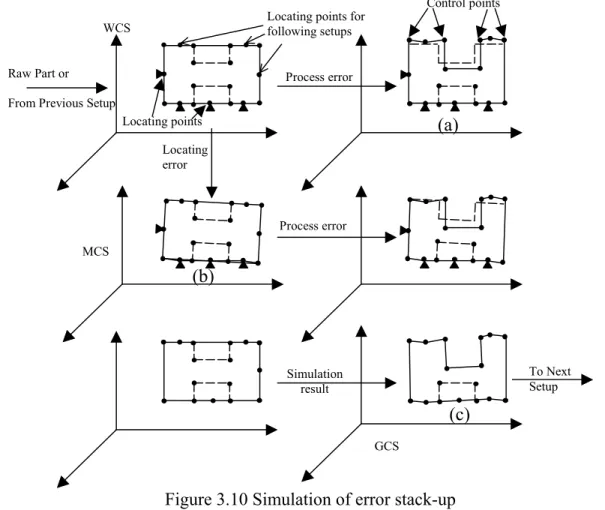
Figure 3.10 Simulation of error stack-up ……… 49
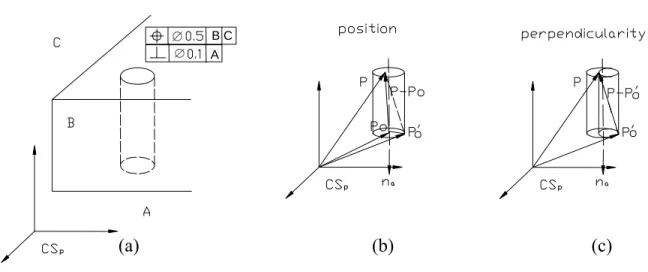
Figure 3.11 Illustration of position and perpendicularity of a through hole feature ………50
Figure 3.12 Control points selection for through hole feature ……… 52
Figure 3.13 Prismatic part for tolerance stack up analysis ……… 55
Figure 3.14 Simulation results of revised plan for feature 8. ……… 58
Figure 3.15 Bearing spindle design and feature/surface list ………58
Figure 3.16 Bearing spindle setup plan ……… 59
Figure 4.1 Tolerance assignment flow chart in CATA system ……… 63
Figure 4.3 Two-point crossover ……… 77
Figure 4.4 Cost of the best gene improves with increase of generation ……… 79
Figure 4.5 Average cost improves with increase of generation ……… 79
Figure 4.6 Evolution of selected process IT grades ……… 80
Figure 4.7 Evolution of selected process IT grades ………80
Figure 5.1 Flow chart of the quality control planning in CAMP system ……… 83
Figure 5.2 Chuck accuracy analysis diagram ………85
Figure 5.3 Two types of tool wear: flank wear (left) and crater wear (right) ……… 86
Figure 5.4 Relationship of tool wear with time ……… 87
Figure 5.5 Tolerance specifications of a bearing spindle in OP 50 ………88
Figure 5.6 Illustration of three inspection methods ……… 90
Figure 5.7 Process monitoring and control flow chart ……… 96
Figure 5.8 Sample control chart ……… 99
Figure 5.9 Process flow diagram of spindle part ……… 105
Figure 6.1 Framework of CAMP-R ……… 111
Figure 6.2 Feature and curve chain of the spindle part ……… 112
Figure 6.3 Manufacturing feature data structure for rotational parts ………113
Figure 6.4 Feature geometry and tolerance specification ……… 114
Figure 6.5 Manufacturing feature definition interface ……… 114
Figure 6.6 Data structure of feature/setup level BOP ……… 115
Figure 6.7 XML structure of part family BOP ……… 116
Figure 6.8 Flowchart of setup planning ……… 117
Figure 6.10 Table of feature level BOP data ………119
Figure 6.11 Table of setup level BOP ……… 120
Figure 6.12 Interface of cutter planning in CAMP-R ……… 122
Figure 6.13 Chuck selection procedure ……… 122
Figure 6.14 In-process models for wheel spindle ……… 123
Figure 6.15 Manufacturing document and cutter tool path file ……… 124
Figure 6.16 Datum machining surface graph of spindle ……… 125
LIST OF TABLES
Table 2.1 Tolerance stack-up models with WC/RSS ………17
Table 2.2 Literature relevant to computerized tolerance chart analysis ……… 17
Table 2.3 Manufacturing error classification ………20
Table 3.1 Relation between geometric tolerances and machining processes ……… 47
Table 3.2 ISO tolerance band ……… 48
Table 3.3 Output data: simulation result of finish part ……… 54
Table 3.4 Output data: sensitivity study results ……… 54
Table 3.5 Setup planning for the sample prismatic part ……… 55
Table 3.6 Tolerance stack up analysis results ……… 56
Table 3.7 Contribution of each error source to parallelism between feature 8 and 11 …… 57
Table 4.1 Machining process associated with ISO tolerance grade [Dag, 2006] …………64
Table 4.2 Sensitivity analysis results for selected toleranced feature ……… 68
Table 4.3 Manufacturing cost factors for different feature type ……… 71
Table 4.4 Complexity factors for feature geometric relationship ……… 72
Table 4.5 Selected GA parameters ……… 77
Table 4.6 Comparison of assignment plans based on sensitivity and GA ……… 78
Table 5.1 Locating error analysis from workpiece, jaws and chuck ………86
Table 5.2 Various conditions causing the change of sample size n ……… 95
Table 5.3 Summary of the methods for control limit calculation ……… 100
Table 5.4 Sample process FMEA table for wheel spindle ……… 102
Table 6.1 Spindle process tolerance stack up analysis results of OP 301 ……… 125
Chapter 1: Introduction
This chapter gives an introduction of the research on quality control planning in
computer-aided manufacturing planning, including the problem statement, objectives and goal of the research, and the technologies used in the research and overall tasks of
integrated quality control planning. The organization of the dissertation is also listed at the end of this chapter.
1.1 Problem statement
Process planning translates design information into the process steps and instructions to efficiently and effectively manufacture products [Crow, 1992]. Process planning can be divided into macro and micro level production planning [Ham, 1988; Yao, 2003]. The macro level planning is to determine the setups and process sequences and the micro level planning is to determine the process details. Computer-aided process planning (CAPP) has been studied intensively for years [Zhang, 1999]. As ensuring the production quality is an essential requirement in manufacturing, quality control plan is an important component in production planning. In most CAPP research, tolerance analysis has been conducted to estimate the process error stack up and synthesize the process tolerance requirements. However, the tolerance analysis study is not extended to the quality control domain. On the other hand, although quality control plans are necessary contents of production planning, they are generated manually based on engineers’ experiences or
separated from the manufacturing planning. Therefore, there is a need to integrate the tolerance analysis into quality control planning in production planning.
From the management perspective, a complete production plan may include many aspects. This research focuses on the generation of quality control plan in the production planning stage. Quality control is a technique used in all areas of manufacturing to check product geometry or attributes against a set standard or specification of quality. The general routine of quality control plan is prompted in five steps [Vardeman, 2006]
1) Critical feature identification, 2) In-process inspection determination, 3) Monitoring design,
4) Feedback data processing,
5) Diagnosis of the cause of process variation.
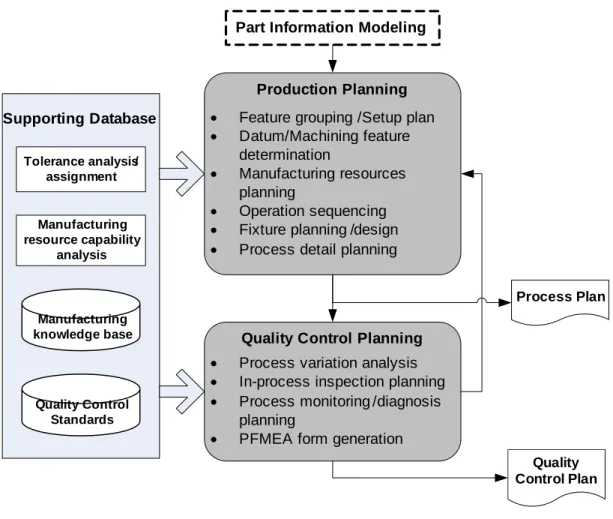
Figure 1.1 demonstrates a general procedure of production planning [Rong, 2001], in which the quality control planning is integrated. A comprehensive study in tolerance analysis has been conducted and provides us with a platform to link the quality control planning to production planning. However, most studies of production planning stopped at the process plan generation without performing the tolerance analysis in the quality control plan generation. In order to facilitate rapid production planning, especially for mass customization, this research is dedicated to developing a systematic method to integrate the quality control planning with CAMP.
A production plan defines all setups and processes required to produce a quality product from raw materials. It also specifies process tolerances to guide the manufacturing processes and ensure the design tolerance is achieved.
• Feature grouping /Setup plan • Datum/Machining feature determination • Manufacturing resources planning • Operation sequencing
• Fixture planning /design
• Process detail planning
Production Planning
Process Plan
Part Information Modeling
Manufacturing knowledge base
• Process variation analysis
• In-process inspection planning
• Process monitoring /diagnosis planning
• PFMEA form generation
Quality Control Planning
Quality Control Plan Manufacturing resource capability analysis Tolerance analysis/ assignment Quality Control Standards Supporting Database
Figure 1.1 Flowchart for automated setup planning
Tolerance analysis is an important means to generate a quality production plan and may consist of three modules: tolerance stack-up analysis, tolerance assignment (also called tolerance synthesis / allocation), and quality control planning. If all manufacturing errors are known, the tolerance stack-up analyzes the effects on the quality of the product and predicts whether all the design tolerance requirements can be satisfied. Tolerance assignment finds a set of feasible process tolerances for all the setups and processes according to the given design tolerances and production plan. The result of tolerance assignment can be further optimized to minimize cost/cycle time while maintaining product quality. After that, quality control planning is used to decide on the strategies of
in-process inspection and feedback control of the processes according to the process variation analysis results so that the process tolerances are guaranteed in production. Currently, tolerance chain/chart analysis is widely used in process planning to ensure that finished parts meet design tolerance requirements [Wade, 1983]. However, the
conventional tolerance charting is limited to one dimension of tolerance analysis. It cannot deal with the complex 3D tolerance stack-up and the geometric tolerances. The worst case scenario tries to satisfy the objective by specifying overly conservative bounds on the variability of each manufacturing operation relative to the nominal feature
specifications and in turn, requires more accuracy and precision from manufacturing equipment and greater control over production environmental or machine tool/tool/fixture related component of the error budget. This may lead to higher manufacturing costs. Therefore, a new systematic tolerance analysis method is needed to resolve the tolerance control problems for mass customization.
1.2 Objectives and contributions
The objectives of the research are to develop a systematic approach to analyze the tolerance stack-up for multi-setup process, to assign the optimal process tolerances to each operation considering the cost and quality, and to define the appropriate quality control planning strategies for the mass customization.
Contributions of the research are:
• Proposed a new framework of CAMP with Quality Control planning
o Simulation-based tolerance stack-up analysis for multi-setup operation o Tolerance grade (IT) is widely used in tolerance analysis
o Genetic algorithm is used to optimize assignment plan
o Three-level cost model is created to evaluate assignment results
• First time QC planning is integrated in CAMP
o Developed a computerized tool for QC planning in CAMP based on
tolerance analysis
o Proposed a standard procedure consisting of four sequential steps to
perform QC planning in CAMP
1.3 Technologies and approaches
The aim of the CAMP system in this research contains two aspects: one is to assign feasible process tolerances to each operation and validate that the tolerance stack-up does not exceed the design tolerance, the other one is to best realize the quality control
planning in the CAMP system, especially in the mass customization.
An integrated computer-aided tolerance analysis (CATA) system is developed to facilitate rapid production planning for mass customization. The CATA system consists of three modules.
Monte Carlo simulation-based tolerance stack-up analysis module is used to predict
dimensional, geometric, and positional tolerances of a final product that went through a multiple-station production line when process error information is given for each
source contributes to the final product quality and hence identify critical processes to assist the production design and the quality control planning.
Generic algorithm-based optimal tolerance assignment module is used to determine an
optimal tolerance synthesis strategy. The optimization criterion is to minimize the manufacturing cost and cycle time while maintaining product quality. The effective factors at machine level, part level, and feature level are considered in the cost model. Before the release of the assignment’s result, the Monte Carlo simulation based tolerance stack-up analysis is employed to verify the satisfaction of design tolerance requirements.
The integrated quality control planning in the CAMP system is divided into four
sequential steps. The first step is to identify the process variation. Various error sources can be recognized based on process analysis. The second step is to determine the
necessity of in-process inspection and to generate an in-process inspection plan on what, when, and how the process parameters are measured in-process. Furthermore, the process data will be monitored and analyzed by using the statistical process control (SPC)
method. In the third step, the control limits are determined and the failure mode effect analysis (FMEA) procedure and content is determined for error diagnosis and process control. Finally, a process flow diagram is developed in the fourth step to support the process plan by using the graphic representation. The documentation of the four steps is generated as the quality control planning in the CAMP system.
1.4 Scope
This study focuses on production planning aiming to build the link between quality control planning and manufacturing planning through tolerance analysis. The details on how to perform the process planning in the CAMP system (such as adjusting the
operation sequence, replacing the fixture design, changing the process parameters, etc.) have been identified as important factors but are not discussed in this research.
The tolerance analysis - either stack-up analysis or tolerance assignment - in this research is for component production with machining systems rather than assemblies and other types of processes. In addition, the quality control mainly refers to the geometric/
dimensional tolerance control/inspection rather than other control characteristics, such as hardness, surface finish or heat treatment requirements.
In implementation of the research, a computer-aided manufacturing planning system for rotational parts (CAMP-R) is developed. The production of prismatic parts in mass customization has not been included because it has been covered in previous research.
1.5 Dissertation organization
This dissertation is organized as follows
• Chapter 1 introduces the background and objectives of the research, and key technologies applied in the research, as well as the scope of the research.
• Chapter 2 gives a review of CAMP for mass customization, state-of-the-art tolerance analysis technology, and prevail quality control methodologies.
• Chapter 3 presents the computer-aided tolerance analysis system and introduces the Monte Carlo simulation-based tolerance stack-up analysis technology.
• Chapter 4 resolves the inverse problem of tolerance stack-up analysis by introducing the generic algorithm-based optimal tolerance assignment method.
• Chapter 5 interprets the four sequential steps of quality control planning for integrating it with the CAMP system. The four steps are 1) process variation analysis; 2) in-process inspection; 3) process monitoring and controlling; 4) quality control planning integration.
• Chapter 6 is the system implementation where the CAMP-R system is introduced.
Chapter 2: Literature Review
In this chapter, the state-of-the-art computer-aided manufacturing planning as well as the quality control planning is reviewed with emphasis on the link between these two, which is tolerance analysis techniques. The literature on related technologies, such as
manufacturing error analysis, Monte-Carlo simulation, tolerance grade, tolerance-cost model, and several tolerance assignment methods, is also reviewed.
2.1 CAMP review
Computer-aided manufacturing planning, which forms the link between CAD and CAM is reviewed in this section. A brief historical overview of CAPP is provided in Section 2.1.1. The functionality offered by today’s CAPP systems is discussed in Section 2.1.2. In Section 2.1.3, the extensions of CAPP, CAMP, and its system, are discussed. Finally, the limitations of today’s CAPP systems are detailed in Section 2.1.4.
2.1.1 Brief overview of CAPP
CAPP has been a research issue since the 1960’s. In the early 1970’s, the first industrial application came into existence. It was directed only to the storage and retrieval of process plans for conventional machining [Ham, 1988; Alting, 1989; Hoda, 1993].
The variant approach to CAPP was the first approach used to computerize the process planning. Variant CAPP is based on the concept that similar parts may have similar process plans. The computer is used as a tool to assist in identifying similar process plans, as well as in retrieving and editing the plans to suit the requirements for specific parts. Variant CAPP is built upon part classification and Group Technology (GT) coding. In these approaches, parts are classified and coded based upon several characteristics or attributes. A GT code can be used for the retrieval of process plans for similar parts. Generative CAPP came into development in the late 1970’s. It aims at the automatic generation of process plans, starting from scratch for every new part description. Often, the part description is a CAD solid model, as this is an unambiguous product model. A manufacturing database, decision-making logic and algorithms are the main ingredients of a generative CAPP system. In the early 1980’s, knowledge based CAPP made its introduction using Artificial Intelligence (AI) techniques. A hybrid (generative/variant) CAPP system has been described by Detand [1993].
2.1.2 Function of current CAPP systems
During the last three decades, CAPP has been applied to a wide variety of manufacturing processes, including metal removal, casting, forming, heat treatment, fabrication,
welding, surface treatment, inspection and assembly. However, until recently, the research and development efforts have mainly focused on metal removal, particularly in NC machining. The basic tasks of CAPP for metal removal include the following steps [Hoda, 1993; Kamrani, 1995],
• Design analysis and interpretation;
• Process selection;
• Tolerance analysis;
• Operation sequencing;
• Cutting tools, fixtures, and machine tool specification;
• Determination of cutting parameters.
Today’s more advanced CAPP systems take a CAD based product model as input. At best, this is a 3D solid model on which the CAPP system can perform automatic feature recognition. However, some existing CAPP systems take wire frame models as an input and on which the process planner has to identify the manufacturing features manually [Detand, 1993]. As CAD models often do not contain tolerance and material information, some CAPP systems allow for adding this information to the product model manually in order to allow automatic reasoning. Most generative CAPP systems allow for human interaction. Many CAPP systems can be classified as semi-variant or semi-generative.
2.1.3 CAMP for mass customization
For the research from CAPP to CAMP, the total tasks are broken down into five sub-tasks, which are shown in Figure 2.1 [Yao, 2004].
Figure 2.1 Tasks of the CAMP of mass customization
The production mode was regarded as an important factor that affects the CAPP [Yao, 2003]. Besides the three conventional production modes - mass production, job
production, and batch production - the production mode of mass customization was considered in manufacturing planning. Mass customization allows customized products to be made to suit special customer needs while maintaining near mass production
efficiency [Jiao, 2001]. Compared to conventional mass production, mass customization allows for more product variety in which products are grouped into families. The notion of “mass customization” was first proposed from a marketing management perspective [Kotler, 1989] and then brought into the production areas [Pine, 1993]. Some research has been carried out on product design (e.g., a hybrid configuration design approach for mass customization [Lu, 2005]). The research paid little attention to manufacturing planning for mass customization, although some research emphasizing on the
reconfigurable manufacturing systems (RMS) can be identified in process planning to adapt to variable quantities of products for competitive marketing [Koren, 1997; Bagdia, 2004]. RMS could be cost effective in rapidly adapting the manufacturing capacity and its machine functionality in a changing marketplace [Koren, 1999].
To help realize manufacturing planning for mass customization, a CAMP system for non-rotational parts was studied and developed between 2000 and 2004. The major
contributions of their research and its corresponding CAMP system are: 1) new features, processes and manufacturing resources can be added and utilized without
extra-programming work due to the use of a comprehensive feature, setup, and manufacturing information model, and 2) the best manufacturing practices for a part family are
organized in the three distinct levels, namely, feature level, part level, and machine level. The manufacturing planning system is therefore modular and expandable so that
manufacturing plans for new parts can be generated easily based on existing plans in the part families [Yao, 2003].
2.1.4 Limitations of present CAPP systems
Most present CAPP systems are not CAD-integrated. Therefore, it is difficult to include process details generated in the production planning. It is also difficult to validate the production plan with detailed geometric information.
A limitation presented in commercial CAPP systems is the communication with capacity planning functions. The research can be found to resolve this problem, focusing primarily on the PART system and its link with capacity planning [Lenderink, 1994]. It is proposed to complete the detailed process plan only just before the manufacturing of the part starts. Before completing the process plan, the first part of the process plan is derived from information becoming available from feature recognition and set-up selection. Using alternative setups, the jobs are assigned to the resources, based on the actual availability and the actual workload of all the machines in the workshop. Subsequently, the detailed process plan is completed. The method has been promoted by using non-linear process planning algorithms, comprising different manufacturing alternatives and represented by
an AND/OR structure [Detand, 1993].
Most of the production planning is not driven by tolerance analysis, which was only used as a post-analysis method to verify the production plan generated. There is no quality control planning in any CAMP system. There are no fixture design functions integrated in CAMP. It is a challenge to utilize both best practice knowledge (BOP) and scientific reasoning in CAMP.
The CAMP system research at Worcester Polytechnic Institute in collaboration with Delphi Corporation has completed some fundamental work on practical CAMP [Yao, 2004]. It integrated CAMP with CAD platform. The part information modeling includes geometry information and design specifications. The feature manufacturing method definition linked candidate manufacturing processes to feature definitions. Also it evaluated the capabilities of candidate manufacturing resources and derived an optimal process design based on the available manufacturing resource. In this research, the previous research is extended to the following areas,
1) This system was designed for the non-rotational part manufacturing planning and extended to handle the rotational parts.
2) The design information included in this system contains not only the part geometry information, but also the tolerance information.
3) This system used process simulation and cycle time calculation to evaluate the result of manufacturing planning. The quality control planning is associated with the process plan.
2.2 Tolerance analysis in CAMP
Improving quality and reducing cycle time and cost are the main objectives for competitive manufacturing. These objectives can be achieved partially by effectively controlling the tolerance in manufacturing. As a general rule, tolerances should be as close to zero as possible to ensure interchangeability and high product quality. But tighter tolerances generally require more precise manufacturing processes at increased costs.
Thus one goal is to generate parts with as loose tolerance as possible in order to minimize the production cost and still guarantee design specification. Therefore, the general
tolerance control involves 1) controlling the tolerance stackup via proper choice of processes, process sequence, and locating datum, 2) assigning the proper tolerance for each process or each component [Whybrew, 1997]. The difference between these two problems is illustrated in Figure 2.2.
Tolerance Analysis Tolerance Allocation
Tolerance
Tol 1 Tol 2 Tol 3
Tol 1 Tol 2 Tol 3 Tolerance Components Inter(ra)-Setup Part Assembly Components Inter(ra)-Setup Part Assembly
Figure 2.2 Tolerance analysis vs. tolerance allocation
2.2.1 Tolerance analysis methods
Most existing studies on the tolerance stack-up and assignment used worst case, statistical analysis, or simulation methods. Worst-case model assumes that all the component dimensions occur at their worst limit simultaneously and gives conservative results. Statistical analysis, mainly Root Sum Square, is based on the normal distribution assumption without considering skewness and kurtosis of error distribution. Monte Carlo simulation is the comprehensive consideration of manufacturing errors at the cost of heavy computational load.
Originally, the worst case and root sum square methods were developed to predict the accumulation of tolerances in a mechanical assembly [Fortini, 1967]. Commonly used equations are listed in Table 2.1. Further modifications to the RSS model have been
proposed to take into account mean shifts, biased distributions, and other uncertainties [Gladman, 1980; Greenwood, 1987]. Vector loop models and solid models have been presented for three-dimensional assembly [Etesami, 1987; Turner, 1987].
Table 2.1 Tolerance stack-up models with WC/RSS
1D assemblies 2D or 3D assemblies
Worst Case ∂U =
∑
Ti ≤Tasm asmi T i x f U ⎟⎟
T
≤ ⎠ ⎞ ⎜⎜ ⎝ ⎛ ∂ ∂ = ∂∑
Root Sum Square ∂U =[
∑
Ti]
≤Tasm 2 / 1 2 asm i T i x f UT
≤ ⎥ ⎥ ⎦ ⎤ ⎢ ⎢ ⎣ ⎡ ⎟⎟ ⎠ ⎞ ⎜⎜ ⎝ ⎛ ∂ ∂ = ∂∑
2 / 1 2 2where: xi is the nominal component dimensions,
Ti is the component tolerances,
∂U is the predicted assembly variation,
Tasm is the specified limit for ∂U, and
f(Xi) is the assembly function
∂f/∂xi is the sensitivity of the assembly tolerance to variations in individual component dimensions.
Table 2.2 Literature relevant to computerized tolerance chart analysis
Author(s) + Year Method/System
[Lin et al. 1999] Process data [Konakalla and Gavankar, 1997] TOLCHAIN
[Ji, 1996] Backward derivation
[Ji, 1993] Linear programming
[Dong and Hu, 1991] Nonlinear optimization [Li and Zhang, 1989] Graphical method
Among the worst case and statistical methods, tolerance charting is one of the techniques used to assign the process tolerances and has been performed manually for many years. A tolerance chart analysis shows how individual machining cuts combine to produce each blueprint dimension. Over the past two decades, researchers have developed various computerized methods for tolerance charting analysis. Some of the works are summarized in Table 2.2. These methods allow appropriate process tolerances to be automatically specified in a process plan. However, tolerance chart analysis deals only with dimensional tolerance rather than geometric tolerances while a few research works used the 1-D model to address the issue of a particular type of geometric tolerance (e.g. a position tolerance stack analysis) [Ngoi, 1996; 1999]. It has been proven that the three location directions need to be considered simultaneously as operation datum [Rong, 1997; Zhang, 2001]. However, the tolerance charting is only valid in 1-D model, and therefore, cannot be used in a 3D geometric tolerance analysis.
Worst case and statistical method are the main tolerance analysis methods. As pointed out by a great deal of documents, the inadequacy of the worst-case model is that the
likelihood that all the component tolerances are simultaneously reaching their worst is very small. This leads to over-evaluation of combined tolerances. Disadvantages of the RSS method includes: 1) RSS model is developed based on the normal distribution assumption, skewness and kurtosis caused by tool wear and other factors were not taken into account; and 2) it is very difficult to analytically apply statistical analysis to
geometric tolerances and 3D tolerance chains. Therefore, Monte Carlo simulation method is proposed to solve the complex cases that cannot be handled by tolerance charting [Lehtihet, 1989]. The simulation method has been used in tolerance analysis successfully,
particularly combined with the tolerance charting analysis method [Liu, 2003]. In this research, the Monte Carlo simulation method is applied to 3D manufacturing error analysis, which includes multi-station tolerance chain analysis and takes the locating error into account.
The Monte Carlo method is a stochastic technique based on the use of random numbers and probability statistics to investigate problems. It is a particularly effective method for complex multi-dimensional problems. Figure 2.3 demonstrates the procedure of Monte Carlo simulation [Song, 2005].
Generate Control Points Determine Error Sources and Distributions Sampling from Each Error Source Stack up Simulation Statistical Analysis of Resultant Tolerances from Simulation Determine Deviations
of Control Points and Convert to Tolerances Simulation Controller
Number of Trials, etc
Figure 2.3 Procedure of Monte Carlo simulation for tolerance stack-up Driven by automated assembly, the application of Monte Carlo simulation in tolerance analysis has been investigated and has become one of the most widely used statistical techniques. This method has been employed in simulation of assembly processes [Doydum, 1989; Lin, 1997; Shan, 1999]. The improvement of computational performance and interaction with other artificial intelligence methods has also been studied [Lee, 1993; Shan, 2003].
2.2.2 Manufacturing error analysis
The manufacturing errors have been classified according to different factors as shown in Table 2.3 [Musa, 2003].
Table 2.3 Manufacturing error classification
Factor Categories Time • Quasi-static • Dynamic Randomness • Deterministic • Random Sources of errors • Geometric • Thermal • Cutting force-induced Errors influence on geometric position
• Machining (Machine motion error) • Fixture (Setup error)
To control manufacturing error for producing quality products, it is necessary to 1) find out the sources of manufacturing errors, 2) study how these errors interact, combine and create an inaccurate surface after an operation, and 3) investigate how errors propagate through a series of operations to influence the final component accuracy.
Extensive research works have been conduced to identify, model, analyze, predict, and control various manufacturing error sources. The most common approach is that first, error occurrences are observed and analyzed, their patterns are then modeled, and finally, their potential behaviors in future operation are predicted [Liu, 2003]. Different
algorithms are then proposed to compensate for these errors. These research efforts may lead to enhanced manufacturing accuracy by analyzing the process in detail and taking measures to compensate for errors. However, the following limitations exist.
• In general, the approach usually deals with how a specific type of error affects the dimensions and geometry of the machined feature, rather than comprehensively considering all error sources involved simultaneously.
• The accuracy improvement or compensation method resulted from these research efforts may not be associated to the improvement of process planning as well as the quality control. It is a local control and needs a system planning decision based on the estimation of how much this local improvement of manufacturing accuracy contributes to the end component after the workpiece goes through multiple operations.
To analyze the manufacturing errors during the machining, five basic dimension relationship models of locating datum and machining surfaces are defined for the
estimation of machining errors in the multiple setup condition [Rong, 1996]. Further, for production with multi-stations/setups, the tolerance analysis was decomposed into two levels: inter-setup tolerance analysis, and intra-setup tolerance analysis [Hu, 2001]. Inter-setup tolerance analysis identifies the tolerance stack-up in accordance with different setups. Intra-setup tolerance analysis studies machining errors within each single setup plan. The inter-setup tolerance stack-up can be expressed as:
(2.1) L jy K ix ij =∆ + +∆ ∆ ...
where K, L are the feature in ith, jth setup;
x, y are the interim setups between ith, jth setup.
Machining errors within one setup can be resulted from the deterministic component (∆det) and random component (∆ran). The deterministic component primarily consists of
locating errors (∆loc) from the displacement, locating and supporting elements in the
machine tool and fixture, tool-fixture alignment errors, machining tool errors (∆mt) and
cutting tool wear errors (∆tool), and other deterministic errors (∆o) in the machining
processes. If the contribution of each error source is small, the overall effects can be approximated by summation of involved error sources.
∑
(
(2.2) = ∆ + ∆ + ∆ + ∆ + ∆ = ∆ L K i i ran i o i tool i loc i mt)
The tolerance analysis research considers the interaction of various manufacturing error sources in multiple operation scenarios. The result of tolerance sensitivity analysis could be sent back to the manufacturing engineer to refine the process plan.
2.2.3 Tolerance assignment
Traditional tolerance assignment methods are implemented separately in the design and the process planning stages [Speckhart, 1972; Chase, 1988; Michael, 1982]. Most of the established tolerance assignment methods are focusing on assembly processes, assigning the assembly functional tolerance to the individual workpiece tolerance to ensure that all assembly requirements are met [Ngoi, 1998].
A variety of techniques have been employed to assign tolerance. Among them, the integer programming for tolerance-cost optimization [Ostwald, 1977; Sunn, 1988], rule-based approach [Tang, 1988; Kaushal, 1992], feature-rule-based approach [Kalajdzic, 1992], knowledge-based approach [Manivannan, 1989], genetic algorithm [Ji, 2000; Shan, 2003], and artificial intelligence [Lu, 1989] have been used to optimize tolerance allocation.
Since minimizing manufacturing cost is a target of operation tolerance assignment while ensuring the quality, in this dissertation, the process tolerance assignment is optimized with the assistance of genetic algorithm and feature-cost relationship. Hereinafter is the brief review of the manufacturing cost model and generic algorithm in tolerance analysis.
Manufacturing cost models
One of the ultimate goals of an enterprise is to make a profit. Hence, every company has been struggling to reduce cost, which can be done more effectively at the design and planning stage rather than manufacturing stage. It has been shown that about 70% of production cost is determined at the early design phase [Ouyang, 1997].
Manufacturing cost modeling at the design stage has been investigated for many years and used as one of the major criteria, if not the only, for optimization of production planning. There are numerous facets in cost models. One way is to interpret the
manufacturing cost as a summation of processing cost, inspection cost, rework/scrap cost, and external failure cost [Mayer, 2001]. The processing cost can then be decomposed into machine cost, tool cost, material cost, setup cost, overhead cost, energy cost, etc [Esawi, 2003]. All terms can be further formulated if adequate information on process
characteristics is known. This method gives detailed analysis on each factor that
contributes to final cost. However, each term normally involves assumption-based terms, empirical/semi-empirical formulations, and/or production line data that may not available at the time of planning. In modeling the process cost, it is often assumed that the
processing cost is inversely proportional to the tolerance required to achieve [Dong, 1994]. This assumption is based on some experimental data obtained in the 1950’s. It may be generally right but is not justified quantitatively for different manufacturing
methods and processes. Another method used to estimate production cost is feature based modeling. Instead of collecting all detail process information, this method directly link the manufacturing cost with features [Feng, 1996; Shenhab, 2001]. The combination of features in a process and the manufacturing resource used in the process are not
considered. The method was used in assembly product design and cost evaluation at the feature level, component level, and assembly level [Weustink, 2000].
Application of genetic algorithm in tolerancing
Genetic algorithm is one of the techniques that have been used for optimal tolerance synthesis/allocation. Genetic algorithm is a search algorithm based on the mechanics of natural selection and natural genetics. It is an iterative procedure maintaining a
population of structures that are candidate solutions to specific domain challenges. During each generation the structures in the current population are rated for their
effectiveness as solutions, and based on these evaluations, a new population of candidate structures is formed using specific ‘genetic operators’ such as reproduction, crossover, and mutation. This search algorithm is good for systems with unknown or implicit function, and unlimited or very large searching space.
Statistic tolerancing, especially the developed Monte Carlo simulation based tolerance stack up analysis does not provide explicit relationship between the stack up results and the input process/locator tolerances. Furthermore, a multi-setup production line is normally consists of dozens even hundreds of processes and each process can be set at one of several tolerance levels. Every combination of those process/locator tolerances could be one candidate of the tolerance assignment results. Evidently, the search space
increases exponentially with the number of setups. With this understanding, the genetic algorithm has been applied to statistic tolerancing [Shan, 2003].
In this research, the genetic algorithm is adopted as an optimization technique with sets of tolerance assignment plans as a population. Particularly the discrete tolerance grades are considered for generating operation tolerance assignments under international standard.
2.3 Quality control planning
In the manufacturing industry, quality control (QC) was defined as detecting poor quality in manufactured products and taking corrective action to eliminate it. The current view of quality control, derived largely from the Japanese influence, encompasses a broader scope of activities accomplished throughout the enterprise. The activities can be grouped into three processes [Juran, 1989]:
1) Quality planning; 2) Quality control; and 3) Quality improvement.
Statistical methods have played important roles in quality improvement as well as in quality control. In this thesis, the integration of quality control planning into
2.3.1 Quality control planning in CAPP
Product quality is important as it is well known, and 80% of all costs and problems of quality are created in early product development stages, including product planning, product design and process planning phases [Pyzdek, 1992]. The product features and failure rates are largely determined during quality planning [Juran, 1992]. Quality planning is the activity of establishing quality goals in production operations and developing procedure and processes required to meet the goals. The quality system of a manufacturing company is divided into two parts: off-line quality control (QC) and on-line quality control. The former refers to the activities and effort for quality from market research and product/process development, which are apart from production lines. The latter refers to the activities and effort for quality of conformance through manufacturing, inspection and customer service, which are mainly on production lines [Taguchi, 1986]. The latter part of the quality control planning is thus an important activity of the
manufacturing planning [Pyzdek, 1992; Taguchi, 1986].
As the computer integrated manufacture system (CIMS) was developed, computer aided quality control (CAQC) received more and more recognition. CAQC system can be used to collect, store, analysis and evaluate information and data about quality that exist in the enterprise production and management, incorporate quality control activity, efficiently and effectively [Yu, 1999].
The quality control methods have been used in production for a long time to ensure the production quality. The methods include in-process inspection, statistical process control (SPC), and failure mode effect analysis. In production planning, the strategy of in-process
inspection, data sampling method and SPC control chart, and failure mode effect analysis content need to be determined.
2.3.2 In-process inspection
Since all manufacturing processes involve variations in production, effective inspection of critical product attributes is important. Human inspectors, automated sensing devices, or a combination of both are often used for quality-assurance purposes.
In quality control, inspection is the means by which process variation is detected and good quality is assured. Inspection is traditionally accomplished using labor-intensive methods that are time-consuming and inaccurate. In mass customization, automated inspection systems are being increasingly used as sensor and computer technologies are developed and refined [Mandroli, 2006]. In different conditions, different inspection decisions may need to be made as part of production planning, and if a measurement is necessary, what to measure, when and how to measure.
Automatic inspection stations (AIS) have been widely employed to assure product quality. With limited inspection resources available, an inspection allocation problem occurs in a multistage manufacturing system, particularly in the electronic manufacturing industry that performs precision testing on package circuits or chips [Lee, 1998], and small and medium-sized workshops [Shiau, 2002].
Depending on the varying inspection capabilities and applications, inspection stations can be categorized into several classes. Each inspection station class consists of inspection
stations with same inspection usage and capability. The inspection allocation problem is to determine
1) At which operation an inspection activity should be conducted, and
2) Which inspection station should be used if an inspection activity is needed The research on the in-process inspection has also focused on the inspection strategy under the assumption that the process plan is fixed. Two alternatives of sequence of processing, inspection and correction facilities were discussed [Irianto, 1995]. Inspection planning during process planning was studied for a multistage manufacturing system by using two decision criteria of sequence order of workstation and tolerance interval [Shiau, 2003]. The research regarded the inspection process as more corrective than proactive action.
There is no systematic study on the determination of in-process inspection strategy for mass customization. In the production planning stage, the operation tolerances are
assigned based on process capability analysis; the in-process inspection is only necessary when a process variation is identified.
2.3.3 Statistical Quality Control (SQC)
SQC is generally described as the control of product quality by statistical methods. Various techniques developed mathematically have been used in the control of product quality. This best practice addresses two separate but related techniques, Statistical Sampling and Statistical Process Control (SPC). The former is to take samples of product
to determine if a batch is acceptable and the latter is to monitor production process to prevent poor quality [Krumwiede, 1996].
Statistical Sampling
Statistical sampling is a method of inspection performed throughout the manufacturing process, according to sampling acceptance plans and based on the laws of probability. Statistical sampling inspects defined characteristics on a portion of a batch to determine statistically if the entire lot is acceptable.
Benefits of using statistical sampling include:
• The ability to quantify results and relate them to the entire portfolio being reviewed.
• The ability to quantify sampling risk (i.e., the risk that the sample is not indicative of the entire portfolio).
• Effective use of limited examiner resources.
Statistical Process Control (SPC)
Statistical process control has been developed by industrial engineers to reduce the variability of parts during manufacturing [Abugov, 1993; Houssain, 1996; Krumwiede, 1996]. Briefly, a process can be considered as a series of productive steps resulting in a product. Each step produces a part of the product made to ‘fit’ with other parts needed to produce the product. SPC allows the early detection of unintended variation of the parts within each step so that they can be maintained or brought into statistical control. Central to the use of SPC is the control chart for observing variations of the process. A control chart is a graphic summary of the descriptive statistics of a running group (set) of
parts. It plots the values that are under consideration against the sequence of parts. The plotted measurement variables are examined to be within an ‘Upper Control Limit’ (UCL) and ‘Lower Control Limit’ (LCL), which were established for allowed variation. If the measured variables characterizing the part exceed the limits, it indicates the need for corrective action.
Traditional control charts aroused in such a way that corrective actions are taken only after the occurrence of an out-of-control signal which indicates that the process
performance has changed to a state significantly far away from the original. In this way, control charts function only as a reaction to a system’s deficiency [Houssain, 1996]. It would be more effective to take a proactive approach preventing the occurrence of out-of-control situations by allowing the process to be adjusted in a preventive way so that fewer non-conforming items will be produced. Engineering process control (EPC) techniques was developed, in combination with SPC, aiming at adjusting the process constantly so that it is always kept on target [Box, 1994; 1997].
The procedure of implementing SPC includes, • Take periodic samples from process • Plot sample points on control chart • Determine if process is within limits • Prevent quality problems
2.3.4 Failure Mode and Effects Analysis (FMEA)
Failure modes and effects analysis (FMEA) is a quality improvement and risk assessment tool commonly used in industry. It is a living document used to capture design and process failure information. The FMEA documents are one of the important outputs of the quality control planning.
FMEA can be classified into two main types, i.e. design FMEA and process FMEA [Stamatis, 1995]. The potential failure modes and potential causes for each component or process step are identified and documented in advance. It provides a tool of assessment of the failure effects. The risk of each failure is prioritized on the basis of the risk priority number (RPN). RPN is a decision factor based on the product of three ratings:
occurrence, severity and detection. The ratings are scaled with numbers between 1 and 10. Failure modes with high RPN values are selected. The corresponding current controls (i.e. the solutions) will be implemented on the basis of the selected failures.
Traditionally, potential problems of a design or process are captured with FMEA manually using hard copy or spreadsheet. However, as the accumulated FMEA knowledge grows, the information becomes increasingly difficult to find. Hence, it is increasingly harder to reuse. In order to increase its effectiveness, much research has been carried out to find an effective way to provide automatic FMEA report generation. Several software systems, such as FLAME [Price, 1995] and Auto-SteveTM [Price, 1997] for the design of automobile electrical systems, GENMech [Hughes, 1999] for mechanical design, and the research work for hydraulic systems design [Atkinson, 1992; Hogan, 1992], have been developed to help the FMEA documentation. Methods were suggested for process FMEA application [Bouti, 1994; Price, 1998] and a more generic
approach was proposed for both design and process FMEA [Eubanks, 1996]. Despite the wide use of FMEA in industry and the research work on modeling several aspects of FMEA analysis, how to generate FMEA information in production planning stage and integrate with CAMP is still a great challenge.
2.4 Summary of current research
Process planning translates product design information into the process steps and instructions to manufacture efficiently and effectively. Significant benefits can be resulted from the implementation of CAPP. Since the 1960’s, a lot of research has been related to CAPP. Considering the new production mode, mass customization, a
comprehensive CAMP system has been studied and developed. Based on the review of previous research, the CAMP technique is expanded in three aspects.
1) Current CAMP system is expanded from applying to non-rotational part manufacturing planning to include the application to rotational parts.
2) The design information included in CAMP system is expanded to contain not only the part geometry information, but also the tolerance information in the part information model. Therefore the tolerance analysis can be conducted during the process planning.
3) This system is expanded by adding quality control planning function to the process simulation and cycle time calculation.
Tolerance analysis and tolerance assignment are two important issues, which provide the base of quality control planning. Most research used worst-case or statistical method to
solve the tolerance stackup problem with limitations incapable of calculating the complex 3D geometric tolerance stackup, especially in multi-operation cases. Monte Carlo
simulation is a method that could be used in manufacturing error estimation with considerations of locating datum variation and multi-operation cases. However, a meaningful cost function is needed for tolerance assignment optimization.
Quality control plan is an important component in CAMP, but has not been integrated with tolerance analysis and into CAMP. The quality control planning may include the identification of process variation, determination of in-process inspection strategy, control limits, and FMEA documentation.
Chapter 3: Tolerance Stack-up Analysis for Production Planning
Tolerance analysis has been receiving renewed attention as the global competition is driving industrial companies to pursue better quality and lower cost. Based on the concept of mass customization, it is desired that new products be developed in small volume and manufactured with mass production rates. Hence, an optimal production plan needs to be made rapidly according to the available manufacturing resource. Tolerance analysis and quality control are important components of the rapid production planning. Although a lot of research work has been done in this area, there is a gap of academic research and industrial application. This chapter presents an integrated computer-aided tolerance analysis (CATA) system to facilitate the rapid production planning for mass customization. The CATA system consists of three modules: tolerance stack-up analysis, operational tolerance assignment, and quality control planning. Monte Carlo simulation-based tolerance stack-up analysis module has been developed and is presented in this chapter. It is capable of predicting dimensional, geometric, and positional tolerances of a final product that may go through a multiple-station production line. Parametric study is conducted to determine the sensitivity of final product quality to each error source and hence identify critical processes to assist quality control planning. A generic algorithm-based optimal tolerance assignment module is introduced in the next chapter and the quality control planning is presented in Chapter 5.
3.1 The framework of computer-aided tolerance analysis system
Study and development of computer-aided tolerance analysis (CATA) are driven by the demand of industry and accommodated by the rapidly improving computer technology. This CATA system may help attack the three problems of tolerance analysis: tolerance stack-up, tolerance assignment and quality control planning.
DMG
Setup info: - fixture plan
- process info CAD model FTG
Specify features to be analyzed Feature-error data file Tolerance-feature data file Tolerance sensitivity database Tolerance stack-up analysis result Adjust tolerance assignment Stack-up simulation Tolerance requirements satisfied? All process capabilities reached? Optimal assignment achieved? Process capability
-process error - cost database Optimal tolerance assignment Tolerance stack-up analysis report
Process plan failed N Y N N Y Y Input Stack up Assignment Optimization QC planning procedure - Process variation analysis - In-process inspection - Statistical quality control - Process flow diagram
Quality control documents
Quality control planning
The tolerance stack-up analysis is to determine the process error effects in each setup on the final geometric accuracy of manufacturing features. When the process errors are specified by operational tolerances in each setup, the final resultant errors of each manufacturing feature can be estimated. The final errors are compared with the design tolerance specifications to identify any possible defects. The tolerance assignment is to determine the operational tolerance requirements in each setup based on the design tolerances of each manufacturing features and the process capability. It is an important step to determine operational tolerance for each setup in production planning based on design requirements of a product. Finally the quality control planning is to determine the quality control details, i.e., the way to ensure the operational tolerance during production, as part of production planning.
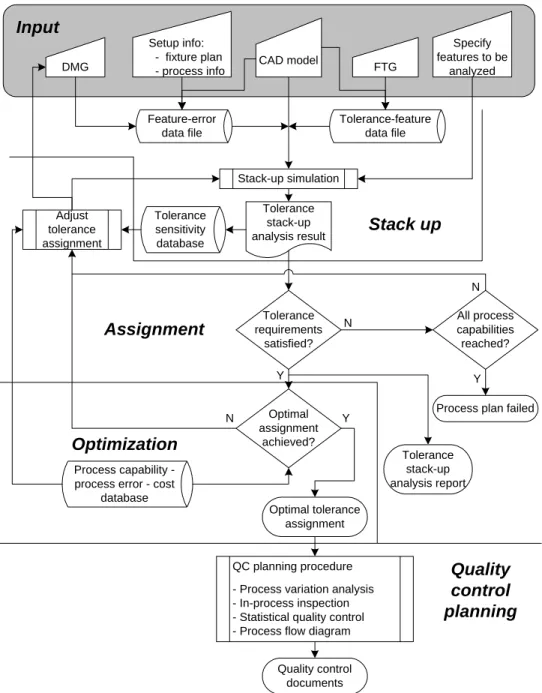
The structure of CATA system is illustrated in Figure 3.1. The design and manufacturing information are collected and stored according to pre-defined data structure. Features and error sources characteristics are extracted from the CAD model and setup planning documentation and used for tolerance stack-up simulation. Based on the process error information, the produced feature variation is simulated and estimated. After the
simulation is completed, the statistical analysis of the feature geometry deviations can be performed and the results can be compared with design requirements. Parametric study is also conducted to evaluate the sensitivity of feature tolerances to each error source. The tolerance assignment module starts with the economic tolerance grade (IT)
associated with machines in all workstations. Further modification and optimization of process tolerance can be made, assisted by sensitivity analysis and cost model, to tell if the stack-up result of assigned tolerance can meet the design requirements. Because the
tolerance sensitivity reveals the sensitive degree and contribution degree of each
manufacturing error source, it enables the process variation analysis to find the impact of each factor. Further more, the in-process inspection plan will be generated to proactively prevent the quality problem. Thus, the quality control planning is conducted after the completion of tolerance analysis.
3.2 Tolerance stack-up model
In this research, the tolerance stack-up analysis is implemented to evaluate the machining error effects in each setup on the feature tolerance specifications of the final product. The basic idea of the tolerance stack-up analysis is to create an analytical model for predicting the accumulation of process tolerances. Monte Carlo simulation is a numerical method for determining an approximate solution for mathematical physics and
engineering technology problems by the way of a statistical test and simulation of
random variables [Zhang, 1998]. The Monte Carlo based tolerance stack-up simulation is based on the use of a random number generator to simulate the effects of manufacturing variations on tolerance stack-up. Tolerance stack-up problem may be very complicated because many factors contribute to the stack-up including fixturing errors, machine errors, tool wear, part inaccuracy, and so on. These factors have different probability distribution functions including the normal distribution. Theoretically it has to collect a great deal of statistical data in order to achieve sufficient and reliable results. To some extent, this would lead to its limitation in practice. In the production planning stage, the process errors are assumed as normal distribution with the tolerance range as k·σ where σ
Furthermore, tolerance analysis involves two different aspects of stack-up, inter-setup tolerance analysis and intra-setup tolerance analysis [Hu, 2001]. Inter-setup tolerance analysis is mainly to estimate the manufacturing error propagation in accordance with different setups. Different setup plans may lead to different locating and clamping methods, and different fixture configurations, resulting in different manufacturing error stack-up. Therefore, a stack-up methodology needs to be developed to verify setup accuracy. A searching algorithm of tolerance chain is to be developed as one of the most important components in the computer-aided engineering methodology.
Besides that, the intra-setup tolerance analysis is also studied to determine how much the manufacturing errors can be resulted by various error sources, such as locating, tool wear, vibration, and so on, within a setup. With these two aspects of considerations, a
consolidated analysis method is established to solve the tolerance stack-up problem.
3.2.1 Inter-setup tolerance stack-up model
When a feature is machined through multi-setups, a tolerance chain may be formed among the machining and datum features. The tolerances can be assigned to a single feature (the toleranced feature), such as "limit of size" dimensional tolerances and certain geometric tolerances including straightness, flatness, circularity, cylindricity, and profile
tolerances when specified without datums. These types of tolerances are mainly determined by machine/process capabilities and do not need to be considered in setup planning.
Other types of tolerances involve not only the toleranced features but also one or more reference features (datums), and hence are referred to as relative tolerances. The relative tolerances include non-"limit of size" dimensional tolerances and the geometric
tolerances, such as parallelism, perpendicularity, angularity, position, concentricity,
symmetry, runout (circular and total), and profile tolerances (profile of a curve and profile of a surface) when specified with datums. They are influenced not only by process capabilities but also by the setup methods applied; therefore, need to be considered in setup planning.
Generally speaking, the relative tolerance relationships between two features could be tracked in a single setup or multiple setups. In previous work, a datum machining surface relationship graph (DMG) is used as a powerful tool to describe datum and machining surface relationship and track machining error stack-up among multiple setups [Bai, 1996; Zhang, 1999]. The tolerance chain between two features can be easily identified through searching the shortest path in DMG graph. The retrieved tolerance chain between feature i and j can be expressed in the following equation:
∆ij = ∆ik + ∆km + ··· + ∆lj (3.1)
Eq. 3.1 is written in a linear format because each tolerance is regarded as sufficiently small. But the questions about this equation are: 1) It is easy to track the shortest path in the DMG graph, but how can we represent the DMG information in data format and how can we search the stack-up chain by computer? 2) Does each pertinent process tolerance affect the stack-up tolerance at the same level? 3) Can we just simply sum up all pertinent process tolerances to evaluate the resultant tolerance? To solve these problems, first, the stack-up chain searching algorithm is developed in which the DMG information is
represented in XML file. Second, each tolerance will be further decomposed to several error terms in a single setup. Thus the contribution of each process tolerance can be evaluated and be passed to the process variation analysis.
Whenever the tolerance chain is determined, the tolerance stack-up can be expressed in a linear equation. Figure 3.2 shows a simple part manufactured through two setups. In setup I, feature A is machined referring to datum X. In setup II, feature B is machined referring to datum A. When analyzing the profile tolerance between feature B and X, the stack-up chain can be found in DMG graph and be expressed in Eq. 3.2.
II AB I XA XB =∆ +∆ ∆ (3.2)
Figure 3.2 Inter-setup tolerance stack-up
Without losing generality, it is assumed that the manufacturing plan consists of X setups and the tolerance stack-up chain for machining feature j in setup X1