Understanding traders' regional arbitage : the
case of rice traders in Antananarivo,
Madagascar
著者
Arimoto Yutaka, Kono Hisaki, Ralandison
Tsilavo, Sakurai Takeshi, Takahashi Kazushi
権利
Copyrights 日本貿易振興機構(ジェトロ)アジア
経済研究所 / Institute of Developing
Economies, Japan External Trade Organization
(IDE-JETRO) http://www.ide.go.jp
journal or
publication title
IDE Discussion Paper
volume
505
year
2015-03-01
INSTITUTE OF DEVELOPING ECONOMIES
IDE Discussion Papers are preliminary materials circulated
to stimulate discussions and critical comments
Keywords:
regional arbitrage, market integration, information friction, price information, searchJEL classification:
L81, O13, Q13
* Development Studies Center, IDE ([email protected])
IDE DISCUSSION PAPER No. 505
Understanding traders’ regional arbitrage:
The case of rice traders in Antananarivo, Madagascar
Yutaka Arimoto, Hisaki Kono, Tsilavo Ralandison,
Takeshi Sakurai, Kazushi Takahashi
March 2015
Abstract
Many studies find that agricultural markets in developing countries are poorly integrated spatially. Traders’ regional arbitrage plays a key role in integrating markets across space. We investigate the performance of regional arbitrage and the associated obstacles for rice traders in Antananarivo, Madagascar. On the basis of a trader-level biweekly survey spanning 2012–2013, we find that traders are not fully exploiting the regional arbitrage opportunities: most of them fail to purchase from the cheapest district and are paying higher prices than those in the cheapest district. One apparent obstacle is obtaining price information from many different regions. To reduce search costs, we provided regional price information via SMS to randomly selected traders, but found that this had a null-effect on improving arbitrage performance. Traders tend to concentrate on trading with a few fixed districts, even if they are informed about cheaper prices in other new districts, because they worry about quality uncertainty and the trustworthiness of new partners. These findings suggest that not only transmission of price information but also issues related to produce quality and matching prevent the performance of arbitrage and market integration.
The Institute of Developing Economies (IDE) is a semigovernmental,
nonpartisan, nonprofit research institute, founded in 1958. The Institute
merged with the Japan External Trade Organization (JETRO) on July 1, 1998.
The Institute conducts basic and comprehensive studies on economic and
related affairs in all developing countries and regions, including Asia, the
Middle East, Africa, Latin America, Oceania, and Eastern Europe.
The views expressed in this publication are those of the author(s). Publication does not imply endorsement by the Institute of Developing Economies of any of the views expressed within.
INSTITUTE OF DEVELOPING ECONOMIES (IDE), JETRO
3-2-2, WAKABA,MIHAMA-KU,CHIBA-SHI
CHIBA 261-8545, JAPAN
©2015 by Institute of Developing Economies, JETRO
No part of this publication may be reproduced without the prior permission of the
IDE-JETRO.
1
Understanding traders’ regional arbitrage
The case of rice traders in Antananarivo, Madagascar
*Yutaka Arimotoa, Hisaki Konob, Tsilavo Ralandisonc, Takeshi Sakuraid, Kazushi Takahashie,
aInstitute of Developing Economies-Japan External Trade Organization (IDE-JETRO) (Email: [email protected]) bDepartment of Economics, Kyoto University (Email: [email protected])
cInstitut Superieur de Technologie d’Antananarivo (Email: [email protected])
dDepartment of Agricultural and Resource Economics, University of Tokyo (Email: [email protected]) e Institute of Developing Economies-Japan External Trade Organization (IDE-JETRO) (Email: [email protected])
March 18, 2015 Abstract
Many studies find that agricultural markets in developing countries are poorly integrated spatially. Traders’ regional arbitrage plays a key role in integrating markets across space. We investigate the performance of regional arbitrage and the associated obstacles for rice traders in Antananarivo, Madagascar. On the basis of a trader-level biweekly survey spanning 2012–2013, we find that traders are not fully exploiting the regional arbitrage opportunities: most of them fail to purchase from the cheapest district and are paying higher prices than those in the cheapest district. One apparent obstacle is obtaining price information from many different regions. To reduce search costs, we provided regional price information via SMS to randomly selected traders, but found that this had a null-effect on improving arbitrage performance. Traders tend to concentrate on trading with a few fixed districts, even if they are informed about cheaper prices in other new districts, because they worry about quality uncertainty and the trustworthiness of new partners. These findings suggest that not only transmission of price information but also issues related to produce quality and matching prevent the performance of arbitrage and market integration.
Keywords: regional arbitrage, market integration, information friction, price information, search JEL code: L81, O13, Q13
* This survey was conducted as part of rice market studies in Madagascar for the Project for Rice
Productivity Improvement in Central Highland (PAPRIZ) implemented by the Japan International Cooperation Agency (JICA). We are grateful to project experts and the staff at the JICA Madagascar office. This paper was financially supported by Hitotsubashi University, the Institute of Developing Economies-Japan External Trade Organization, and JSPS KAKENHI Grant Numbers 22223003 and 25245038.
2
1.
Introduction
A well-functioning agricultural market is vital for efficient marketing and distribution of food across time and space. When markets function well, prices would signal surpluses and deficiencies across regions, and induce traders to arbitrage. Through arbitrage, markets eventually clear and prices converge across regions to form the law-of-one-price. Well-integrated markets also enhance social welfare: on the production side, they provide outlets for local food production surpluses, preventing drops in food prices and thereby fostering incentives for producers to adopt new technology to increase food production and their income. On the consumption side, well-integrated markets protect consumers from local supply shocks by facilitating trade across spaces, leading to price stability (Moser et al. 2009).
Many studies, however, find that agricultural markets are only partially integrated spatially (see for example Fackler and Goodwin 2001, and Sexton et al. 1991). A number of obstacles can raise transaction costs and prevent the full integration of agricultural markets. Among those, the availability of market information is often cited as one of the most crucial factors determining market disintegration. Indeed, a study of regional rice markets in Philippines indicates that the presence of substantial information frictions leads to the failure of arbitrage (Allen 2014). One promising technical solution to this issue is the expansion of mobile phone networks (see Aker and Mbiti 2010, and Nakasone et al. 2014 for a review). Evidence indicates that mobile phone coverage is associated with regional price convergence (Jensen 2007, 2010; Aker 2010; Aker and Fafchamps forthcoming) and increased search activity of agricultural traders (Tack and Aker 2014)2. A growing number of studies have used randomized controlled trials (RCTs) to examine the impact of providing market information to farmers through mobile phones3. For example, Fafchamps and Minten (2012) report positive effects on spatial arbitrage by traders’ selling at distant wholesale markets rather than at the farm-gate in India, but find no effect on price received. Nakasone (2014) finds that treated farmers obtained higher sales prices in Peru; however, no such effect was found in Colombia (Camacho and Conover 2011).
Although these experimental studies are informative, they focus only on producers, not on the traders who play a major role in trade across regions. Moreover, not much is known about even the basic facts of traders’ arbitrage itself, despite it being a fundamental economic activity. Since spatial market integration can be achieved through countless transactions across space by traders who are motivated by profit maximization via exploiting arbitrage opportunities, understanding how and how well traders make actual transactions across space is critically important for determining the barriers
2 See also Goyal (2010) for evidence that the regional dispersion of soybean prices decreased after
the establishment of internet kiosks that provide wholesale price information to farmers in India.
3 In a non-experimental study, Svensson and Yanagizawa (2009) report that the market information
broadcasted through the radio is associated with increased sales prices for farmers in Uganda. Using a matching method, Courtois and Subervie (forthcoming) find that farmers with access to a
3
of market integration and formulating policies to improve the efficiency of agricultural markets. The purpose of this study is to investigate the performance of traders’ regional arbitrage and the potential obstacles that prevent traders’ from making better arbitrage, where the arbitrage performance is measured by whether a trader purchased from the cheapest district and the gap between the price paid and the price in the cheapest district. In particular, we attempt to answer the following questions: To what regional extent do traders search and trade? How and how extensively do they obtain price information in various regions? Are they fully exploiting arbitrage opportunities? What prevents them from making a better arbitrage? Does provision of price information improve arbitrage performance?
To elucidate trader’s behavior in practice, we study the case of rice traders in Madagascar. While rice is the country’s most important staple food, the Malagasy rice market is known to be spatially disintegrated, exhibiting large price dispersion over time and space. Mendoza and Randrianarisoa (1998) found that, in 1996–97, only 8.8% of wholesalers made purchases from areas that were more than 100 km away. Evidence based on the 2001 national census of communes (counties) indicates that rice markets in Madagascar were relatively well integrated spatially only at the subregion level, but not at the provincial or national level (Moser et al. 2009). Furthermore, the average probability of interprovincial integration of rice markets is only approximately 56%, though the degree of integration varies largely across provinces (Butler and Moser 2010). Studies exploiting weekly district-level price data after the mid-2000s find that the degree of market integration is improving (Miyake and Sakurai 2012), but at the same time, markets have yet to be well integrated even between cities near the national capital (Arimoto et al. 2014). Thus, there seems to be significant scope for better arbitrage.
We collected detailed data on rice trading for 224 rice traders based in the Greater Antananarivo Area formed by the city center and suburb (also referred to as “Tana,” the capital of Madagascar). The data covered one year from August 2012 to August 2013, biweekly (every two weeks) for 27 rounds. Additionally, to rigorously examine whether information friction is the key factor affecting successful arbitrage, we implemented an RCT, whereby half of the randomly selected sample traders were sent price information in 10 major rice-producing districts via SMS halfway through the survey.
Our main findings can be summarized as follows. First, there is indeed scope for better arbitrage: many traders purchase rice from districts where prices, including transportation costs, were not the cheapest, and are paying much higher prices than those charged in the cheapest district. For example, of the traders visiting other districts to purchase the most common variety of rice (Vary gasy), only
8% of the trader–round observations saw traders make purchases in the cheapest district, and the average price paid was 17% higher than the median price in the cheapest district. Second, most traders specialize in trading with few common districts, where they regularly visit and purchase from
4
the same trading partners, even though these districts do not always have the lowest prices. Third, traders are often “price blind,” meaning that they know little about prices in districts other than those in which they usually make purchases. Moreover, their knowledge on price is concentrated in few districts. Fourth, our intervention to provide regional price information had a null-effect on purchasing behavior and arbitrage performance. Fifth, in addition to price, traders were concerned about product quality and matching with trustworthy sellers. We also found that before traders start visiting a new district, they usually establish a “link” to that district by purchasing from sellers who come to sell in Tana, or asking a mediator for an introduction.
These findings imply that traders are not fully exploiting the arbitrage opportunities, and the provision of price information alone is not effective in improving the situation. This is because traders are also concerned about non-price issues, which they overcome by limiting their trading districts to those in which they have “links.” Traders cannot visit a new district without this “link” and therefore pass up the opportunities of better arbitrage even if they are informed about cheaper districts.
This study adds to our knowledge on agricultural traders’ arbitrage and marketing activities in the following ways: First, to the best of our knowledge, this is the first study that directly investigates traders’ arbitrage and quantifies its performance in a systematic way. Second, we contribute to the understanding of the barriers of rice market integration in Madagascar. As discussed previously, existing studies have repeatedly reported that Malagasy rice markets are spatially disintegrated (Moser et al. 2009; Butler and Moser 2010; Miyake and Sakurai 2012; Arimoto et al. 2014). We support this finding by adding a direct micro-foundation that the basis of market integration, traders’ arbitrage, is imperfect. Third, we provide additional evidence on the impact of providing price information on arbitrage in developing countries. Unlike previous experimental studies that provided information to farmers (Fafchamps and Minten 2012; Nakasone 2014; Camacho and Conover 2011), we disseminate information to traders. Since traders are specialized in trading and arbitrage and bear the fundamental role in both regional marketing and distribution of the agricultural products, we believe that the provision price information to traders is more relevant for the understanding of agricultural market integration.
The paper is organized as follows. Section 2 describes the survey and data. Section 3 presents descriptive evidence that traders are not fully exploiting existing arbitrage opportunities and discusses potential obstacles. Section 4 reports the results of the RCT and discusses why the provision of price information was not effective. Finally, Section 5 provides conclusions.
5
2.
Survey and data
2.1. Surveys
The subjects of our survey are rice traders operating in Tana, Madagascar. Since we are interested in regional arbitrage, the population of focus is the rice traders who engage in inter-district rice trade (i.e., trade between Tana and districts outside Tana)4.
The survey was conducted from June 2012 through August 2013. To create a list of rice traders, we first identified the geographical cluster offering a high probability of finding rice traders engaged in inter-district trade. We selected 44 out of 192 wards in the city center, and 17 out of a total of 40 communes in the suburb based on five criteria5. We then created a list of rice traders by visiting markets and key informants in these clusters6. All the listed traders were then visited, and we confirmed whether they engaged in inter-district trade. We ended up with a list of 318 inter-district rice traders.
In July 2012, we conducted a baseline survey to collect general information about the characteristics of these traders and their trading activities. Out of the 318 listed traders, 241 (76%) agreed to cooperate and completed the baseline survey. Then, we conducted periodic surveys every two weeks between August 6, 2012 and August 13, 2013, making 27 rounds in total. The periodic survey collected information on the following: (1) price searches; (2) details of all rice purchases, including information on district of purchase, transportation, price, and payment; and (3) management indicators such as stock, quantities of purchases and sales, average price and margin, and costs. Of the 241 traders who completed the baseline survey, 234 initially agreed to participate in the periodic survey, but 10 dropped before completion of all rounds. Our final number of sampled traders is thus 224 and the number of observation at the trader–round level is 6,0337.
Finally, we conducted a follow-up survey in February 2014 to collect additional information after
4 Rice traders such as retailers who only purchase from wholesalers or farmers in Tana and sell at
retail are not considered as potential subjects because they are not likely to participate in inter-regional arbitrage.
5 The five criteria are (1) wards where the city’s main wholesale markets (Anosibe Andrefana and
Andravoahangy Tsena) are located (2 wards), (2) wards surrounding those two markets where rice traders most likely own a shop and/or live (10 wards), (3) wards in which there is a market managed by Antananarivo city government (32 wards), (4) communes where traders reside according to the list of registered traders and wholesalers provided by the National Statistics Institute (Institut National de la Statistique or INSTAT, in French) (12 communes), and (5) communes located along the national highways that are potentially active in rice trading (5 communes).
6 The list of traders was made by (1) visiting the ward markets for Antananarivo city and the largest
markets in the commune for the suburbs, and listing all rice traders
(retailers/wholesalers/traders/millers) operating in these markets; (2) visiting ward and municipality officials to introduce us to the largest rice traders that they know in their area, including wholesalers, collectors, and millers; (3) visiting millers and asking for information about traders based in the ward and municipality.
7 The total number of observations at the trader–round level should be 224 27 6,044. We had
6
preliminary analyses of the periodic survey. We obtained responses from 219 out of 224 traders who completed the periodic survey.
2.2. Intervention
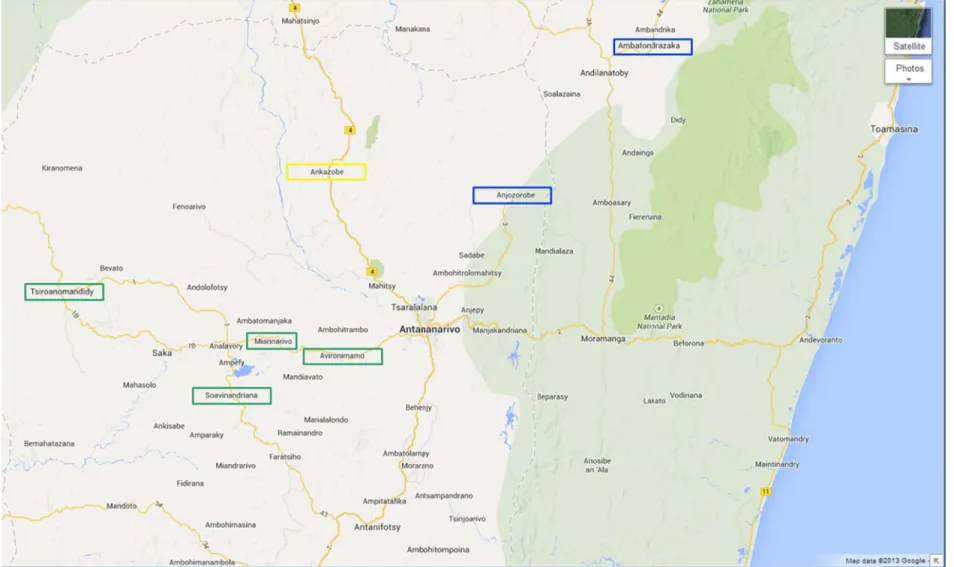
Since information friction is considered as one of the major obstacles to efficient arbitrage, we experimentally filled the information gap by sending regional price information via SMS to half (112 out of 224) of the randomly selected traders after round 16 (out of 27) of the periodic survey. The SMS was sent on Wednesday each week. The information sent was the local price of milled rice at millers for the previous week8, collected by Madagascar’s Rice Observatory (Observatoire du riz or OdR, in French), a government agency responsible for collecting and disseminating agricultural commodity price information. We sent prices in the 10 most major rice-producing districts (Arivonimamo, Miarinarivo, Tsiroanomandidy, Ankazobe, Ambatondrazaka, Mahabo, Bealanana, Befandriana, Mandritsara, and Marovoay), which include distant districts in Sofia region where prices are generally quite cheaper than those in the major purchasing districts near Tana (see Figure 1 and Figure 2 for map of Madagascar). We expected that this information would trigger trade with new districts.
== Figure 1. Map of Madagascar (regions) == == Figure 2. Map of Madagascar (districts) ==
2.3. Modes of purchase
We classify traders’ mode of purchase into three categories: (1) active inter-district trade, (2) passive inter-district trade, and (3) within-Tana trade. Inter-district trades are those between Tana and districts outside Tana. Active inter-district trades are purchases made outside Tana by traders actively
visiting other districts9. On the other hand, passive inter-district trades are purchases made in Tana
from sellers (trucks) who came from other districts to sell in Tana. Such purchases may take place at the traders’ store where sellers regularly come directly, or at the parking areas at major wholesale markets in the city center such as the Anosibe and Andravoahangy markets. On the other hand, within-Tana trades are those that do not directly incorporate inter-district trade but instead (1) purchase at the Anosibe market; (2) purchase at the Andravoahangy market; and/or (3) purchase
8 OdR agents collect the rice price for week 1 from Monday to Saturday. Information is then sent to
the OdR headquarter in Tana by Monday of week 2. We receive the information from OdR Tana on Tuesday evening or the latest on Wednesday morning. Therefore, we are able to send the information to traders every Wednesday.
7
from local sellers in Tana such as farmers10, wholesalers, and millers. These three modes are not mutually exclusive, and most active inter-district traders engage in both passive inter-district trade and within-Tana trade.
Note that passive inter-district trade and within-Tana trade are conducted in Tana. From the traders’ perspective on where to make a purchase, these two modes are alternatives once they decide to
purchase in Tana (i.e., do not visit districts outside Tana). 2.4. Price of rice
We classify the varieties of rice into the following five categories: Vary gasy, Tsipala, Makalioka,
imported rice, and unknown11. Vary gasy and Tsipala are the major common varieties. Makalioka is considered to be high grade and is the most expensive rice, mainly produced around Ambatondrazaka district (Alaotra-Mangoro region). Imported rice constitutes low-grade rice in Madagascar and usually comes from Pakistan or India.
To be able to compare prices across districts, we converted all observed purchase prices to the
adjusted milled-rice equivalent price (hereafter, referred to as “adjusted ME-price”), which represent
the cost of purchasing 1 kg of milled rice, including transportation costs to Tana (recall that our sample traders are all based and operating in Tana) and milling fees, with adjustment for price differences between paddy and milled rice (see Appendix A for details). When we discuss regional price differences, we represent the district price by the median of actual prices paid by our sample traders for each variety at each survey round in each district.
2.5. Measures of arbitrage performance
We construct two indicators to measure arbitrage performance at the trader transaction (purchase) level. Since our sample traders are based and operating in Tana, we regard that their sales prices are similar; thus, we concentrate on purchase price. For each trader, we identified the cheapest purchase within round–activity (active or passive)–variety12. In total, we have 14,422 trader–round–activity– variety level observations.
The first performance measure is a dummy variable indicating whether a trader purchased from the cheapest district for the same round–activity–variety. The second measure is the actual–optimal
10 Rice cultivation is still common in Tana.
11 Vary gasy literally means Malagasy rice, and includes any locally produced rice other than Tsipala
and Makalioka. Some are improved varieties introduced from outside the country, but their origins are not known. On the other hand, Tsipala and Makalioka are more specific although they do not seem to be single varieties in the agronomic sense. We assume that both are improved varieties introduced by donors or the Ministry of Agriculture. Their appearances are quite different and they are easily distinguished in the market: Tsipala is relatively short and round, while Makalioka is relatively long.
12 Some traders purchased rice from multiple districts. In such cases, we selected the cheapest
8 price ratio , defined as
∗ ,
where is the actual adjusted ME-price paid for the cheapest purchase by trader in round for activity in purchases for variety , and ∗ is the median of actual observed adjusted
ME-prices in the cheapest district for the same round–activity–variety. The larger the value of ,
the greater is the gap between the optimum price and the actual purchase price—an indication of potential scope for better arbitrage. In both measures, for passive inter-district purchases, we count three modes of within-Tana trades (purchase at the Anosibe market, purchase at the Andravoahangy market, and purchase from local sellers in Tana) as “districts,” since these are good alternatives for purchase in Tana.
3.
Descriptive statistics
3.1. Characteristics of the sample traders
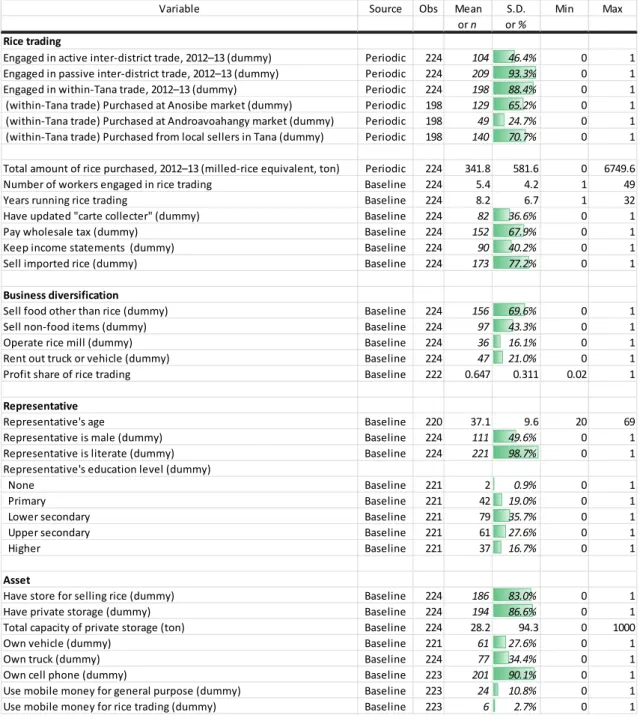
Table 1 reports the summary statistics of the study subjects. Out of 224 sampled traders, 104
(46%) engaged in active inter-district trade, 209 (93%) engaged in passive inter-district trade13, and 91 (41%) engaged in within-Tana trade during the one-year period survey. The average annual milled-rice equivalent volume of rice purchased was 341.8 (SD = 581.6) ton. The sample traders had 8.2 (SD = 6.7) years of experience in rice trading. The business is somewhat diversified: 43% of the traders also dealt with non-food items, 16% operated a rice mill, and 21% rented out a truck or vehicle. As a result, the mean profit share of rice trading was 0.647 (SD = 0.311). The mean age of the representatives was 37.1 (SD = 9.6). Half (50%) of the sample traders are male and they are almost completely (99%) literate. Regarding assets, more than 80% of the traders have a store to sell rice and a private storage facility with a mean capacity of 28.2 (SD = 94.3) ton. Furthermore, 34% of the traders own a truck and 28% own a vehicle. They usually (90%) have a mobile phone.
== Table 1. Summary statistics of sample traders ==
3.2. Regional extent of inter-district trade
We define the scope of spatial arbitrage on the basis of districts where we observe actual trade by
13 Out of 104 active inter-district traders, 91 (88%, or 41% among all traders) also engaged in
9
our sample traders. Observing actual purchases suggested that trade with that district was practically feasible and profitable, while districts without observed purchases were likely ones in which trade was not reasonable.
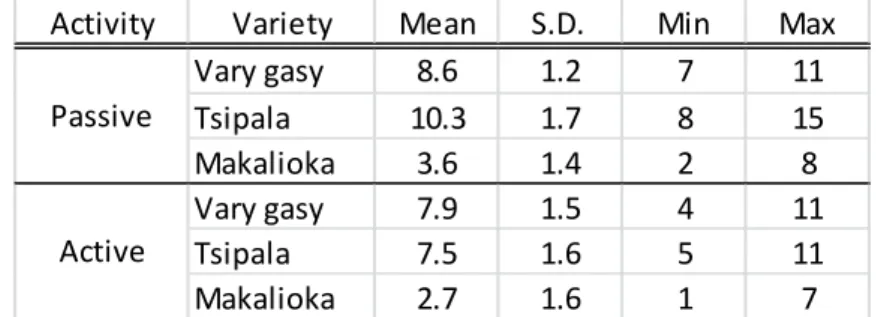
Table 2 reports the summary statistics of the number of different districts where we observed
actual purchases for inter-district trade, by round–activity–variety. Averaged over 27 rounds, for passive purchases, Vary gasy was purchased from sellers who came from 8.6 different-origin districts, Tsipala was purchased from those who came from 10.3 districts, and Makalioka was purchased from those who came from 3.6 districts, in the same round. Districts where rice was purchased by active inter-district trade were less diverse: Vary gasy was purchased from 7.9, Tsipala from 7.5, and Makalioka from 2.7 different districts on average. The number of different districts from which Makalioka is purchased is small because it is grown in a limited number of regions.
== Table 2. Number of different districts purchased from in inter-district trade ==
3.3. Arbitrage performance
Table 3 reports the summary statistics of arbitrage performance. We limit our attention to the most
common varieties, namely, Vary gasy, Tsipala, and Makalioka. In only 11.6% of the total observations, the purchase was made from the cheapest district (Panel A).
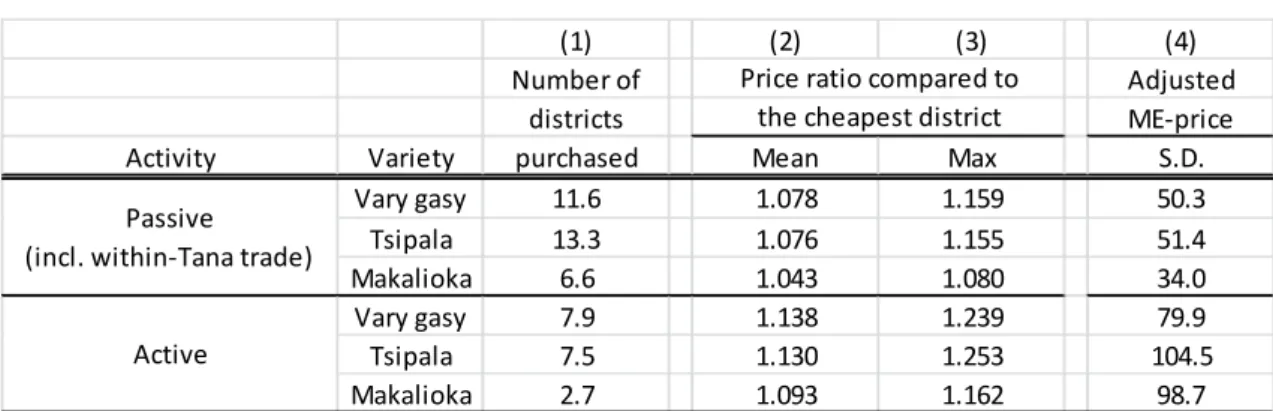
Table 4 shows the degree to which traders pay more if they fail to purchase from the cheapest
district. The table reports the mean and maximum of the district-level ratio of price in each district to the price in the cheapest district, averaged over rounds14. Within the same round–variety, the price ratios for passive inter-district trade (including within-Tana trade) are 1.078 (max = 1.159) and 1.076 (max = 1.155) for Vary gasy and Tsipala, respectively. Similarly, the same price ratios are on average 1.138 (max = 1.239) and 1.130 (max = 1.253) for active Vary gasy and Tsipala purchases, respectively. This indicates that traders visiting the “wrong” district paid 14% to 13% higher prices than those visiting the cheapest district, on average.
== Table 3. Summary statistics on arbitrage performance == == Table 4. Price dispersion across purchase districts ==
Indeed, the actual–optimal price ratio at the transaction level (trader–round–activity–variety level) reported in Panel Bof Table 3 is 1.072, indicating that, on average, traders paid 7.2% higher
14 Statistics (mean, maximum, and S.D.) were calculated for each round–activity–variety (
27 2 3 162) first, and then averaged over 27 rounds.
10
prices than the median price in the cheapest district. The price premium is almost completely due to purchasing from a “wrong” district; if a trader purchased from the cheapest district, the average price premium is 0.5%.
Comparison between active and passive trades reveals that active purchases were relatively well targeted toward the cheapest district: the percentage of observations of purchases made from the cheapest districts, aggregating all varieties, is 18.7% for active vs. 10.2% for passive. However, the actual–optimal price premium is twice as large as that of passive purchases (1.128 for active vs. 1.061 for passive). This implies that although active purchases were well targeted, they were of lower performance than passive purchases. This is because the passive prices were relatively converged. The standard deviation of district-level prices within each round–activity–variety, averaged over rounds, is much smaller for passive trades than active trades (Table 4, column (4)). The relative convergence of passive prices is most likely due to competition in Tana. Therefore, the
choice of origin district to purchase from did not make a large difference in purchase prices. 3.4. Challenges for better arbitrage
We found that the under-performance of arbitrage is largely caused by failure to visit the cheapest, optimal district. To identify the optimal district, Appendix Tables A1 and A2 report the median adjusted ME-price in each district by round–activity–variety. For example, for active purchase for Tsipala, we found that Marovoay and districts in Sofia (Madritsara, Bealanana, and Mampikony) tended to be the cheapest in the earlier rounds, whereas Ambohidratrimo, Arivonimamo, Ankazobe, and Tsiroanomandidy became the optimal choice in later rounds.
The tables suggest two challenges for traders to fully exploit arbitrage opportunities. First, the cheapest district changes over time, and therefore, traders need to constantly track prices in several districts. Second, to fully exploit arbitrage opportunities, traders need to purchase from many different districts depending on the season. For active purchases, 11 different districts became the cheapest district at least once during the one-year survey period for Vary gasy and Tsipala, while 7 different districts became the cheapest at one point for Makalioka. Passive purchases were harder as traders needed to purchase from 14 districts (including two purchase modes of within-Tana trade) for Vary gasy, 12 for Tsipala, and 9 for Makalioka.
The first challenge calls for extensive searches, and the second challenge calls for traders to trade with many different districts. In the following subsections, we examine whether these two conditions were met.
3.5. Extent of search
11
whether the trader knew the purchasing price in 36 major rice-producing districts15. Table 5 reports the summary statistics. Searching for prices in these rice-producing districts was common, though not many districts were searched. At the trader level, 95% (213/224) of the traders searched for prices in the listed 36 districts at least once during the survey period. Among those who did search, the average number of districts where they knew the price was 5.1 (SD = 3.1). At the trader–round level (per round, or every two weeks), searches were conducted in 76% (4,599/6,033) of the observations, in which traders checked the price in 2.1 (SD = 1.8) districts, on average. Active traders were more likely to search than passive-only traders.
== Table 5. Price searches in 36 listed districts ==
Interestingly, traders’ knowledge on prices was concentrated in few common districts. For each round, we calculated the percentage of traders who searched for prices in each district, taking the total number of traders searched in that round as the denominator. Averaged over rounds, the most common district where traders knew the price was Antananarivo Renivohitra (79%), followed by Ambatondrazaka (46%), Miarinarivo (27%), Tsiroanomandidy (20%), and Ankazobe (19%). Therefore, many traders were “price-blind”; the extent of their knowledge on regional prices was limited.
3.6. Extent of trade
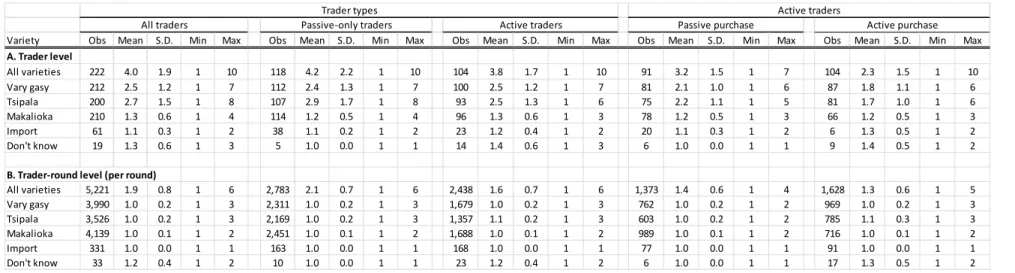
The second condition of making better arbitrage is to purchase from many different districts. We find that, in fact, traders tend to purchase from few fixed districts. Table 6 reports the summary statistics of the number of different purchase districts for inter-district trades. For active traders, we report the number of districts without distinguishing active and passive inter-district purchases, as well as the number of districts for active and passive purchases separately. Panel A of Table 6
indicates that on average, traders purchased from 4.0 different districts during the survey period. By variety, Vary gasy and Tsipala were purchased from 2.5 and 2.7 different districts, respectively.
Panel B of Table 6 reveals that, on average, traders purchased from 1.9 different districts per round,
but for each variety, traders purchased from only one district. There were no substantial differences between active and passive-only traders.
15 The 36 districts are all 22 region capitals and 14 major rice-producing districts in Boeny, Sofia,
Sava, and Diana regions. They are as follows: Antananarivo Renivohitra, Ankazobe, Antsirabe I, Tsiroanomandidy, Miarinarivo, Fianarantsoa I, Ambositra, Manakara, Farafangana, Ihosy, Toamasina I, Fenoarivo Atsinanana, Ambatondrazaka, Mahajanga I, Maevatanana, Marovoay, Port-Berge, Mandritsara, Befandriana Avaratra, Antsohihy, Bealanana, Maintirano, Mampikony, Toliara I, Morondava, Taolagnaro, Ambovombe, Sambava, Antsiranana I, Vohemar, Ambilobe, Ambanja, Other districts in Boeny, Other districts in Sofia, Other districts in Sava, and Other districts in Diana. We decided to specify these districts to help improve traders’ memory during interviews.
12
== Table 6. Summary statistics of the number of districts purchased ==
A more detailed examination of the data depicts that at the trader level, 62% of passive-only traders and 60% of active traders purchased Vary gasy from at most two different districts throughout the year. Similarly, 46% of passive-only traders and 58% of active traders did so for Tsipala. For the purchase of Makalioka, 80% of the passive-only traders and 70% of the active traders purchased from only one district, which was almost exclusively Ambatondrazaka, the major production region of Makalioka. At the trader–round level, almost all traders concentrated on purchasing each variety from a single district. These facts imply that more than half of the traders switched between only two districts per variety throughout the year.
Traders not only tend to operate in only a few districts, but these districts tend to be common across traders. Tables A3–A6 in the Appendix report the percentages of traders who purchased from each district, taking the total trader–district observations for each round–activity–variety as the denominator. Districts attracting more traders per round are highlighted in dark red. We immediately recognize that the traders’ purchases were concentrated in two to three districts for active inter-district trade. Origin districts for passive purchases (including within-Tana trades) were relatively more dispersed, but still concentrated in around four districts.
These common districts were, however, not always the cheapest districts to purchase in. In Tables
A3–A6, we used bold squares to mark the cheapest district on the basis of median adjusted ME-price
for each round. If these squares match with darker red areas, then it indicates that many traders were indeed purchasing from the cheapest district. For active–Vary gasy purchases, Tsiroanomandidy, which turned out to be the cheapest in 4 out of 27 rounds, did attract many traders. However, other common districts such as Arivonimamo and Anjozorobe were each cheapest for only one round. Frequently cheapest districts such as Ankazobe (cheapest in six rounds), or Maevatanana and Ambatondrazaka (cheapest in five rounds) were not so popular. Active–Tsipala purchases were slightly well targeted, where the top three popular districts (Arivonimamo, Tsiroanomandidy, and Ambohidratrimo) were the cheapest in 11 out of 27 rounds. However, not many traders visited the northern regions such as Marovoay, Mandritsara, Bealanana, and Mampikony, which was found to be the cheapest district in the earlier rounds. Passive purchases were also not well targeted; the top four popular origins (Arivonimamo, Anjozorobe, Tsiroanomandidy, and Anosibe markets) were the cheapest for only six and seven rounds for Vary gasy and Tsipala, respectively.
3.7. Constraints on trading with new districts
Why do traders trade with a limited number of districts? In the follow-up survey, we asked about the difficulty and constraints of starting to visit a new district.
13
Nearly 60% of the traders felt some difficulties in starting to visit new districts. In response to the question “How hard is it to start visiting a new district you have never visited before?,” 42 among 209 valid responses (20%) replied “very hard” and 80 (38%) replied “somewhat hard.”16
Table 7 reports the obstacles to start visiting a new district, determined by asking the traders to
provide three reasons. In aggregate, we obtained 582 valid responses. “Finding a trustworthy trading partner” was the most mentioned obstacle (25%), followed by “obtaining price information” (21%), “quality, variety, characteristics are uncertain” (16%), “safety” (16%), “collect necessary quantity” (10%), “lack of experience” (7%), and “payment will be inflexible/unable to purchase on credit” (3%).
== Table 7. Obstacles to starting to visit a new district ==
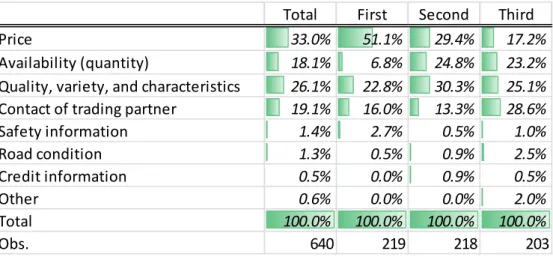
Table 8 reports answers regarding the most important information needed to start visiting a new
district. Again, we asked the traders to offer three reasons. Price information is indeed the most important information, comprising 33% out of the 640 aggregate valid responses. It is, however, not a single decisive factor. In fact, traders are also aware of “quality, variety, and characteristics” (26%), “contact of trading partner” (19%), and “availability (quantity) of rice” (18%).
== Table 8. Most valuable information when starting to trade with a new district ==
In summary, descriptive evidence revealed that many traders are “price-blind,” despite considering price information as the major constraint and also most important to start visiting a new district to exploit arbitrage opportunities. This suggests that information friction is indeed one of the major potential factors that prevent better arbitrage. In the next section, we examine whether eliminating this friction improves the situation.
4.
Impact of providing price information on arbitrage performance
In this section, we examine the impact of our price information provision on traders’ behavior and arbitrage performance. We estimate the following simple difference-in-differences (DID) regression:
TREAT AFTER TREAT AFTER ,
where TREAT is the dummy indicating that the trader was sent an SMS, and AFTER is the
16 The remaining responses were “Neither hard nor easy” (
n = 60, 29%), “Somewhat easy” (n = 19,
14
dummy indicating rounds after intervention. The coefficient of interest is , which captures the average treatment effect of our intervention.
4.1. Results
The randomization was mostly successful; most of the differences in pre-intervention characteristics between the treatment and control groups were statistically insignificant (Appendix
Table A7), except that traders in the treatment group were more likely to search (control 72% vs.
treatment 80%, p < 0.001) though the number of district searched is slightly smaller (control 1.8 vs.
treatment 1.6, p < 0.001), engage in more active inter-district trade (control 24% vs. treatment 33%, p < 0.001)17 and visit more districts (control 1.9 vs. 2.1, p = 0.044), but passively purchase from
smaller number of districts (control 1.9 vs. 1.8, p = 0.024).
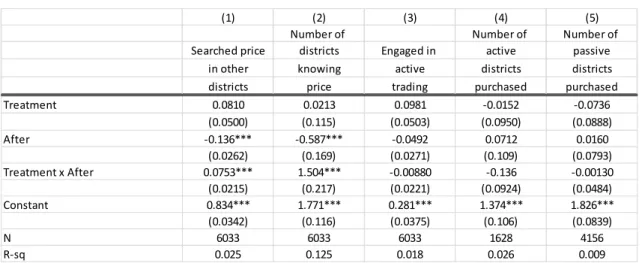
Table 9 reports the estimates for search and purchasing. The unit of observation is trader–round.
The DID estimate ( ) is positive and significant for whether a trader searched for price in other districts (column 1) and the number of districts for which prices were known (column 2). This implies that the intervention successfully improved the traders’ knowledge of prices in diverse districts. However, the intervention had no impact on purchasing behavior. The treated traders did not engage in increased active trading after intervention (column 3), and the number of districts purchased from in each round did not increase (columns 4 and 5).
== Table 9. SMS treatment effects for search and purchasing ==
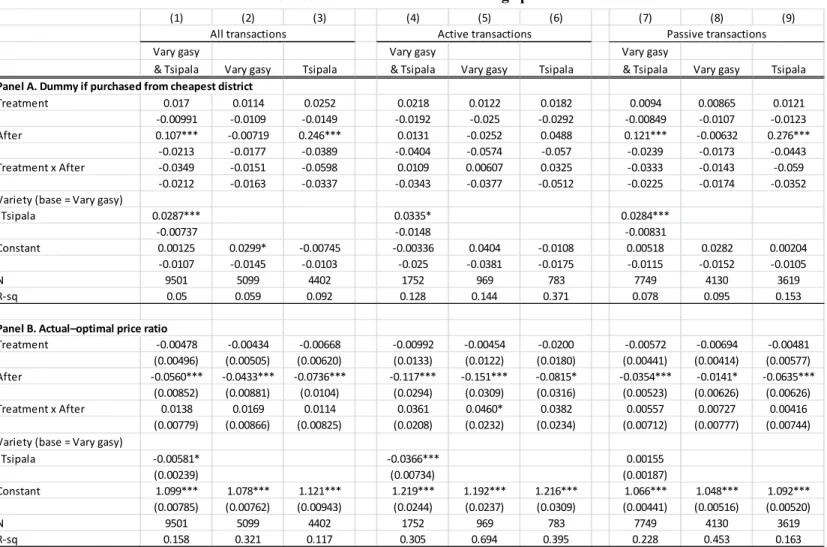
Table 10 reports the estimates for arbitrage performance. The unit of observation is trader–round–
activity–variety. We find no statistically significant impact on either purchases from the cheapest district or actual–optimal price ratio, except for a positive coefficient for actual–optimal price ratio
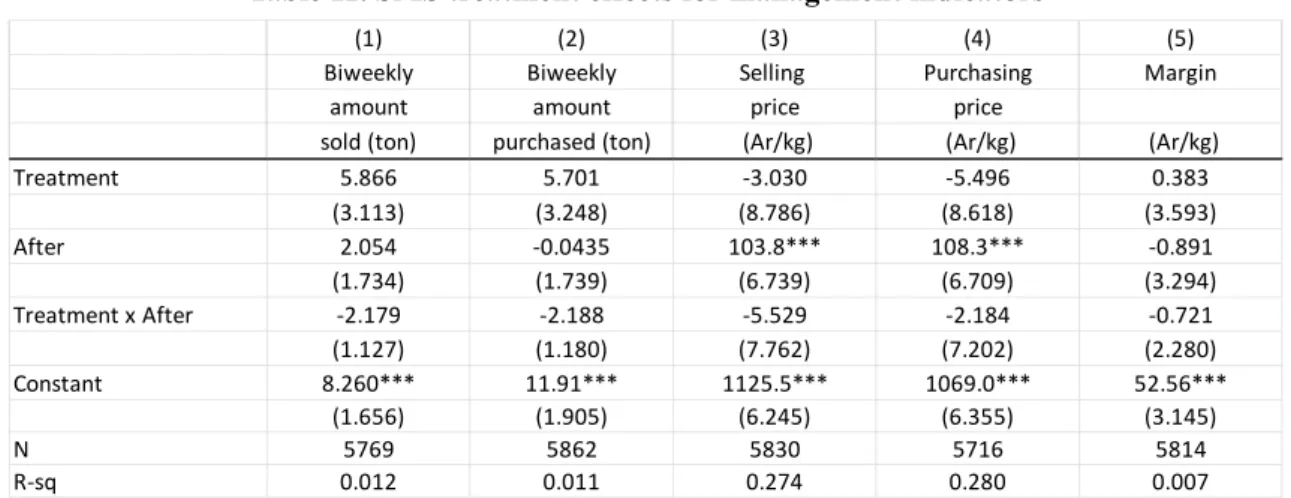
for active–Vary gasy purchase, implying that the intervention worsened the arbitrage performance. As a consequence, the provision of price information had no impact on profits. For each round, we obtained a crude measure of management indicators by asking the overall quantity and average price of purchases and sales, and margins. The estimates reported in Table 11 indicate that the intervention had no impact on quantity and price of purchases and sales, and margin.
== Table 10. SMS treatment effects for arbitrage performance == == Table 11. SMS treatment effects for management indicators ==
17 To deal with these systematic differences between treatment and control groups, we conducted the
following estimations with trader fixed-effects. The results reported in the Online Appendix were significantly similar to those obtained without using trader fixed-effects.
15 4.2. Discussion
Why did the provision of price information not alter traders’ behavior and improve arbitrage performance? In a follow-up survey, we asked a number of questions to understand why the intervention had no impact.
The first possible reason and also a potential limitation of this study is that the price information provided was not sufficiently reliable or timely. We asked how the traders utilized the information. Of the 219 respondents of the follow-up survey, 107 (49%) were in the treatment group but only 95 (43%) actually received the price information18. Among these 95 traders, only 2 (2%) used it to visit new districts. However, price information was used in some other ways; 31 (33%) passed the information to others, 42 (44%) used it to check the adequacy of prices, and 18 (19%) used it to negotiate a price with a seller. This suggests that the information was considered valuable, but not sufficient to motivate a visit to a new district.
Why was the information not used for a visit to a new district? Table 12 summarizes the responses to our asking for three reasons from those who received the information but did not use it to visit a new district (N = 93). In aggregate, we obtained 184 valid responses. Ignoring the rank of responses,
one of the major reasons indicated was the inadequacy of the supplied information: “information was not reliable” (32%), “price may change during travel or transportation” (21%), and “information was not timely” (14%).
== Table 12. Reasons for not using SMS price information to visit anew district ==
These responses are understandable given that cheap districts (mostly in Sofia region) are often far away and the road conditions are so poor that it takes several days or even weeks to make a round trip. Traders may care about road conditions because car parts wear easily with bad roads, thus increasing maintenance costs.
Discussions with the traders also made us aware of the possibility of underestimating the effective prices in distant districts because of opportunity costs. For example, districts in Sofia region take at least one or two weeks to make a round trip. In contrast, popular proximate districts such as Arivonimamo, Tsiroanomandidy, and Anjozorobe can be visited within 3–7 days. This implies that traders can visit these districts twice for the same amount of time it would take to visit Sofia region once. Time taken for purchases is critical since traders seek to buy and sell as soon as possible to speed up capital turnover. Although direct transportation costs are captured in our prices, these hidden opportunity costs are not well accounted for, and the effective prices in Sofia region may be much higher than the prices used in the analyses. The prices provided were also one-week lagged.
18 The major reasons for those not receiving the information were changes in phone number and
16
In any case, this is unfortunate given that the prices we provided are by far the most detailed, updated, systematically collected, and reliable publicly available information that one can obtain in Madagascar. The prices provided are those at each district’s millers and we believe that they do reflect local wholesale prices. However, some traders who deeply search into remote villages and purchase at farm-gates might feel that the provided prices were not sufficiently informative.
We are more interested in the second possible reason that stops traders from readily visiting a new district. We have already seen in section 3.6 that traders continue to visit few fixed districts (Table 6), and more than half of the traders traded with only two districts per rice variety. Table 12 adds to this by revealing that the third most indicated reason in aggregate (and next most frequently indicated primary reason) for not using the provided price information to visit a new region was that the respondents only buy from fixed place/seller (11% in aggregate, or 21% among those providing this as their first reason). This indicates that traders will forgo the arbitrage opportunity and stay with familiar trading partners, even if they are informed about a cheaper price in a new district.
Why do traders continue to visit the same fixed districts? Section 3.7 discussed the constraints on visiting a new district; nearly 60% of the traders expressed having some difficulty in starting to visit a new district, and non-price issues such as finding a trustworthy trading partner, quality uncertainty, and safety were cited as the major obstacles (Table 7). While traders considered price as the most important information needed to start a visit to a new area, information on quality, variety, and characteristics, contact information on a potential trading partner, and availability of rice were also essential (Table 8). These facts imply that lack of price information is not the only decisive factor that prevents traders from visiting a new area.
The follow-up survey also revealed that traders had established a “link” before they started actively visiting the most frequently visited district. Of the 90 active inter-district traders who replied to the follow-up survey, 46 (51%) answered that they had purchased from a seller from that district in Tana before actually visiting there by themselves. This “trial purchase” could serve as a device to check the produce quality as well as to collect information on potential sellers and their trustworthiness in that district. Moreover, 74 (82%) indicated that they were introduced by a mediator during the first visit, who was a friend/relative in that district (63%), retailer/wholesaler/trader in Tana (28%), or seller/trader from that district (8%).
Once traders are “linked” to a destination, they tend to continuously and exclusively trade with fixed trading partners. Of the active traders, 93% (84/90) replied that they “always” (57%), “most of the time” (32%), or “sometimes” (4%) purchase from the same trading partners. The average number of partners whom traders contact in the most frequently visited district is 4.0 (SD = 5.5), where these partners are collectors/agents (39%, 33/84), farmers (38%), or millers (23%).
17
relationships are crucial. First, as there are so many collectors19, farmers typically prefer to sell to a familiar buyer over an unfamiliar one, so that local buyers who make frequent visits to the villages have the advantage of getting the produce first. To compete with these local buyers, traders in Tana need to make frequent visits and maintain regular relationships. Second, having a regular and trustworthy trading partner is very important in ensuring a secure supply, as the trade does not occur in an open market but on an individual negotiation basis. Additionally, conflict resolution after a contract breach appears to be costly. To secure supply in quantity and quality, and to save time spent in remote villages for product collection, traders occasionally make an advance payment when they place an order20. Then, they visit the trading partner at a mutually agreed time for collecting the products. The problems that traders may encounter if the partner is not trustworthy are late delivery, poor quality product, side-selling, or even money loss (the partner disappears).
These findings suggest that traders cannot readily visit a new district because they are also concerned about quality uncertainty and matching with sellers. Traders are able to overcome these issues by concentrating on trading exclusively with only a few districts, where they establish a “link” by paying fixed costs before starting a visit.
5.
Concluding remarks
In this study, we investigated the performance of regional arbitrage and its potential obstacles for the rice traders in Antananarivo, Madagascar. Our major finding is that traders are not fully exploiting arbitrage opportunities, and providing price information alone does not improve the situation. When considering a visit to a new district, traders are concerned not only about price but also about produce quality and characteristics, matching with trustworthy sellers, and collecting the necessary quantity of produce. Traders tend to concentrate on trading with a few fixed districts, which are often “linked” by “trial purchases” from sellers in that district or asking a mediator for an introduction, before starting to visit there.
On the basis of these findings, we interpret that the key obstacle preventing better arbitrage and market integration is not only lack of access to price information but also non-price issues related to starting trade in a new district. Traders overcome these issues by trading exclusively with “linked” districts. Because there is a fixed cost to establish a “link,” traders cannot easily increase the number of the “links,” and without such “links,” they cannot readily spontaneously visit a new district in response to information transmitting cheaper prices. Since obtaining price information in unlinked districts is of little use, many traders do not have incentive to search extensively and therefore, become “price-blind.”
19 One trader said that many people entered the rice-collecting business because of the recent
availability of funds from a microfinance institution.
18
Our finding and interpretation are in line with Fafchamps and Minten (2001, 2002), who report that agricultural traders in Madagascar tend to narrow their extent and scope of trade. They emphasize trust-based relationships as the dominant contract-enforcement mechanism among grain traders, given that legal institutions do not play an important role in contract enforcement.
Moreover, our experimental results showing that the price information provision had no effect on arbitrage behavior and purchase prices add evidence supporting the notion that price information alone may not be sufficient to foster better arbitrage, as suggested by some previous studies (Fafchamps and Minten 2012; Camacho and Conover 2011). However, other studies do find a positive impact of price information provision on arbitrage and increased sales prices (Nakasone 2014; Svensson and Yanagizawa 2009). At the current stage of research, a micro–macro paradox seems to exist where several rigorous evidence based on RCTs indicate a null-effect or at least mixed evidence of market information provision at the micro level (i.e., farmers and traders), while the expansion of mobile phone networks does seem to foster market integration at the macro (regional) level (Jensen 2007; Aker 2010). Further study is required to identify the conditions in which price information provision improves arbitrage performance and market integration.
The policy implication derived from our findings and interpretations is that interventions that mitigate non-price issues or reduce the fixed cost of establishing a new link may foster better arbitrage and market integration. Standards, grading, and a certification system can mitigate the quality issue and enable smooth transactions without a trader needing to conduct a direct on-the-spot inspection. Issues related to matching can be resolved by opening a periodic market at fixed focal locations where sellers and buyers meet regularly.
We are aware of several limitations of our findings and interpretations. First, as discussed in detail in section 4.2, the null-effect of our intervention may be due to limited reliability and timeliness of the information provided. In any case, our price information is the best available in the context and there is currently no way to improve. We speculate that the traders’ perception of unreliability toward our prices (local millers’ price) comes from the gap with their actual purchase prices (most likely farm-gate price), and that such a gap is larger for those who make intensive searches in remote villages. Investigating the extent of this price gap and its correlation with trader characteristics may be an interesting topic for future research, with important implication on the choice of price in studying regional market integration.
Second, our finding of arbitrage under-performance may be exaggerated if rice is more finely differentiated than our classification of major varieties. Primary Hedonic pricing analysis does indicate price differences within each variety depending on product characteristics (Sakurai and Arimoto 2014), which can imply that some traders may be purchasing at a higher price because the produce characteristics or quality is different. How suppliers, traders, and consumers recognize and evaluate variety, quality, and other characteristics is an important question that remains to be
19 understood in Madagascar’s rice market.
Third, our study sample is limited to traders in Tana, who are buyers. Traders based in production districts acting as sellers may behave differently; therefore, we should be cautious when generalizing our findings and interpretations.
Given the first limitation on price information provided, while we safely claim that the provision of the best price information currently available in Madagascar to rice traders did not improve arbitrage performance, we do not interpret and assert that our result provides conclusive evidence that transmitting market information is meaningless or that information friction is not a major obstacle to improving arbitrage. In fact, supporting descriptive evidence does suggest the importance of information friction. However, we also emphasize the presence of obstacles other than information friction, and call for attention to non-price factors such as quality uncertainty and matching to improve arbitrage and develop efficient agricultural markets.
References
Allen, Treb (2014) “Information frictions in trade,” Econometrica, 82(6): 2041-2083.
Aker, Jenny C. (2010) “Information from Markets Near and Far: Mobile Phones and Agricultural Markets in Niger,” American Economic Journal: Applied Economics, 2:46–59.
Aker, Jenny C., and Fafchamps, Marcel (forthcoming) “Mobile Phone Coverage and Producer Markets: Evidence from West Africa,” World Bank Econ Review. (first published online
October 8, 2014 doi:10.1093/wber/lhu006)
Aker, Jenny C., and Mbiti, Isaac M. (2010) “Mobile Phones and Economic Development in Africa,”
Journal of Economic Perspectives, 24(3): 207-232.
Arimoto, Yutaka., Kono, Hisaki, Sakurai, Takeshi., and Takahashi, Kazushi (2014) “Toward a Better Understanding of the Rice Market in Madagascar: Preliminary Analysis with the Threshold Autoregression (TAR) Model,” in An Evidence-Based Study of the Innovative Anti-Poverty Practices and Market Institution (Interim Report), ed. Kazushi Takahashi. Chiba: IDE-JETRO.
Butler , J. S., and Moser, Christine (2010) “Structural Model of Agricultural Markets in Developing Countries,” American Journal of Agricultural Economics, 92(5):1364–1378.
Camacho, Adriana., and Conover, Emily (2011) “The Impact of Receiving Price and Climate Information in the Agricultural Sector,” IDB Working Paper Series, No. IDB-WP-220.
Courtois, Pierre., and Subervie, Julie (forthcoming) “Farmer Bargaining Power and Market Information Services,” American Journal of Agricultural Economics. (first published online
June 22, 2014 doi:10.1093/ajae/aau051)
20
Economic Development and Cultural Change, 49(2): 229-267.
Fafchamps, Marcel., and Minten, Bart. (2002) “Returns to social network capital among traders,”
Oxford Economic Papers 54(2): 173-206.
Fafchamps, Marcel., and Minten, Bart (2012) “Impact of SMS-based Agricultural Information on Indian Farmers,” The World Bank Economic Review, 26(3): 383-414.
Fackler, Paul L., and Barry K. Goodwin (2001) “Spatial price analysis,” in Handbook of Agricultural Economics, Vol 1, eds. B. Gardner and G. Rausser, ch. 17, pp.971–1024.
Goyal, Aparajita (2010) “Information, Direct Access to Farmers, and Rural Market Performance in Central India,” American Economic Journal: Applied Economics, 2:22–45.
Jensen, Robert (2007) “The Digital Provide: Information (Technology), Market Performance and Welfare in the South Indian Fisheries Sector,” Quarterly Journal of Economics, 122(3): 879–
924.
Jensen, Robert (2010) “Information, Efficiency and Welfare in Agricultural Markets,” Agricultural Economics, 41(s1): 203–216.
Mendoza, M., and J. C. Randrianarisoa (1998) “Structure and Behavior of Traders: The Case of Market Reform in Madagascar,” International Food Policy Research Institute, mimeo.
Miyake, Hajime., and Sakurai, Takeshi (2012) “Improvement of Transportation Infrastructure and Integration of Agricultural Market: An Analysis of Rice Market in Madagascar,” Economic Research (Keizai Kenkyu), 63(3): 209–226. (in Japanese)
Moser, Christine., Barret, Christopher., and Minten, Bart (2009) “Spatial integration at multiple scales: rice markets in Madagascar,” Agricultural Economics, 40(3):281–294.
Nakasone, Eduardo (2014) “The Role of Price Information in Agricultural Markets: Experimental Evidence from Rural Peru,” mimeo.
Nakasone, Eduardo., Torero, Maximo., and Minten, Bart (2014) “The Power of Information: The ICT Revolution in Agricultural Development,” Annual Review of Resource Economics,
6:533-550.
Sakurai, Takeshi., and Arimoto, Yutaka (2014) “Characterization of Rice Market in Madagascar: Focusing on Price and Quality Relationship,” in An Evidence-Based Study of the Innovative Anti-Poverty Practices and Market Institution (Interim Report), ed. Kazushi Takahashi. Chiba: IDE-JETRO.
Sexton, Richard J., Kling, Catherine L., and Carman, Hoy F. (1991) “Market integration, efficiency of arbitrage and imperfect competition: Methodology and an application to U.S. celery,”
American Journal of Agricultural Economics, 73(3):568–580.
Svensson, Jacob., and David Yanagizawa (2009) “Getting prices right: the impact of the market information service in Ugadan,” Journal of European Economic Association, 7(2–3):435–445.
21
Behavior in Niger,” American Journal of Agricultural Economics, 96(5): 1439–1454.
Figur
res
B Bon F Itasy Boeny ngolava Figure 1. Map So 22 p of Madaga ofia ascar (regionns) Analamang (Tana) A ga Alaotra-ManngoroFigure 2. Ma
23
24
Tables
Table 1. Summary statistics of sample traders
Variable Source Obs Mean S.D. Min Max
or n or %
Rice trading
Engaged in active inter‐district trade, 2012–13 (dummy) Periodic 224 104 46.4% 0 1
Engaged in passive inter‐district trade, 2012–13 (dummy) Periodic 224 209 93.3% 0 1
Engaged in within‐Tana trade, 2012–13 (dummy) Periodic 224 198 88.4% 0 1
(within‐Tana trade) Purchased at Anosibe market (dummy) Periodic 198 129 65.2% 0 1
(within‐Tana trade) Purchased at Androavoahangy market (dummy) Periodic 198 49 24.7% 0 1
(within‐Tana trade) Purchased from local sellers in Tana (dummy) Periodic 198 140 70.7% 0 1
Total amount of rice purchased, 2012–13 (milled‐rice equivalent, ton) Periodic 224 341.8 581.6 0 6749.6
Number of workers engaged in rice trading Baseline 224 5.4 4.2 1 49
Years running rice trading Baseline 224 8.2 6.7 1 32
Have updated "carte collecter" (dummy) Baseline 224 82 36.6% 0 1
Pay wholesale tax (dummy) Baseline 224 152 67.9% 0 1
Keep income statements (dummy) Baseline 224 90 40.2% 0 1
Sell imported rice (dummy) Baseline 224 173 77.2% 0 1
Business diversification
Sell food other than rice (dummy) Baseline 224 156 69.6% 0 1
Sell non‐food items (dummy) Baseline 224 97 43.3% 0 1
Operate rice mill (dummy) Baseline 224 36 16.1% 0 1
Rent out truck or vehicle (dummy) Baseline 224 47 21.0% 0 1
Profit share of rice trading Baseline 222 0.647 0.311 0.02 1
Representative
Representative's age Baseline 220 37.1 9.6 20 69
Representative is male (dummy) Baseline 224 111 49.6% 0 1
Representative is literate (dummy) Baseline 224 221 98.7% 0 1
Representative's education level (dummy)
None Baseline 221 2 0.9% 0 1
Primary Baseline 221 42 19.0% 0 1
Lower secondary Baseline 221 79 35.7% 0 1
Upper secondary Baseline 221 61 27.6% 0 1
Higher Baseline 221 37 16.7% 0 1
Asset
Have store for selling rice (dummy) Baseline 224 186 83.0% 0 1
Have private storage (dummy) Baseline 224 194 86.6% 0 1
Total capacity of private storage (ton) Baseline 224 28.2 94.3 0 1000
Own vehicle (dummy) Baseline 221 61 27.6% 0 1
Own truck (dummy) Baseline 224 77 34.4% 0 1
Own cell phone (dummy) Baseline 223 201 90.1% 0 1
Use mobile money for general purpose (dummy) Baseline 223 24 10.8% 0 1
25
Table 2. Number of different districts purchased from in inter-district trade
Note: “Number of different districts purchased from” is the number of different districts in which our sampled traders made actual purchases. The unit of observation is round–activity–variety ( 27 2 3 162). The summary statistics are calculated over rounds (N = 27).
Table 3. Summary statistics on arbitrage performance
Note: The unit of observation is trader–round–activity–variety.
Activity Variety Mean S.D. Min Max
Vary gasy 8.6 1.2 7 11 Tsipala 10.3 1.7 8 15 Makalioka 3.6 1.4 2 8 Vary gasy 7.9 1.5 4 11 Tsipala 7.5 1.6 5 11 Makalioka 2.7 1.6 1 7 Passive Active
Variable Obs Mean S.D. Min Max
or n or % A. Dummy if purchased from the cheapest district
All transactions 14,422 1,675 11.6% 0 1
Passive inter‐district trades (incl. within‐Tana trades) 11,954 1,214 10.2% 0 1
Vary gasy 4,130 264 6.4% 0 1
Tsipala 3,619 336 9.3% 0 1
Makalioka 4,205 614 14.6% 0 1
Active inter‐district trades 2,468 461 18.7% 0 1
Vary gasy 969 93 9.6% 0 1
Tsipala 783 102 13.0% 0 1
Makalioka 716 266 37.2% 0 1
B. Actual–optimal price ratio
All transactions 14,422 1.072 0.099 0.638 2.509
If purchased from the optimal district 1,675 1.005 0.057 0.680 1.480
If not purchased from the cheapest district 12,747 1.081 0.100 0.638 2.509 Passive inter‐district trades (incl. within‐Tana trades) 11,954 1.061 0.070 0.729 1.759
Vary gasy 4,130 1.071 0.083 0.743 1.759
Tsipala 3,619 1.073 0.070 0.729 1.653
Makalioka 4,205 1.040 0.050 0.790 1.386
Active inter‐district trades 2,468 1.128 0.171 0.638 2.509
Vary gasy 969 1.143 0.165 0.680 1.847
Tsipala 783 1.108 0.112 0.788 1.891
26
Table 4. Price dispersion across purchase districts
Note: All statistics (mean, max, and S.D.) are calculated for each round–activity–variety ( 27 2 3 162) based on district-level price, and then averaged over 27 rounds. “Number of districts purchased from” is the number of different districts where we observed actual purchases made by our sampled traders. For passive purchases, three modes of within-Tana trade are also considered as “districts.” “Price ratio compared to the cheapest district” represents the ratio of price in each district to the price in the cheapest district. “Adjusted ME-price” (S.D.) in column (4) is the standard deviation of district prices within each round–activity–variety.
Table 5. Price searches in 36 listed districts
(1) (2) (3) (4)
Number of Adjusted
districts ME‐price
Activity Variety purchased Mean Max S.D.
Vary gasy 11.6 1.078 1.159 50.3 Tsipala 13.3 1.076 1.155 51.4 Makalioka 6.6 1.043 1.080 34.0 Vary gasy 7.9 1.138 1.239 79.9 Tsipala 7.5 1.130 1.253 104.5 Makalioka 2.7 1.093 1.162 98.7
Price ratio compared to the cheapest district
Passive (incl. within‐Tana trade)
Active
Variable Obs Mean S.D. Min Max
or n or %
A. Trader level
Searched price in 36 listed districts (dummy)
All traders 224 213 95.1% 0 1
Passive‐only traders 120 109 90.8% 0 1
Active traders 104 104 100.0% 0 1
(If searched) Number of districts searched price
All traders 213 5.1 3.1 1 20
Passive‐only traders 109 4.5 3.0 1 12
Active traders 104 5.8 3.1 1 20
B. Trader‐round level (per round)
Searched price in 36 listed districts (dummy)
All traders 6,033 4,599 76.2% 0 1
Passive‐only traders 4,405 3,030 68.8% 0 1
Active traders 1,628 1,569 96.4% 0 1
(If searched) Number of districts searched price
All traders 4,599 2.1 1.8 1 12
Passive‐only traders 3,030 2.0 1.9 1 11
27
Table 6. Summary statistics of the number of districts purchased from in inter-district trade
Note: Number of districts purchased from does not include the three modes of within-Tana trade.
Variety Obs Mean S.D. Min Max Obs Mean S.D. Min Max Obs Mean S.D. Min Max Obs Mean S.D. Min Max Obs Mean S.D. Min Max A. Trader level All varieties 222 4.0 1.9 1 10 118 4.2 2.2 1 10 104 3.8 1.7 1 10 91 3.2 1.5 1 7 104 2.3 1.5 1 10 Vary gasy 212 2.5 1.2 1 7 112 2.4 1.3 1 7 100 2.5 1.2 1 7 81 2.1 1.0 1 6 87 1.8 1.1 1 6 Tsipala 200 2.7 1.5 1 8 107 2.9 1.7 1 8 93 2.5 1.3 1 6 75 2.2 1.1 1 5 81 1.7 1.0 1 6 Makalioka 210 1.3 0.6 1 4 114 1.2 0.5 1 4 96 1.3 0.6 1 3 78 1.2 0.5 1 3 66 1.2 0.5 1 3 Import 61 1.1 0.3 1 2 38 1.1 0.2 1 2 23 1.2 0.4 1 2 20 1.1 0.3 1 2 6 1.3 0.5 1 2 Don't know