143
ERS-l
ICE MONITORING
OF THE
NORTHERN
SEA ROUTE
Ola M. Johannessen, Stein Sandven, Lasse H. Pettersson, Martin W. Miles, Kjell Kloster
Nansen Environmental andRemote Sensing CenterEdvard Griegsvei 3a, N-5037 Solheimsvik, Norway phone:
+
47 552972 88, fax:+
47 55 200050Vladimir V.
Melentyev
Nansen International Environmental and Remote Sensing Center Korpusnaya Str. 18, 197042 St. Petersburg, Russia phone:
+
78122357493, fax:+
78122354361ABSTRACT
The ice conditions off the Siberian coast, which has recently been opened for international ship traffic, impose severe restrictions on the navigation along the Northern Sea Route. The Russian icebreaker fleet, which is responsible for all sea transportation in the area, uses an extensi ve ice monitoring and forecasting service to assist in the navigation. Presently, this service does not utilize existing SAR data from satellite. In a pilot demonstration project ERS-l SAR images have been used to monitor sea ice conditions in the Kara Sea at different times of the year. The SAR images have shown good capability to map drifting mul tiyear and first year ice, landfast ice, leads/polynyas and areas of thin ice. The results of the demonstration have been presented to the Russian Ice Service including some icebreakers. SAR images, which will cover larger areas and be available from several satellites from 1995, are expected to become an important component in the ice monitoring system for the Northern Sea Route.
1. INTRODUCTION
The possibility to monitor sea ice independent of daylight and cloud cover has improved considerably by the launch of the ERS-l satellite in July 1991 [Ref. 1]. The ERS-l has proved that SAR is an excellent instrument for detection, classification and monitoring of the sea ice distribution in many areas. The Nansen Environmental and Remote Sensing Center (NERSC) and the Troms¢ Satellite Station (TSS) of the Norwegian Space Centre provide SAR data for real-time sea ice monitoring in European sector of the Arctic including the Kara Sea (Ref. 2). ERS-l SAR images are down-linked and processed at TSS. Then the images are transmitted to NERSC for analyis, production of interpreted maps and distribution to end users [Ref. 3]. In addition, the SAR data can be coupled with passive microwave data from the Special Sensor Microwave Imager (SSMII) of the Defense Meteorological Satellite Program to resolve the larger-scale ice coverage.
NERSC first demonstrated use of ERS-l SAR data for near real-time ice mapping of the Northern Sea Route in August 1991, only a few weeks after the launch of the
ERS-l satellite. SAR derived sea ice maps were then sent by telefax to the French polar vessel "L' Astrolabe" during her voyage through the Northeast Passage from Norway to Japan [Ref. 4]. This demonstration was evaluated as very interesting by the captains and sea ice experts onboard the Russian icebreakers which escorted L'Astrolabe through the ice-covered parts of the route. A second and more extensive demonstration was carried out in November 1993 using the icebreaker" Sovetsky Soyuz". In addition to the navigational aspects this experiment also had scientific objectives such as improved understanding of sea ice phenomena in the Kara Sea and their SAR signatures. The main results of the experiment are discussed in this paper.
40 50 60 70 80 90 100 11 a
75
70
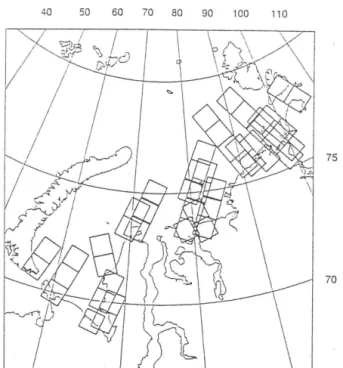
Figure 1. Map of the Kara Sea region showing coverage of ERS-l SAR images in the period from October 30 to November 9 1993.
2. SAR IMAGE ACQUISITION AND PROCESSING Through ESA's application oriented pilot project in the Kara Sea [Ref. 5] SAR data were obtained as shown in Fig. 1. The data needed in near real time were obtained
from TSS, whereas off-line data were obtained from the ESA archive. Both TSS and the ESA ground station in Kiruna can downlink and process SAR data from the Northern Sea Route west of Cape Chelyuskin. The data delivered from TSS were images with 100 m pixel size (LRI-images) which were readily transmitted by computer network to NERSC. The transmission time is abom 8 minutes per scene. TSS can thus deliver up to 10 scenes within 1 hour of the ERS-l overpass. At NERSC the following image analysis steps are carried out: 1) Reduction of data by averaging each scene to 8 bit and 200 m pixel size, 2) normalization of values across-track (correction of antenna-gain etc.), 3) two consecutive scenes are merged into one image, 4) marking of 0.5° lat. by 2° long. gridlines, 5) annotation of land/islands and interesting ice/ocean features, 6) histogram equalization of the image before a print to hardcopy in A4 format, 7) print of annotated ice map separated from the image, 8) production of a compressed image for file transmission, and 9) transmission of images and maps to the ship by telefax. This is the basic procedure necessary to enhance and compress the most important ice information in the SAR images, and sent it out to the icebreaker within 2 - 3 hours after the satellite overpass. Further interpretation and classification of the images were done onboard the icebreaker.
3. THE DEMONSTRATION CAMPAIGN The demonstration project was carried out onboard the nuclear ice-breaker "Sovetsky Soyuz" during an expedition from Murmansk to the Chukchi Sea and back. "Sovetsky Soyuz" is one of the largest icebreakers of Murmansk Shipping Company, with 21.000 tons displacement and engine power of 75.000 horsepower. She is equipped with the modern satellite navigation and communication systems such as Inmarsat A station with telefax. Dr. Melentyev from NIERSC participated in the expedition as an ice scientist with special responsibility to interpret the SAR images sent to the ship and obtain accurate in situ observations of the ice conditions.
The acquisition of SAR data was coordinated day by day with the icebreaker's sailing schedule. Due to limited spatial and temporal coverage of SAR it was difficult to match the SAR images exactly to the icebreaker's position. However, in some cases near real time information of the ice conditions along the sailing route could be obtained from the SAR images. These cases are described in section 4.
The "Sovetsky Soyuz" departed from Murmansk on 30 October with the task to escort two cargo ships ("Mikhail Kutusov" and "Kapitan Kudlai") eastwards to the Chuckchi Sea where the eastern boundary of the drifting sea ice was located near 178°E. The icebreaker operated in the coverage area of TSS until 8 November when it passed eastward of Cape Chelyuskin. In the passage of Vilkitskogo Strait, where the ice conditions can be very difficult, the icebreaker "Yamal" also took part in the escort. "Yamal" received the same SAR images as "Sovetsky Soyuz" in this area. The SAR-images were also transmitted to the Western Arctic Marine Operations
Headquarters in Dikson, which is responsible for the operational ice monitoring and forecasting service west of Cape Chelyuskin. The demonstration project ended after "Sovetsky Soyuz" had returned to the Kara Sea region at the end of November.
As the SAR images were received on board "Sovetsky Soyuz", the ice specialist who was responsible for analysis of the ice conditions, interpreted and evaluated the SAR images. The official Russian sea ice maps provided to the ship from the Marine Operation Headquarter were used as the basis for the navigatiori, and the detailed SAR images were used as a supplement.
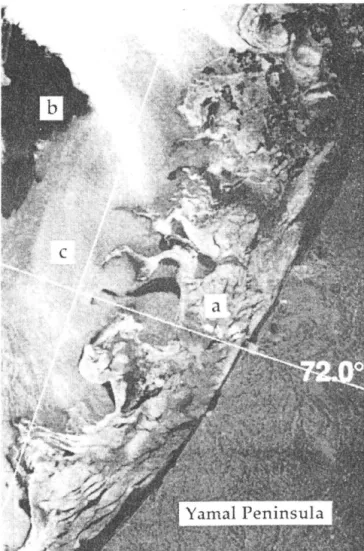
Figure 2. SAR image from October 29 1993 covering 50 by 75 km of the west coast of Yamal peninsula. a: nilas and gray ice less tahn 15 cm thick, b: grease ice and frazil ice, c: open water. Original data © ESAffSS 1993.
4. CASE STUDIES OF SEA ICE CONDITIONS
4.1 The ice edge region during freeze-up
The usefulness of ERS-l SAR for detection of ice edge features such as new ice formation was demonstrated as the icebreaker entered the icepack on its eastward voyage. The SAR image on October 29 (Fig. 2) was acquired during cloudy conditions when no other ice information
was available from this area. The region of open water is clearly resolved as a bright, fairly uniformly-white area in the SAR image. The first stage of new ice formation (grease ice or frazil ice) is shown as dark signatures in the image, whereas pancake ice or other gray ice which can be a few days old have a bright signature similar to open water. However, the image texture of the gray ice is clearly different from the of the open water, as is clearly seen along the Yamal coast where a meandering ice edge with several ice tongues were observed on October 29 1993 (Fig. 2). Such signatures have been well documented also in other regions [Ref. 1]. When in situ observations were made from the icebreaker good correspondence was found between the variations in the SAR backscatter and alternating areas of open water and new ice.
145
4.2 Residual ice in Vilkitskogo Strait
ERS-l SAR mages were also used to detect different ice types in the Vilkitskogo Strait which is a particularly difficult area for ice navigation. Thick residual floes
(second - year ice) often occur in this region where differential ice motion causes heavy compression and ridging of the ice pack. The large thick floes, heavy ridges and as well as landfast ice make it difficult to navigate even for the most powerful icebreakers. The SAR image of 4 November 1993 shows examples of the ice types which often occurs in the the Vilk.itskogo Strait (Fig. 3). For comparison the Russian ice map of the same area is shown in Fig. 4.
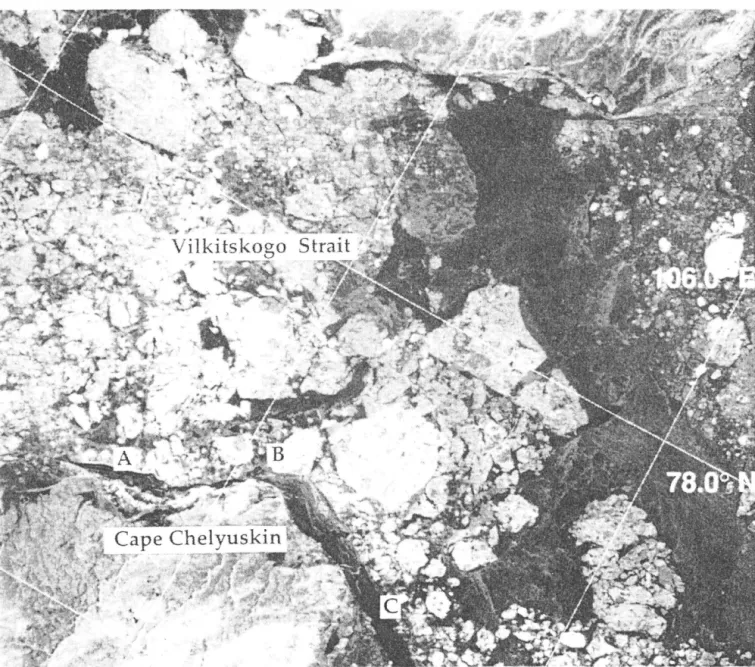
Figure 3. SAR image from November 4 1993 covering 100 by 100 km of the Vilkitskogo Strait. The icebreaker navigated along the flaw lead marked A - B - C. The bright floes are residual ice which can be more than 3 m thick, whereas the dark areas are first-year ice less than 50 cm thick. Original data © ESAJTSS 1993.
146
The "Sovetsky Soyuz" navigated along the Taimyr coast where three main ice types where found and recognized in the SAR image: (1) gray-white ice 15-30 cm thick, (2) thin first-year ice about 40 cm thick, and (3) residual ice about 3 m thick. Residual ice has a high backscatter, represented by a light-gray tone in the SAR image, in contrast to the darker young and thin white ice. The identification of residual ice from the SAR image is also possible by studying the flow shape; the older floes generally have a more rounded shape. For example, the residual floe marked B in Fig. 3 was documented by the icebreaker "Y amal". Mapping of residual ice is very important because navigation through such ice is difficult and should be avoided. The SAR image of 4 November provided useful information for the icebreakers to find the
CAPE CHELYUSKIN
year ice
Figure 4. Russian ice map from the same area and period
as the SAR image in Fig. 3. The ice concentration for each ice type is shown in tenths.
best sailing route. Navigation through the flaw lead along the Taimyr coast was much faster and less difficult and hazardous than through alternative routes, because the flaw lead was covered with thin new ice (dark SAR signature)
4.3 First-year ice types in the No rdenskjold Archipelago
Landfast ice, which is common around islands and along the margins of the Kara Sea, has variable thickness and can be heavily ridged. Icebreaker navigation in landfast ice such as in the Mathiessen Strait can therefore be difficult. The varied nature of the ice in this strait can be seen in the SAR image of 15 November (Fig. 5). This image was particularly useful because it was received and used by "Sovetsky Soyuz" during its westward return through this region. The ice near the west entrance to Mathiessen Strait (site A in Fig. 5) was observed to consist of:
(1 ) Young ice 5 - 20 cm thick with dark SAR signature. (2) 1 -2 km large mostly smooth, snow-free floes 30-40
cm thick observed near the fast ice boundary. The SAR image clearly reveals the location of the boundary and its extension around the small islands of the Nordenskjold Archipelago. At site A this border
was crossed by the icebreaker.
(3) Highly compressed and ridged first-year ice at site B. Further west (site C) the ice was fairly inhomogeneous
with considerable ridging. The SAR signature of the ridged region is a mixture of brighter and darker· patches. The navigation through this region was rather difficult.
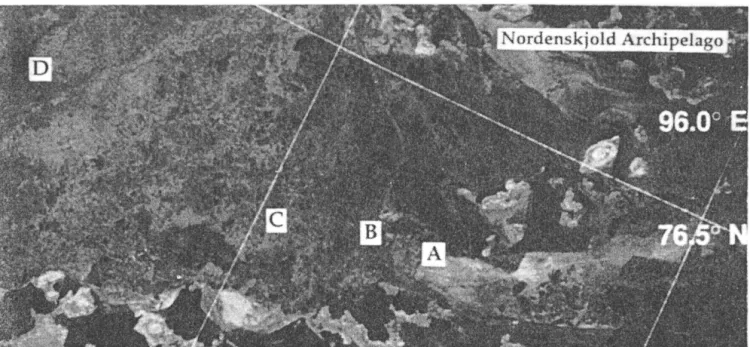
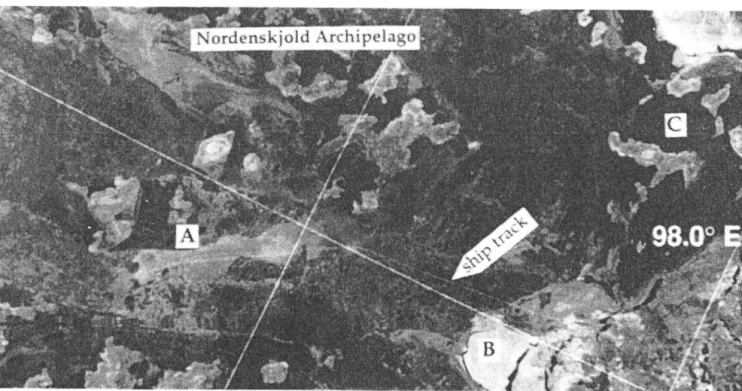
Figure 5. SAR image of the Mathiessen Strait in the Nordenskjold Archipelago from November 15 1993. Observations of ice conditions from the icebreaker were made along the route marked A - B - C - D. The image covers 100 by 50 km. Original data © ESAffSS 1993.
The ice experts onboard "Sovetsky Soyuz" assumed that the relatively dark area in the western part of the image (site D) was smooth and fairly thin ice. Therefore, the captain changed the icebreaker route into this region. From site C to D the icebreaker penetrated ice of varying roughness, which was reflected by the variable SAR signature. At site D observations confirmed that the homogeneous dark SAR signature was 100 % thin ice. Another ERS-l SAR scene of the Mathiessen Strait area was obtained on 28 November and sent to "Sovetsky Soyuz" after the ship had passed through the area (Fig 6). In this period the region was cloud-covered, no other ships were present and no aircraft flights were made, so there was no updated ice information from the area. Therefore the SAR images were the only source of information which could be used by the icebreaker to update the ice maps and plan the sailing routes. The image interpretation done by the ice experts showed several ice types and dynamic features in the region: (1) The track of the "Sovetsky Soyuz" in the ice during its westward voyage two weeks earlier. (2) The boundary between thin first-year ice with different degrees of ridging (site A in Fig. 6) and the landfast ice around the islands of the Nordenskjold Archipelago. (3) A region of 90 - 100 % concentration of pancake ice causing high backscatter and bright signature in the SAR image (site B). (4) New landfast ice in bays, inlets and estuaries formed during calm weather. This ice is identified as dark homogeneous areas in the SAR image (site C).
147
5. CONCLUSION
The demonstration has shown that there are both advantages and disadvantages of using ERS-l SAR images for ice navigation. The main advantages are: (1) SAR images can be used for detailed mapping of the ice edge and localize leads, thin ice types, landfast ice. and thick multi-year ice, (2) SAR images are independent of cloud and light conditions, and (3) SAR images are available in near real-time. The disadvantages are: (1) the interpretation of the ice types can be difficult in some cases, (2) detection of ridges is generally not feasible, (3) the quality of the images are reduced by telefax transmission, and (4) the coverage is not sufficient for regular monitoring. However, the SAR coverage will be improved when RADARSAT is in operation in 1995. Up to 500 km wide swaths will be available, which means that most of the NSR will be covered every third day. The future plan is to make regular SAR ice monitoring from operational radar satellites available for the Russian ice service and thereby for all activities on the Siberian coast which need ice information.
6. ACKNOWLEDGEMENT
The project has been supported by European Space Agency, Norwegian Space Centre and Murmansk Shipping Company.
Figure 6. SA:-R imag~ of th~ Mathiessen St~ait fr~m November 28 1993 after the "Sovetsky Soyuz" had passed through the area. Th~ ShIP track In the Ice. can be s~en In the Image. A: boundary between landfast ice and drifting first year ice, B:
7. REFERENCES
1. Sandven, S., O. M. Johannessen, R. A. Shuchman, K. Kloster and M. W. Miles. SIZEX 92 ERS-l SAR ice validation experiment. Proceedings of Second ERS-l Symposium - Space at the Service of our Environment, Hamburg, Germany, 11 - 14 October 1993, ESA SP-361 1994, pp. 353 - 358.
2. Sandven, S, O. M. Johannessen, L. H. Pettersson, M. W. Miles and A. Drottning. A pilot ice monitoring service using ERS-1 SAR images. Proceedings of 1st ERS-1 Pilot Project Workshop, Toledo, Spain, 22 -24 June 1994. 3. Sandven S., O. M. Johannessen and K. Kloster. Pre-operational use of Synthetic Aperture Radar (SAR) images from the ERS-1 satellite in sea ice monitoring. Proceedings of the International Symposium
'Operationalization of Remote Sensing' Enschede, The
Netherlands, 19 - 23 April 1993, Vol. 5, pp. 125 - 136. 4. Johannessen, O. M., S. Sandven,
0.
Skagseth, K. Kloster, Z. Kovacs, P. Sauvadet, L. Geli, W. Weeks and J. Louet. ERS-l SAR ice routing of L'Astrolabe" through the Northeast Passage. Proceedings of the Central Symposium of the 'International Space Year' Conference,Munich, Germany, 30 March -4 April 1992. ESA SP-341
1992, pp. 997 - 1002.
5. Johannessen, O. M., and S. Sandven. Real time monitoring of sea ice in the Northeast Passage by ERS-l SAR data. Accepted proposal to ESA's Second Call for Proposals for Application Oriented Pilot Projects based on the use of ERS-1 data. Bergen, September 1992, 12 pp.